
Houses for sale in Charterlands, Ivybridge
House Prices in Charterlands
Properties in Charterlands have an average house price of £453k and had 22 Property Transactions within the last 3 years¹.
Charterlands is an area in Ivybridge, Devon with 251 households², where the most expensive property was sold for £900k.
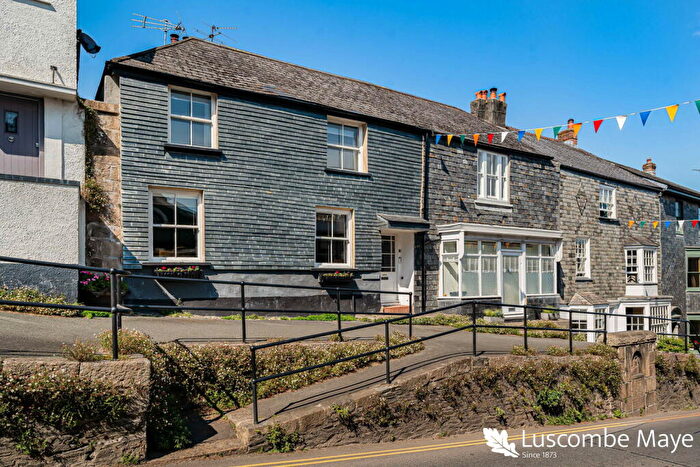
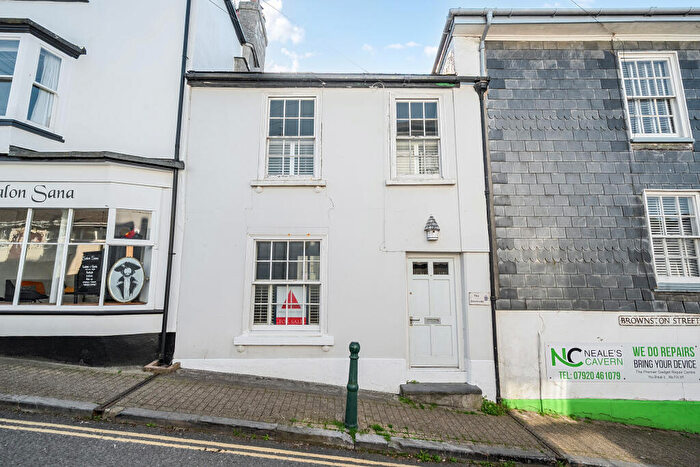
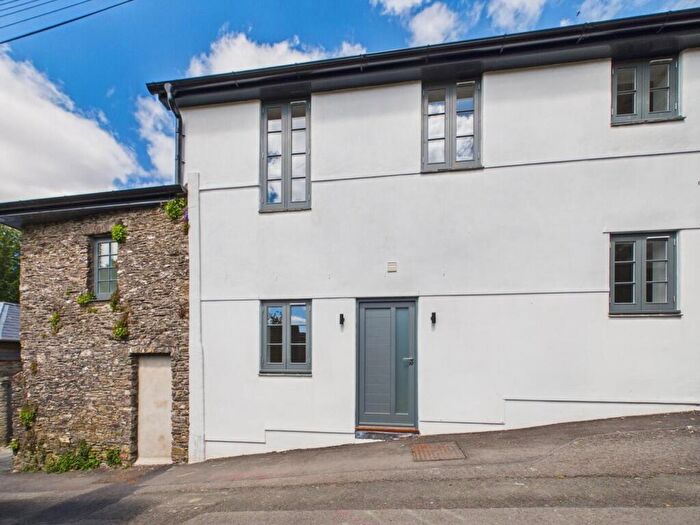
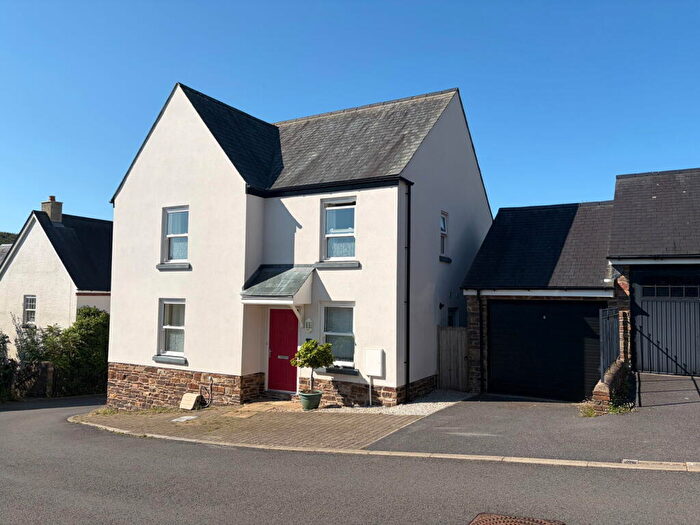
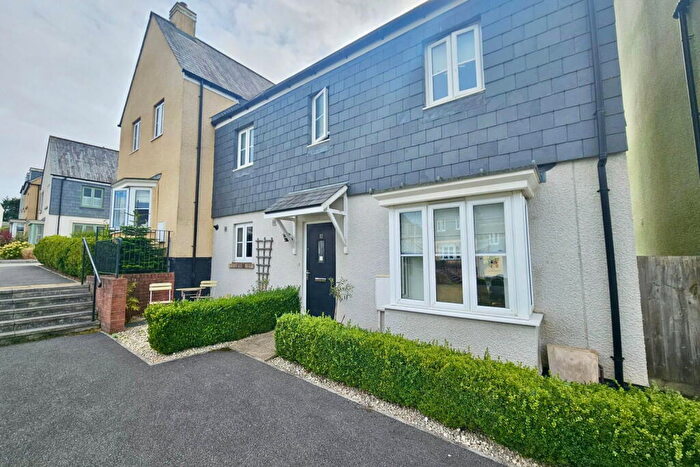
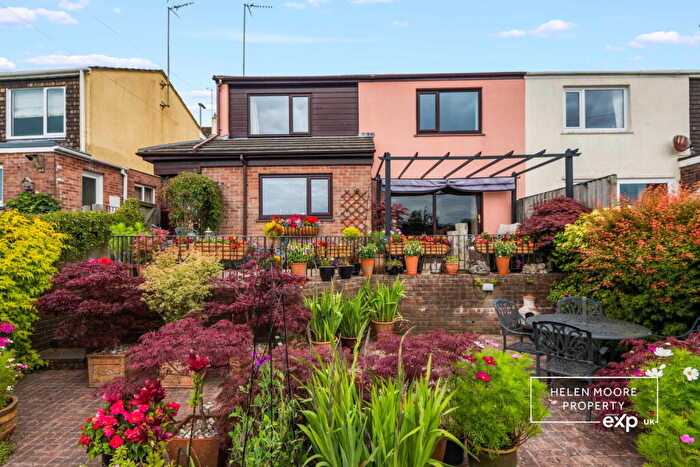
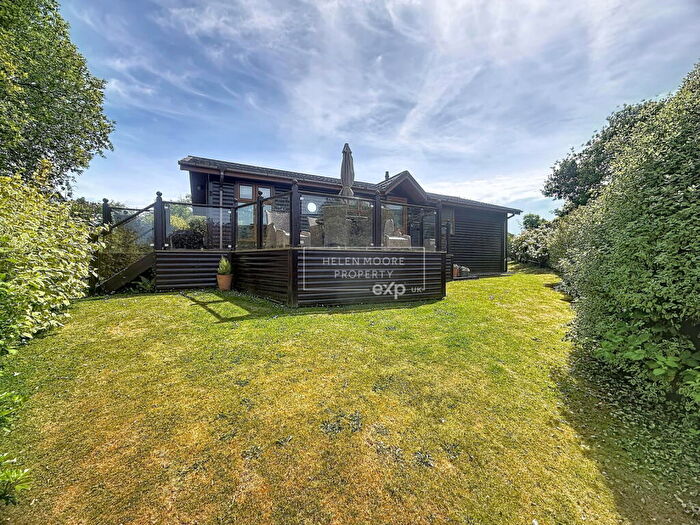
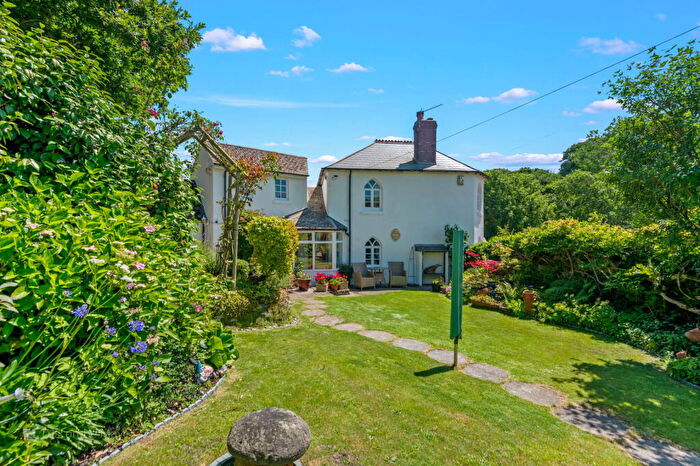
Properties for sale in Charterlands
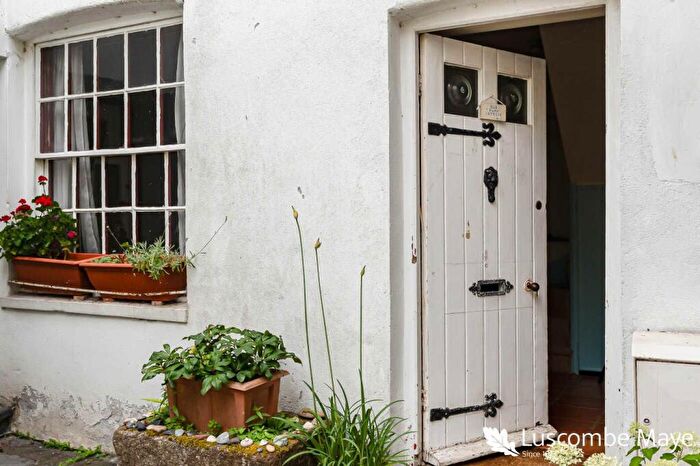
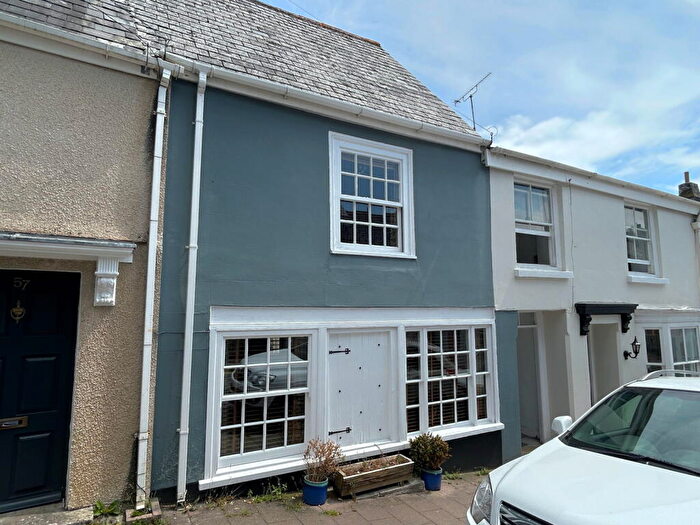
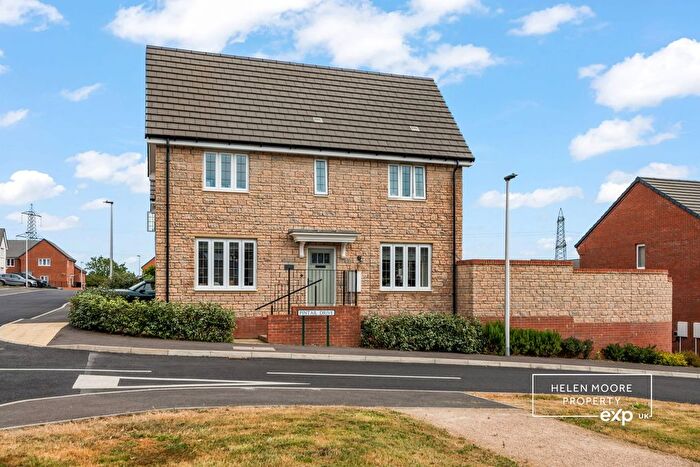
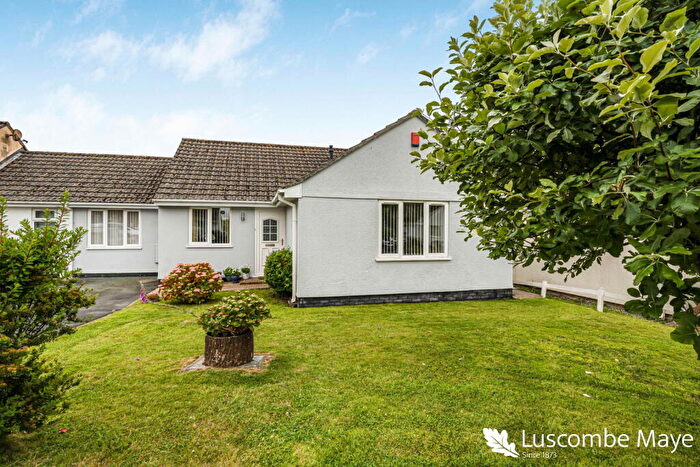
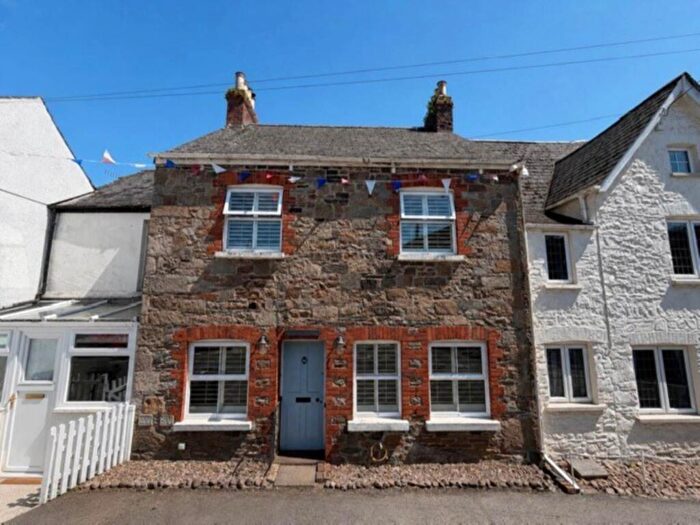
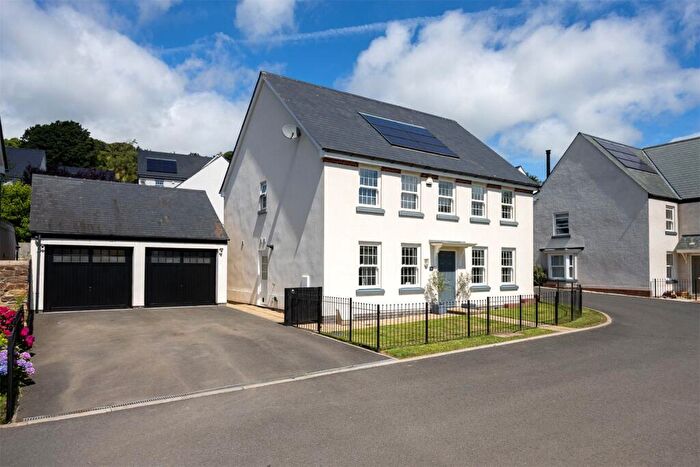
![]()
If you are looking to sell your house, let it out, or receive a property valuation, an expert can help you.
Click the button below to get started.
Roads and Postcodes in Charterlands
Navigate through our locations to find the location of your next house in Charterlands, Ivybridge for sale or to rent.
| Streets | Postcodes |
|---|---|
| Chatwell Lane | PL21 0FS |
| Higher Green Park | PL21 0FZ |
| Lanveoc Way | PL21 0FW |
| Little Orchard Close | PL21 0FY |
| Lower Green Park | PL21 0FU |
| Moyles Park | PL21 0FF |
| New Road | PL21 0PR |
| Pearse Gardens | PL21 0FX |
| Poundwell | PL21 0XX |
| Poundwell Meadow | PL21 0QL |
| Red Devon Court | PL21 0PT |
| PL21 0XE PL21 0LW PL21 0SB PL21 0SD PL21 0SE PL21 0SP PL21 0SS PL21 0ST PL21 0SU PL21 0SX PL21 0TD PL21 0TF PL21 0TH PL21 0TS PL21 0TW |
Property price trends in Charterlands
According to the latest Land Registry data, the average home in Charterlands sold for £410,000 in 2026. That figure comes from 156 sales logged over the past 30 years.
Prices have fallen back over the last three years. Compared with 2023, when the typical sale came in around £532,500, that's a fall of roughly 23%.
Looking back five years, average prices are up about 6.9% since 2021, a gain of around £26,500 in cash terms.
Zoom out to the past decade for the fuller picture. Back in 2016, homes here averaged £472,250, so the typical sold price has fallen about 13.2% since then, around 1.4% a year lower. Stretch the view to fifteen years and that annual pace edges up closer to -0%.
Frequently asked questions about Charterlands
What is the average price for a property for sale in Charterlands?
The average price for a property for sale in Charterlands is £452,977. This amount is 36% higher than the average price in Ivybridge. There are 426 property listings for sale in Charterlands.
What streets have the most expensive properties for sale in Charterlands?
The streets with the most expensive properties for sale in Charterlands are Little Orchard Close at an average of £474,428, Pearse Gardens at an average of £422,500 and Higher Green Park at an average of £394,000.
What streets have the most affordable properties for sale in Charterlands?
The streets with the most affordable properties for sale in Charterlands are New Road at an average of £205,000, Moyles Park at an average of £315,000 and Lower Green Park at an average of £365,666.
Which train stations are available in or near Charterlands?
Some of the train stations available in or near Charterlands are Ivybridge, Totnes and Plymouth.
Property Price Paid in Charterlands by Year
The average sold property price by year was:
| Year | Average Sold Price | Price Change |
Sold Properties
|
|---|---|---|---|
| 2026 | £410,000 | 6% |
1 Property |
| 2025 | £386,375 | -21% |
8 Properties |
| 2024 | £467,071 | -14% |
7 Properties |
| 2023 | £532,500 | 31% |
6 Properties |
| 2022 | £370,018 | -4% |
4 Properties |
| 2021 | £383,500 | 6% |
5 Properties |
| 2020 | £359,141 | 3% |
31 Properties |
| 2019 | £350,025 | -3% |
16 Properties |
| 2018 | £359,928 | 14% |
35 Properties |
| 2017 | £308,322 | -53% |
18 Properties |
Property Price per Property Type in Charterlands
Here you can find historic sold price data in order to help with your property search.
The average Property Paid Price for specific property types in the last three years are:
| Property Type | Average Sold Price | Sold Properties |
|---|---|---|
| Semi Detached House | £404,500.00 | 11 Semi Detached Houses |
| Terraced House | £365,333.00 | 3 Terraced Houses |
| Detached House | £552,500.00 | 8 Detached Houses |
