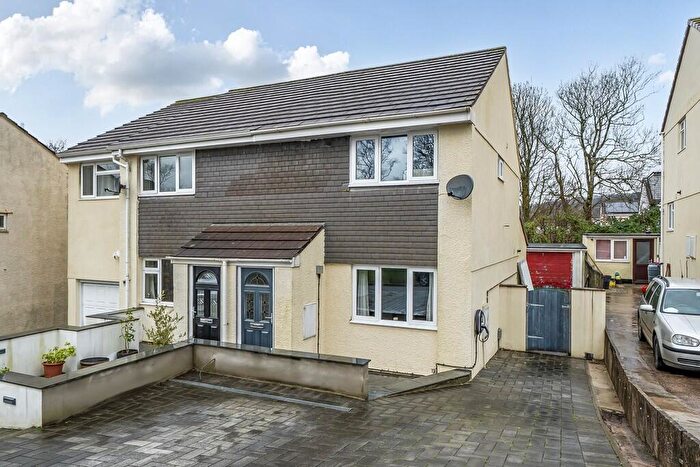
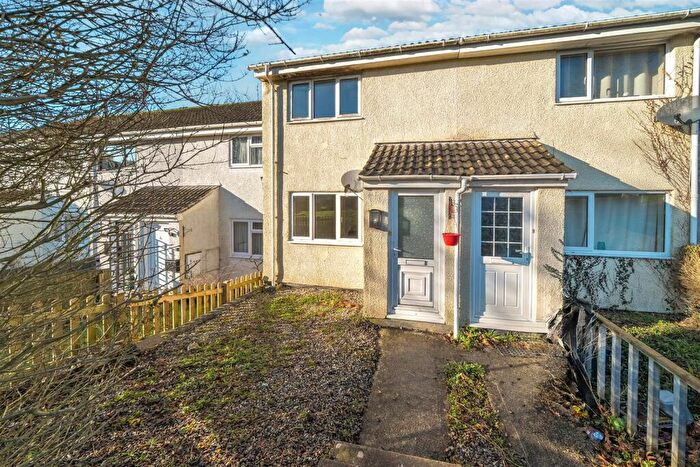
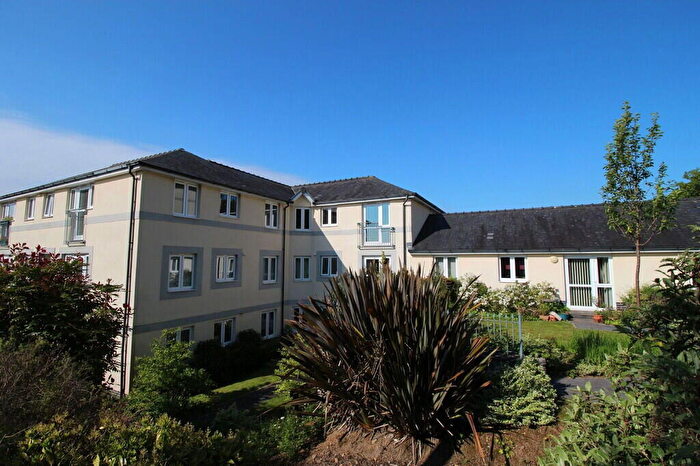
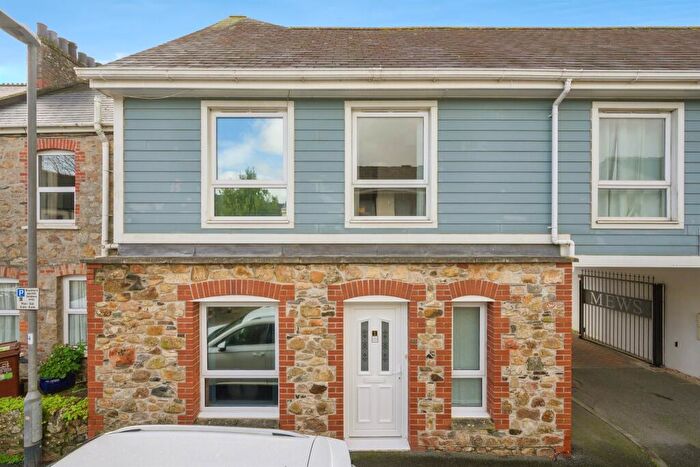
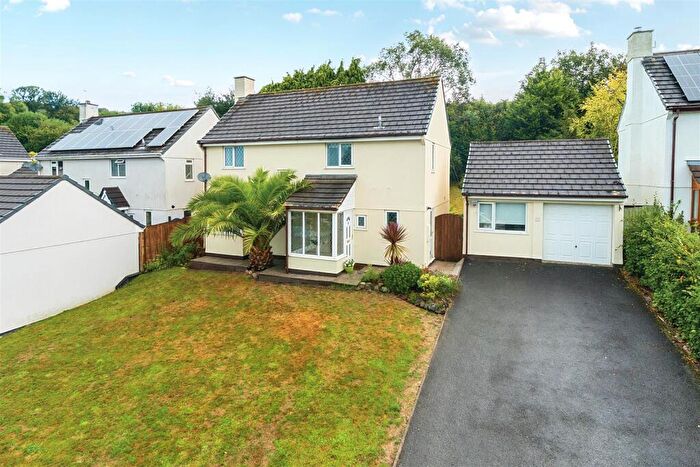
Houses for sale & to rent in Ivybridge Filham, Ivybridge
House Prices in Ivybridge Filham
Properties in Ivybridge Filham have an average house price of £304,711.00 and had 212 Property Transactions within the last 3 years¹.
Ivybridge Filham is an area in Ivybridge, Devon with 1,871 households², where the most expensive property was sold for £892,500.00.
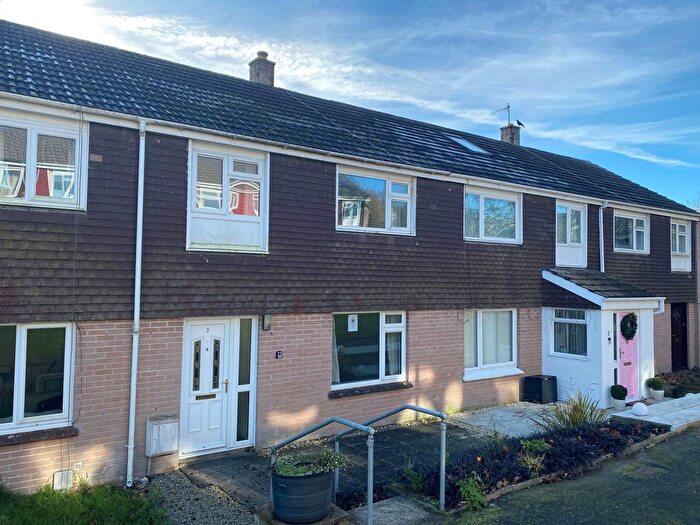
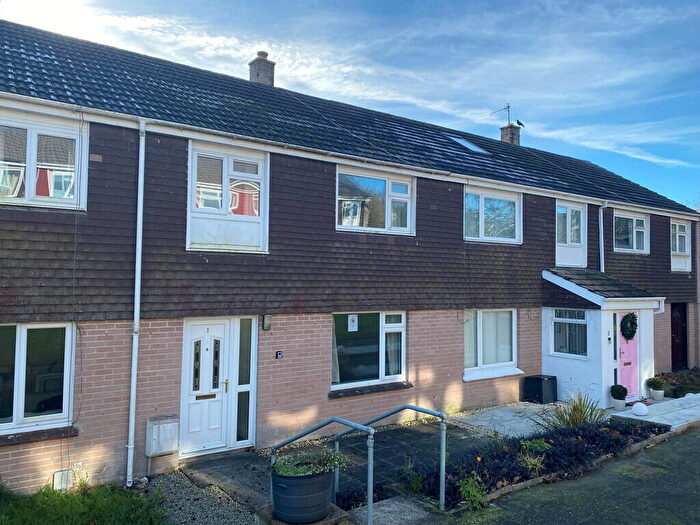
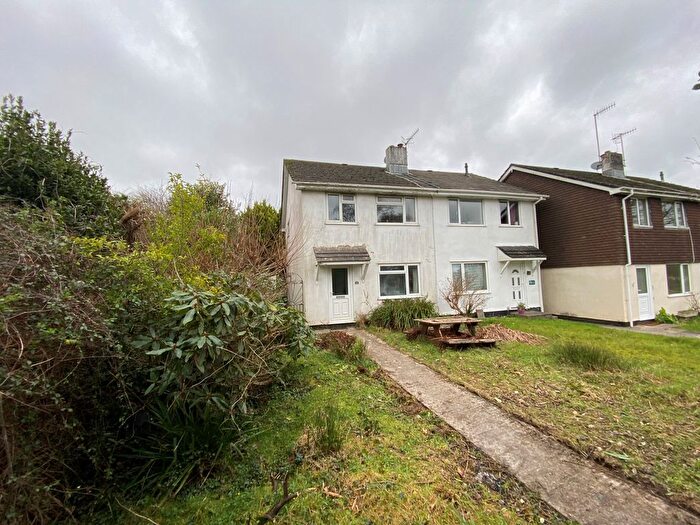
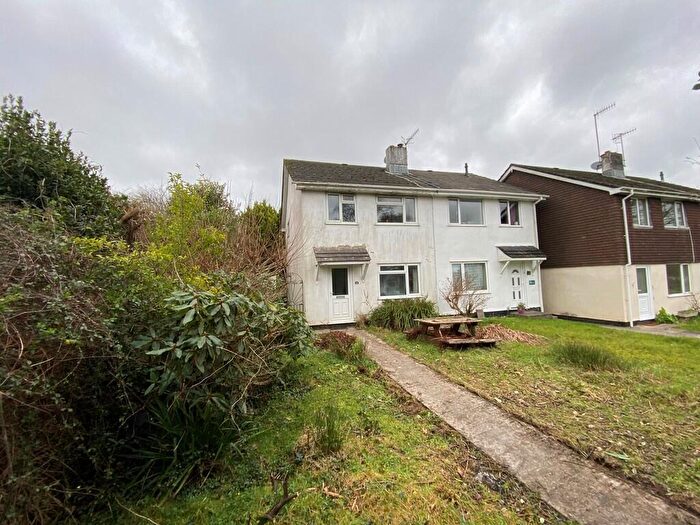
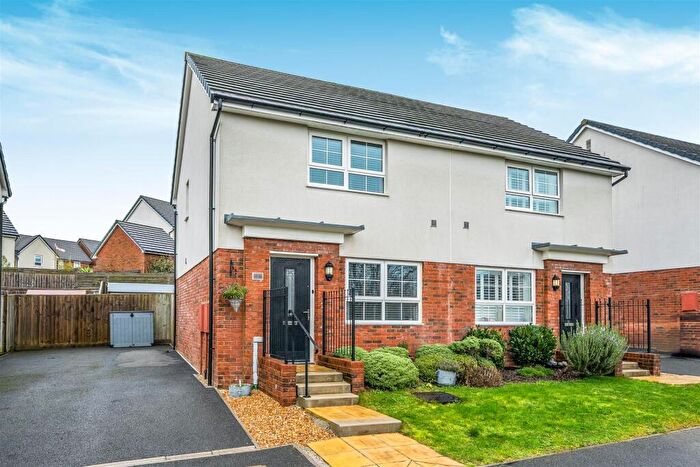
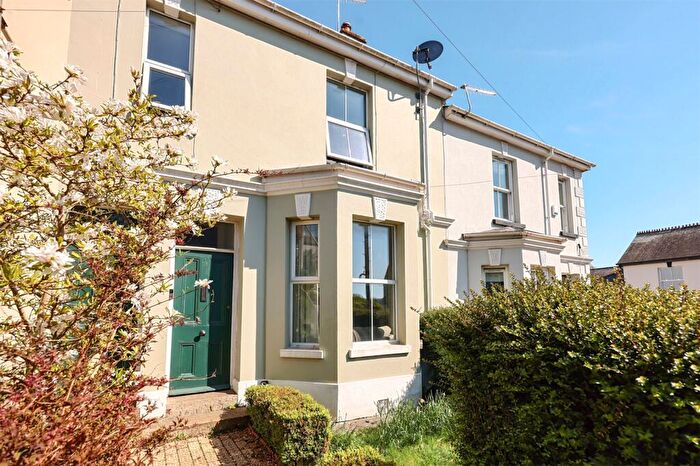
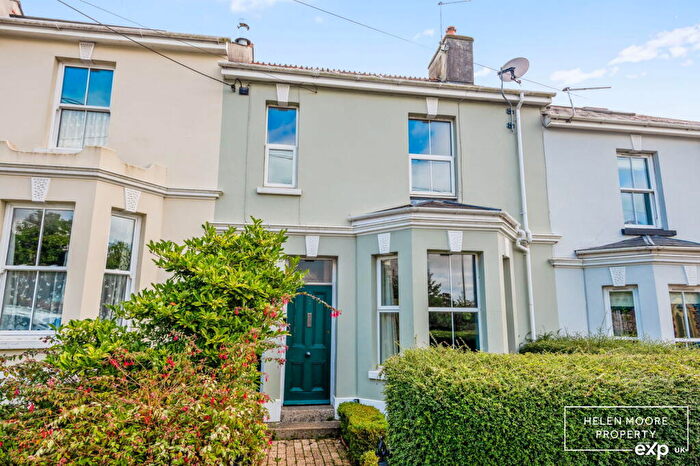
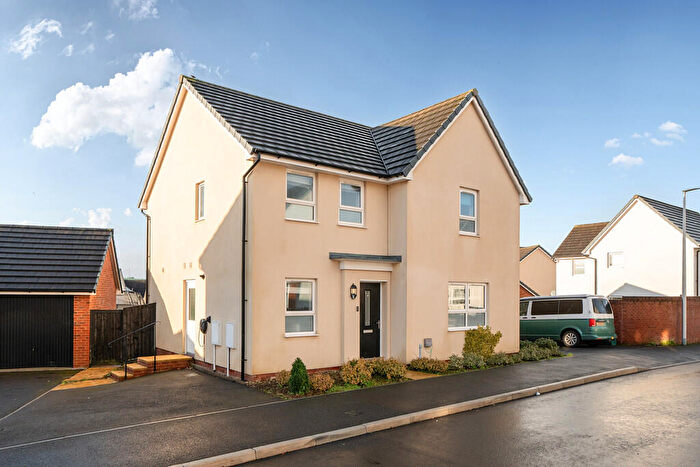
Properties for sale in Ivybridge Filham
Previously listed properties in Ivybridge Filham
Roads and Postcodes in Ivybridge Filham
Navigate through our locations to find the location of your next house in Ivybridge Filham, Ivybridge for sale or to rent.
| Streets | Postcodes |
|---|---|
| Allans Road | PL21 0PW |
| Ash Grove | PL21 0HX |
| Barons Pyke | PL21 0BZ |
| Bedford Grove | PL21 0FJ |
| Berkeley Way | PL21 0YD |
| Bishops Close | PL21 0JY |
| Blackett Close | PL21 0WA |
| Blackthorn Drive | PL21 0WB |
| Bridge Cottages | PL21 0BJ |
| Bridge Park | PL21 0AT |
| Brook Road | PL21 0AX |
| Brunel Way | PL21 0AF |
| Buckfast Close | PL21 0YA |
| Buddle Close | PL21 0JU |
| Butterdon Walk | PL21 0HS |
| Canterbury Close | PL21 0YG |
| Carter Road | PL21 0RX |
| Charles Hankin Close | PL21 0WF |
| Charlton Terrace | PL21 0AU |
| Cole Lane | PL21 0DF PL21 0DG PL21 0PN |
| Corfe Close | PL21 0YB |
| Dairy Lane | PL21 0UW |
| Deer Park | PL21 0HY |
| Dunsterville Road | PL21 0JT |
| Elizabeth Close | PL21 0PL |
| Exeter Road | PL21 0BB PL21 0BD PL21 0BG PL21 0BQ |
| Firtree Rise | PL21 0AY |
| Godwell Lane | PL21 0LT |
| Gorse Way | PL21 0GA PL21 0YQ |
| Harford Road | PL21 0AR PL21 0AS |
| Heather Walk | PL21 0YJ |
| Jubilee Close | PL21 0PJ |
| Langlands Meadow | PL21 0FH |
| Lydford Close | PL21 0YW |
| Macandrew Walk | PL21 0EY |
| Marshals Field | PL21 0FQ |
| Mill Meadow | PL21 0AN PL21 0AW |
| Montgomery Close | PL21 0FG |
| Oak Gardens | PL21 0NB |
| Paper Makers Lane | PL21 0JZ |
| Parkside | PL21 0HU |
| Prideaux Road | PL21 0JS |
| Primrose Close | PL21 0UN |
| Pykes Down | PL21 0BY |
| Rivers Close | PL21 0JN |
| Rue St Pierre | PL21 0HZ |
| Savery Close | PL21 0JR |
| Sedge Close | PL21 0WD |
| Speakers Road | PL21 0JP |
| Springwood Close | PL21 0ND |
| Stannary Close | PL21 0JX |
| Tollbar Close | PL21 0JW |
| Tom Maddock Gardens | PL21 0WE |
| Torre Close | PL21 0BX |
| Trehill Road | PL21 0AZ |
| Trematon Drive | PL21 0HT |
| Trinnaman Close | PL21 0YH |
| Uphill Close | PL21 0NA |
| Waltham Way | PL21 0YF |
| Waterslade Drive | PL21 0FD |
| Weatherdon Drive | PL21 0DD |
| Wellstones Close | PL21 0FE |
| Windsor Close | PL21 0YE |
| Wood Park | PL21 0PP |
| Woodfield Crescent | PL21 0FB |
| Yeolland Lane | PL21 0YL |
| Yeolland Park | PL21 0YP |
Transport near Ivybridge Filham
-
Ivybridge Station
-
Plymouth Station
-
Totnes Station
-
Devonport Station
-
Dockyard Station
-
Keyham Station
-
St.Budeaux Ferry Road Station
-
St.Budeaux Victoria Road Station
-
Bere Ferrers Station
-
Saltash Station
- FAQ
- Price Paid By Year
- Property Type Price
Frequently asked questions about Ivybridge Filham
What is the average price for a property for sale in Ivybridge Filham?
The average price for a property for sale in Ivybridge Filham is £304,711. This amount is 9% lower than the average price in Ivybridge. There are 760 property listings for sale in Ivybridge Filham.
What streets have the most expensive properties for sale in Ivybridge Filham?
The streets with the most expensive properties for sale in Ivybridge Filham are Charles Hankin Close at an average of £765,000, Cole Lane at an average of £466,000 and Springwood Close at an average of £455,000.
What streets have the most affordable properties for sale in Ivybridge Filham?
The streets with the most affordable properties for sale in Ivybridge Filham are Bridge Cottages at an average of £145,000, Yeolland Park at an average of £161,611 and Heather Walk at an average of £209,750.
Which train stations are available in or near Ivybridge Filham?
Some of the train stations available in or near Ivybridge Filham are Ivybridge, Plymouth and Totnes.
Property Price Paid in Ivybridge Filham by Year
The average sold property price by year was:
| Year | Average Sold Price | Price Change |
Sold Properties
|
|---|---|---|---|
| 2025 | £303,703 | 3% |
70 Properties |
| 2024 | £293,464 | -8% |
75 Properties |
| 2023 | £318,353 | 8% |
67 Properties |
| 2022 | £292,057 | 3% |
61 Properties |
| 2021 | £281,913 | 2% |
79 Properties |
| 2020 | £274,993 | 16% |
72 Properties |
| 2019 | £230,483 | -7% |
73 Properties |
| 2018 | £246,340 | 4% |
79 Properties |
| 2017 | £237,630 | 4% |
84 Properties |
| 2016 | £227,605 | 3% |
76 Properties |
| 2015 | £220,555 | 5% |
72 Properties |
| 2014 | £209,618 | 2% |
102 Properties |
| 2013 | £205,437 | 7% |
83 Properties |
| 2012 | £190,965 | 2% |
75 Properties |
| 2011 | £187,147 | -11% |
70 Properties |
| 2010 | £207,834 | 7% |
57 Properties |
| 2009 | £193,483 | -3% |
83 Properties |
| 2008 | £199,429 | -3% |
53 Properties |
| 2007 | £205,144 | 6% |
135 Properties |
| 2006 | £193,023 | 6% |
126 Properties |
| 2005 | £181,152 | 8% |
116 Properties |
| 2004 | £167,014 | 8% |
123 Properties |
| 2003 | £153,690 | 16% |
152 Properties |
| 2002 | £129,122 | 8% |
159 Properties |
| 2001 | £119,096 | 28% |
147 Properties |
| 2000 | £85,445 | 10% |
175 Properties |
| 1999 | £76,729 | -0,3% |
218 Properties |
| 1998 | £76,982 | 13% |
205 Properties |
| 1997 | £66,627 | 11% |
222 Properties |
| 1996 | £59,209 | -8% |
137 Properties |
| 1995 | £64,131 | - |
130 Properties |
Property Price per Property Type in Ivybridge Filham
Here you can find historic sold price data in order to help with your property search.
The average Property Paid Price for specific property types in the last three years are:
| Property Type | Average Sold Price | Sold Properties |
|---|---|---|
| Semi Detached House | £280,794.00 | 75 Semi Detached Houses |
| Detached House | £402,450.00 | 66 Detached Houses |
| Terraced House | £242,181.00 | 69 Terraced Houses |
| Flat | £133,500.00 | 2 Flats |

