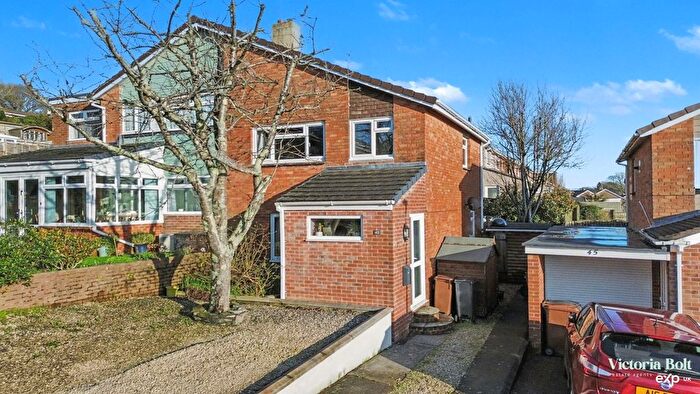
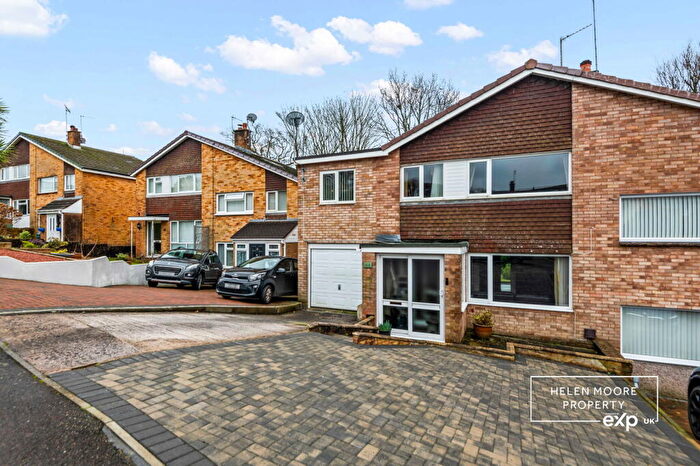
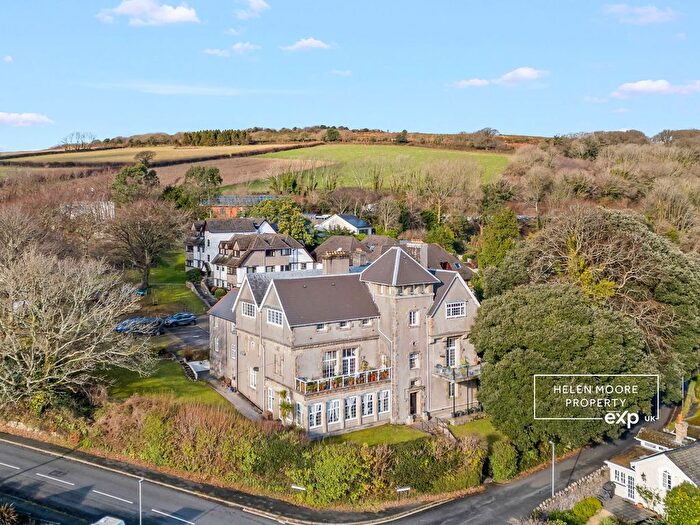
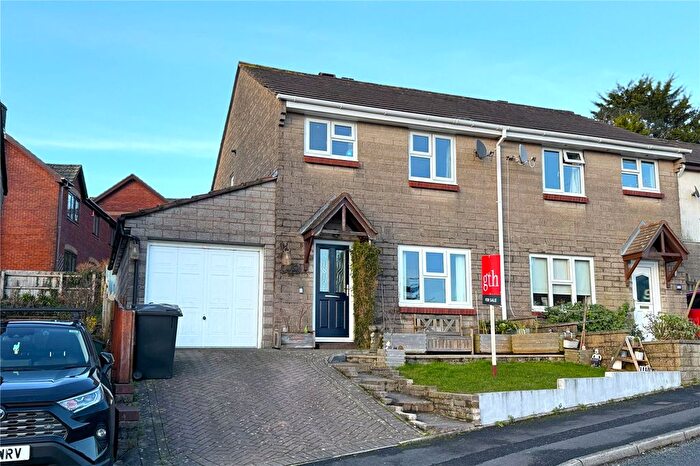
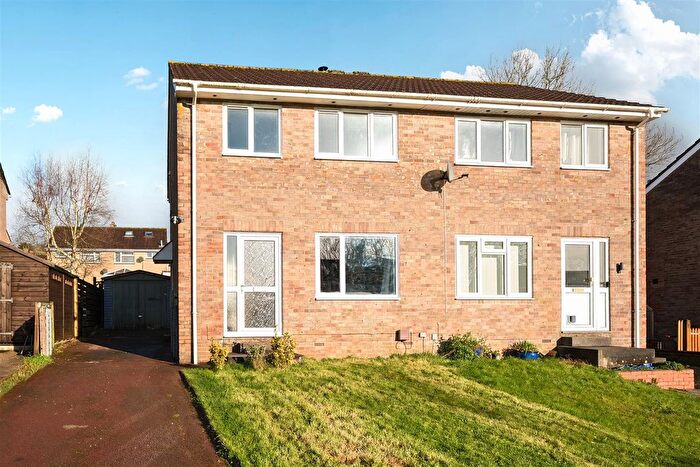
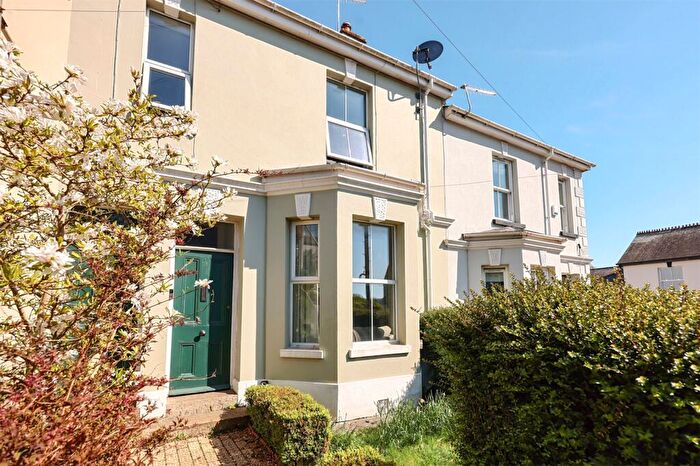
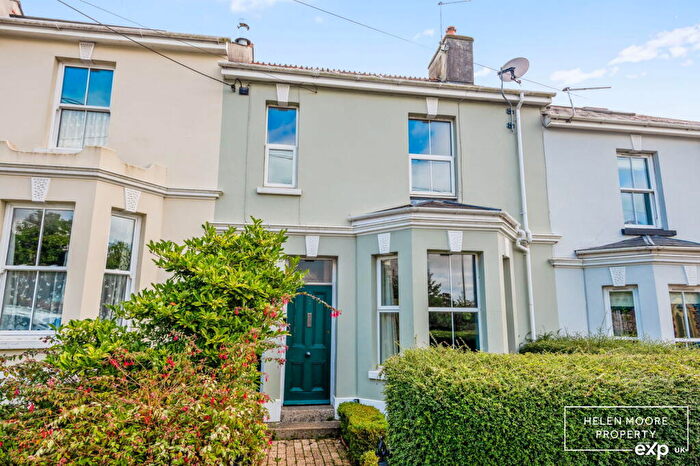
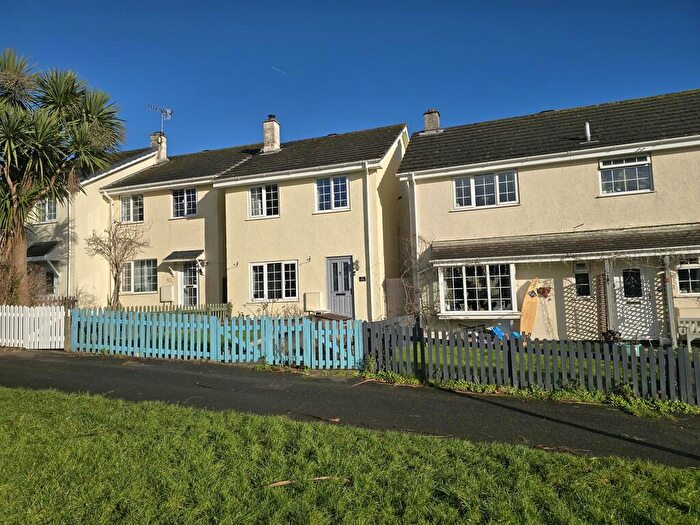
Houses for sale & to rent in Ivybridge Central, Ivybridge
House Prices in Ivybridge Central
Properties in Ivybridge Central have an average house price of £273,954.00 and had 128 Property Transactions within the last 3 years¹.
Ivybridge Central is an area in Ivybridge, Devon with 1,009 households², where the most expensive property was sold for £755,000.00.
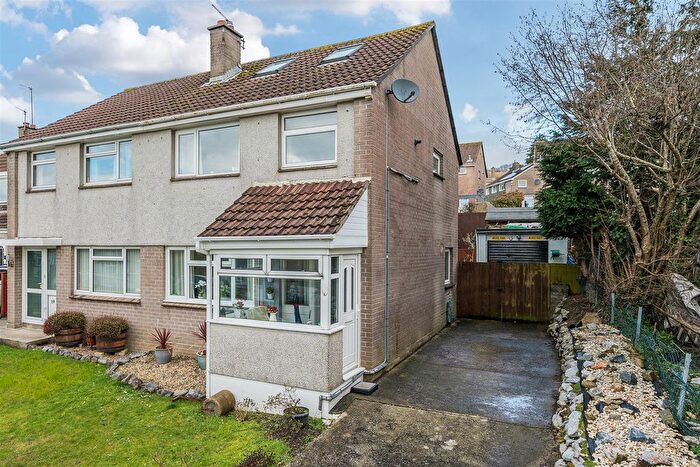
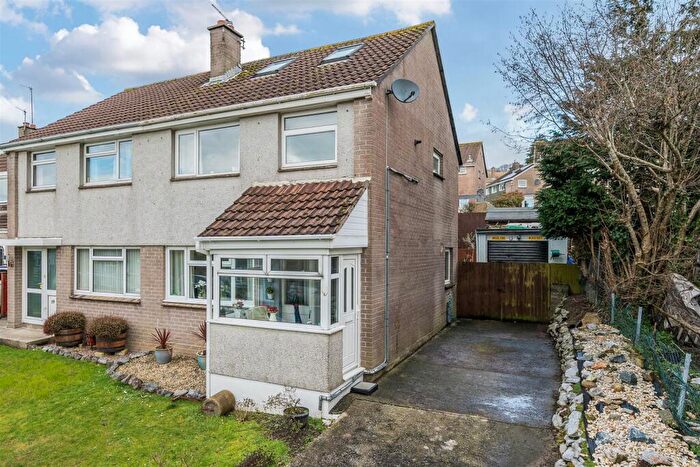
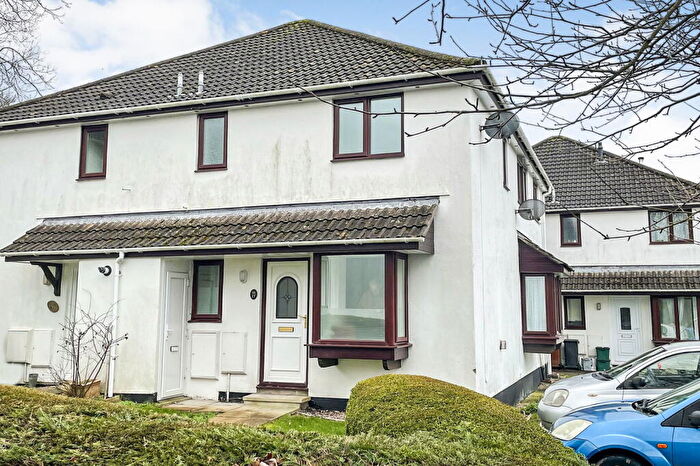
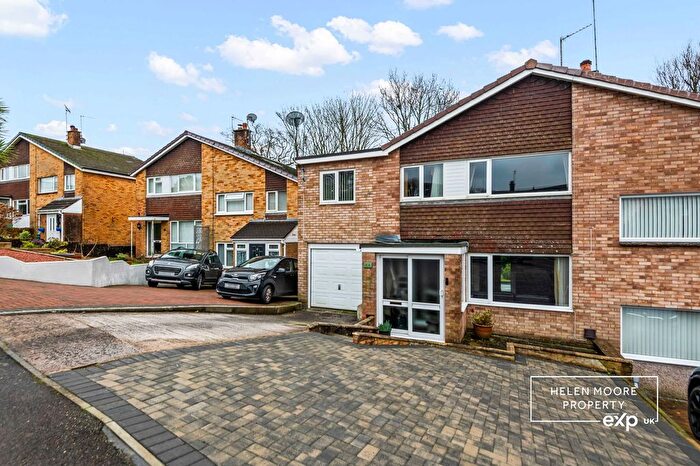
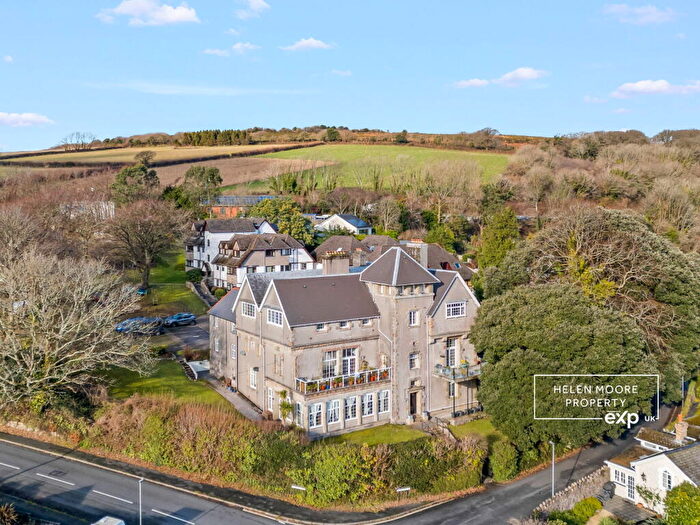
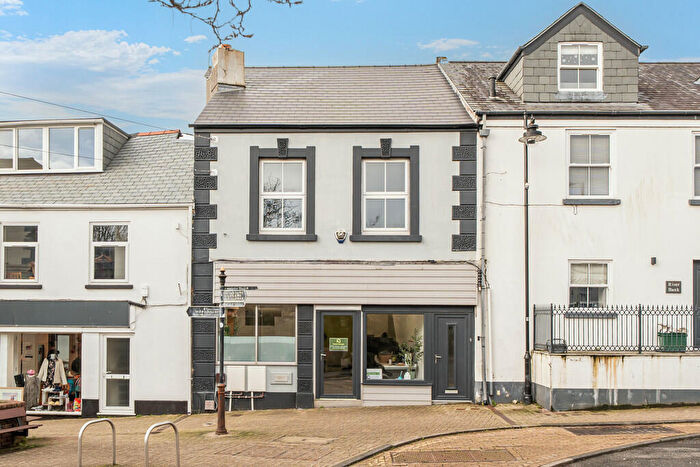
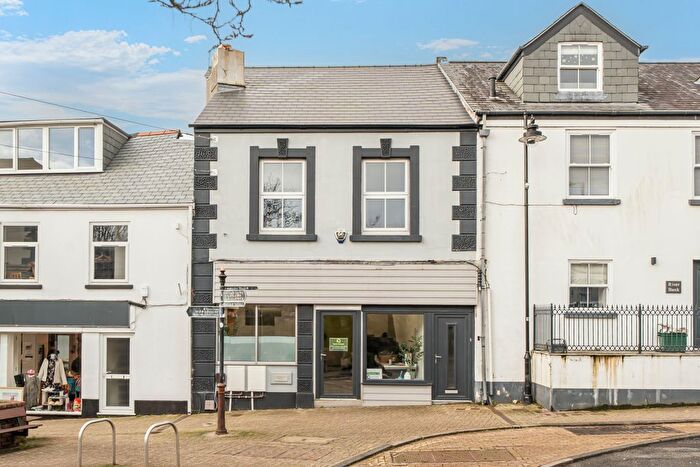
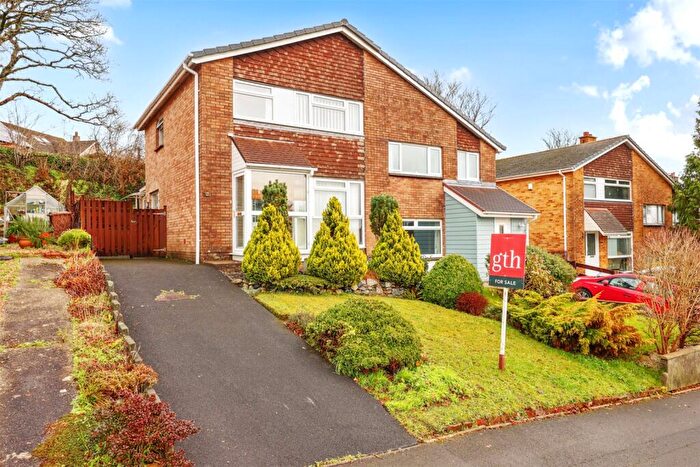
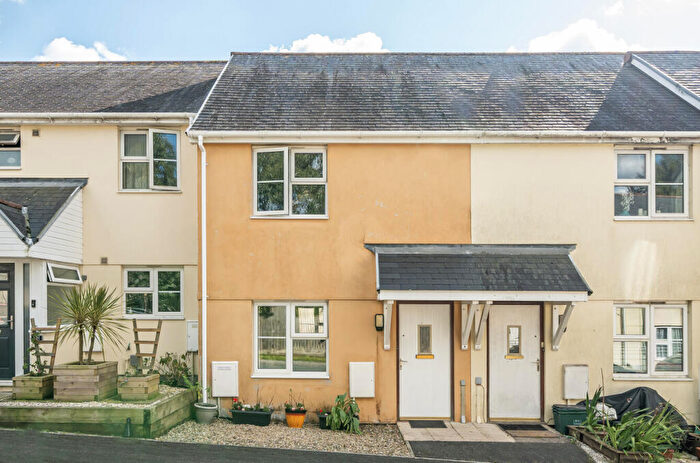
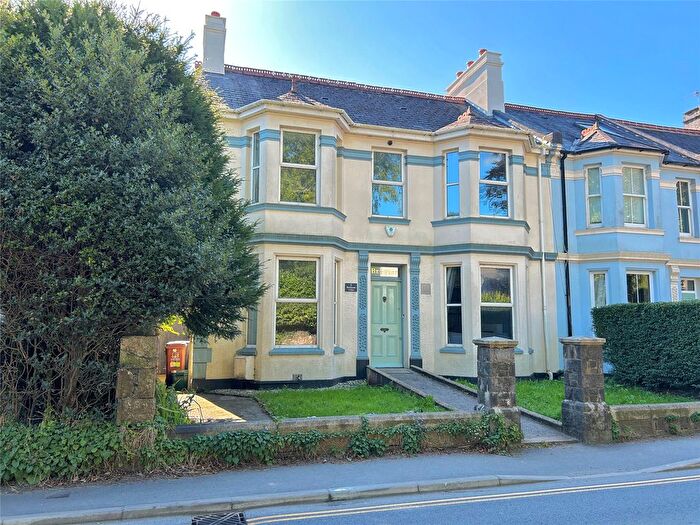
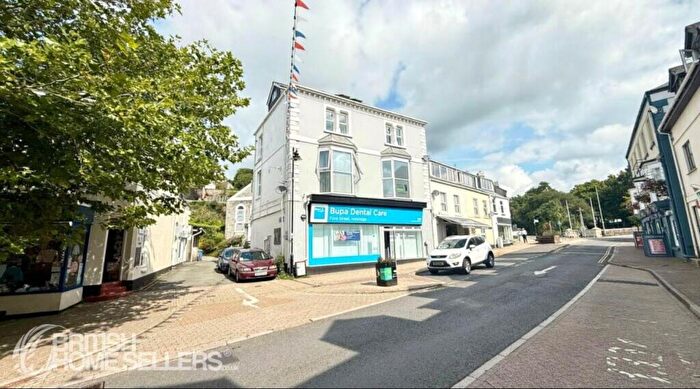
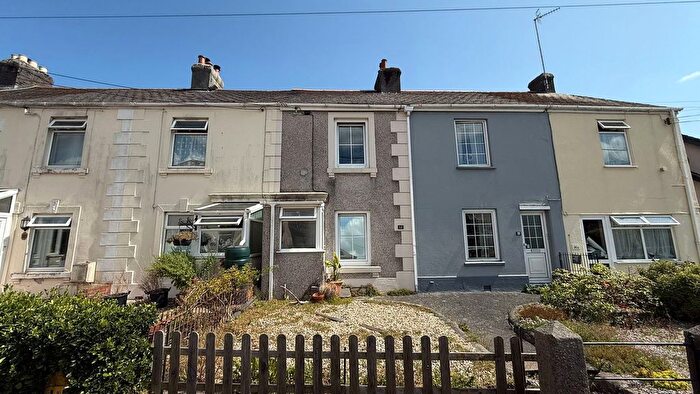
Properties for sale in Ivybridge Central
Previously listed properties in Ivybridge Central
Roads and Postcodes in Ivybridge Central
Navigate through our locations to find the location of your next house in Ivybridge Central, Ivybridge for sale or to rent.
| Streets | Postcodes |
|---|---|
| Beacon Close | PL21 0BT |
| Beacon Road | PL21 0AQ |
| Belmont Road | PL21 9DS PL21 9DT |
| Belmont Villas | PL21 9AR |
| Blachford Road | PL21 0AD PL21 0AE |
| Bowdens Park | PL21 9PR |
| Clare Street | PL21 9DL PL21 9DN |
| Costly Street | PL21 0DB PL21 0FL |
| Crescent Gardens | PL21 0BS |
| Crescent Road | PL21 0BP |
| Erme Drive | PL21 9BN |
| Erme Mews | PL21 9DP |
| Erme Road | PL21 0AB |
| Erme Terrace | PL21 0AL |
| Exeter Road | PL21 0FN |
| Fore Street | PL21 9AB PL21 9AE |
| Glanvilles Mill | PL21 9PS |
| Greenfield Drive | PL21 0UG |
| Harris Cottages | PL21 9AH |
| Hartley Court | PL21 9PQ |
| Haytor Drive | PL21 0TN |
| Heather Mews | PL21 9FF |
| Highland Street | PL21 9AG |
| Highland Villas | PL21 9AL |
| Ivydene Road | PL21 9BL |
| Keaton Road | PL21 9DH PL21 9DJ |
| Kimberley Villas | PL21 9AS |
| Leland Grove | PL21 0UH |
| Manor Close | PL21 9BQ |
| Manor Drive | PL21 9BD PL21 9BE |
| Manor Way | PL21 9BG |
| Marshall Drive | PL21 0UQ |
| Maton Close | PL21 0UD |
| Nirvana Close | PL21 0AP |
| Okehampton Way | PL21 0YN |
| Orchard Park | PL21 9PA |
| Paddock Drive | PL21 0UB |
| Park Close | PL21 0BU |
| Park Street | PL21 9DW |
| Park Street Mews | PL21 9EH |
| Park Terrace | PL21 9DR |
| Rock Villas | PL21 9AP |
| St Johns Road | PL21 9AX PL21 9AY |
| Staniforth Drive | PL21 0UJ |
| Station Cottages | PL21 0AG |
| Station Road | PL21 0AH |
| Stonehedge Close | PL21 0UF |
| Stowford Business Park | PL21 0BE |
| The Chase | PL21 0UL |
| The Groves | PL21 0SY |
| Waterside Row | PL21 9DF |
| Wayside | PL21 9AU |
| Western Road | PL21 9AN PL21 9AT PL21 9AW PL21 9GH |
| Widdicombe Drive | PL21 0TR |
| Woodland Close | PL21 9BB |
| Woodside Close | PL21 0UE |
| Woolcombe Lane | PL21 0UA |
| Zion Place | PL21 9AJ |
Transport near Ivybridge Central
-
Ivybridge Station
-
Plymouth Station
-
Totnes Station
-
Devonport Station
-
Dockyard Station
-
Keyham Station
-
St.Budeaux Ferry Road Station
-
St.Budeaux Victoria Road Station
-
Bere Ferrers Station
-
Saltash Station
- FAQ
- Price Paid By Year
- Property Type Price
Frequently asked questions about Ivybridge Central
What is the average price for a property for sale in Ivybridge Central?
The average price for a property for sale in Ivybridge Central is £273,954. This amount is 18% lower than the average price in Ivybridge. There are 736 property listings for sale in Ivybridge Central.
What streets have the most expensive properties for sale in Ivybridge Central?
The streets with the most expensive properties for sale in Ivybridge Central are Nirvana Close at an average of £602,500, Highland Villas at an average of £535,000 and Clare Street at an average of £500,000.
What streets have the most affordable properties for sale in Ivybridge Central?
The streets with the most affordable properties for sale in Ivybridge Central are Heather Mews at an average of £133,000, Erme Mews at an average of £172,500 and Staniforth Drive at an average of £180,000.
Which train stations are available in or near Ivybridge Central?
Some of the train stations available in or near Ivybridge Central are Ivybridge, Plymouth and Totnes.
Property Price Paid in Ivybridge Central by Year
The average sold property price by year was:
| Year | Average Sold Price | Price Change |
Sold Properties
|
|---|---|---|---|
| 2025 | £291,306 | 8% |
35 Properties |
| 2024 | £267,043 | -0,3% |
44 Properties |
| 2023 | £267,766 | 4% |
49 Properties |
| 2022 | £256,541 | -2% |
51 Properties |
| 2021 | £260,473 | 21% |
45 Properties |
| 2020 | £206,822 | -17% |
37 Properties |
| 2019 | £242,818 | 14% |
43 Properties |
| 2018 | £209,028 | -6% |
39 Properties |
| 2017 | £222,338 | 6% |
60 Properties |
| 2016 | £209,007 | 5% |
49 Properties |
| 2015 | £199,332 | -0,2% |
49 Properties |
| 2014 | £199,722 | 16% |
48 Properties |
| 2013 | £167,439 | -1% |
52 Properties |
| 2012 | £168,970 | 2% |
36 Properties |
| 2011 | £165,907 | 14% |
35 Properties |
| 2010 | £142,649 | -16% |
32 Properties |
| 2009 | £165,810 | -17% |
41 Properties |
| 2008 | £194,214 | 8% |
30 Properties |
| 2007 | £178,231 | 0,1% |
79 Properties |
| 2006 | £178,077 | 4% |
77 Properties |
| 2005 | £171,283 | -12% |
62 Properties |
| 2004 | £191,009 | 28% |
52 Properties |
| 2003 | £137,863 | 18% |
41 Properties |
| 2002 | £112,378 | 12% |
68 Properties |
| 2001 | £98,779 | 19% |
57 Properties |
| 2000 | £80,240 | 11% |
57 Properties |
| 1999 | £71,474 | 18% |
77 Properties |
| 1998 | £58,844 | 2% |
75 Properties |
| 1997 | £57,504 | -2% |
64 Properties |
| 1996 | £58,835 | 4% |
62 Properties |
| 1995 | £56,448 | - |
62 Properties |
Property Price per Property Type in Ivybridge Central
Here you can find historic sold price data in order to help with your property search.
The average Property Paid Price for specific property types in the last three years are:
| Property Type | Average Sold Price | Sold Properties |
|---|---|---|
| Semi Detached House | £320,053.00 | 16 Semi Detached Houses |
| Detached House | £410,170.00 | 33 Detached Houses |
| Terraced House | £235,825.00 | 50 Terraced Houses |
| Flat | £159,256.00 | 29 Flats |

