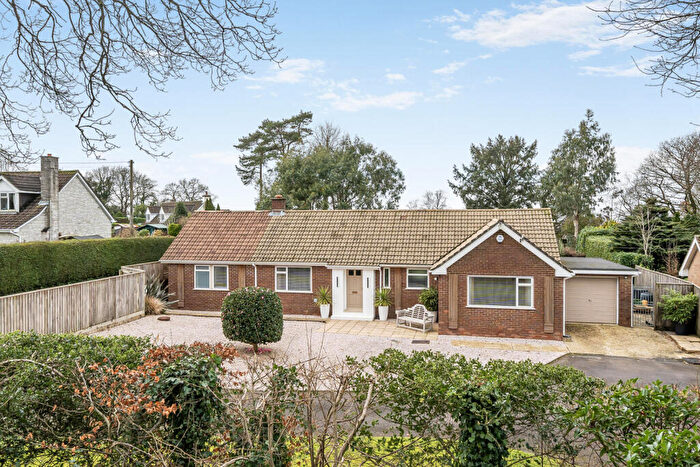
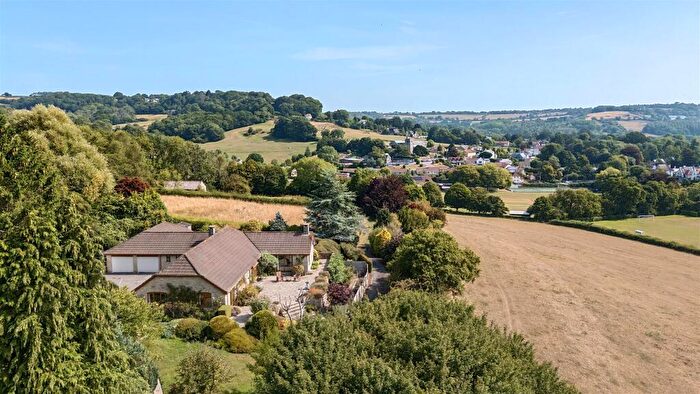
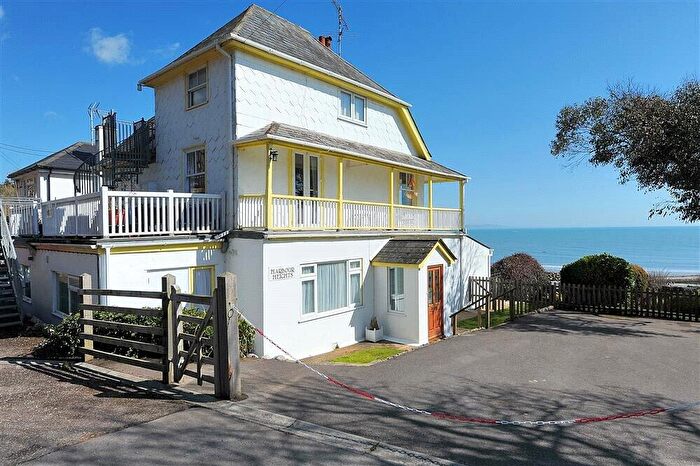
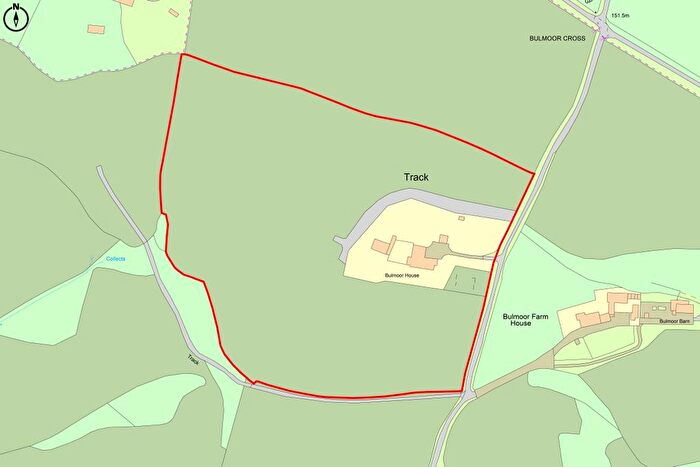
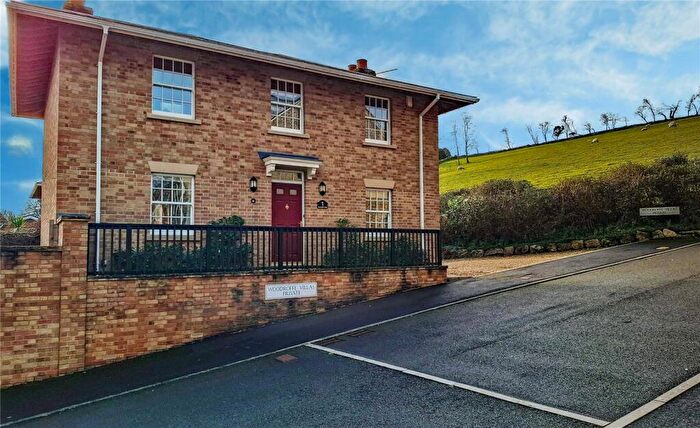
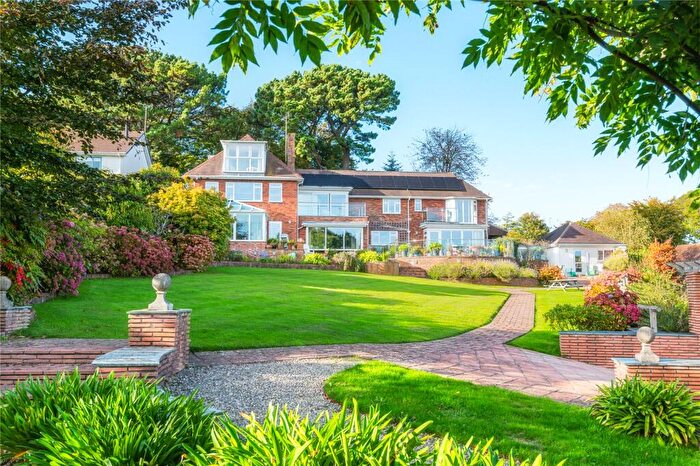
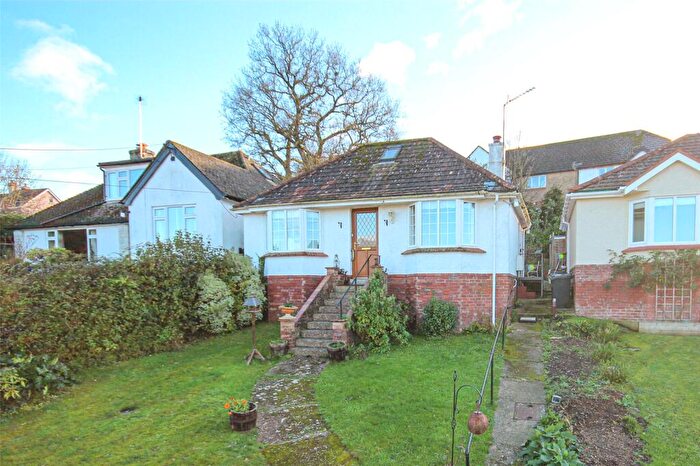
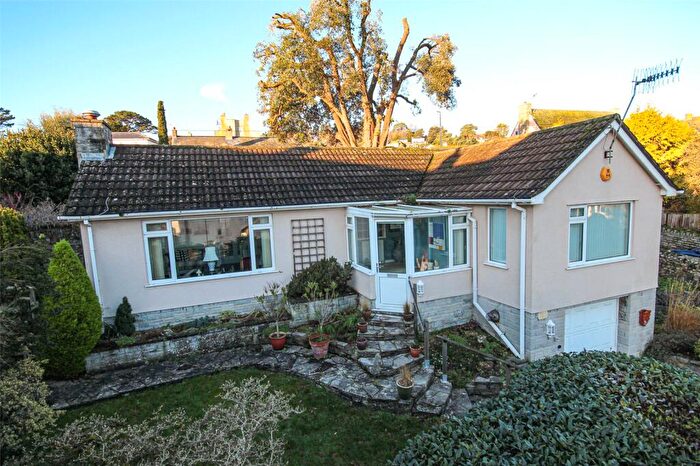
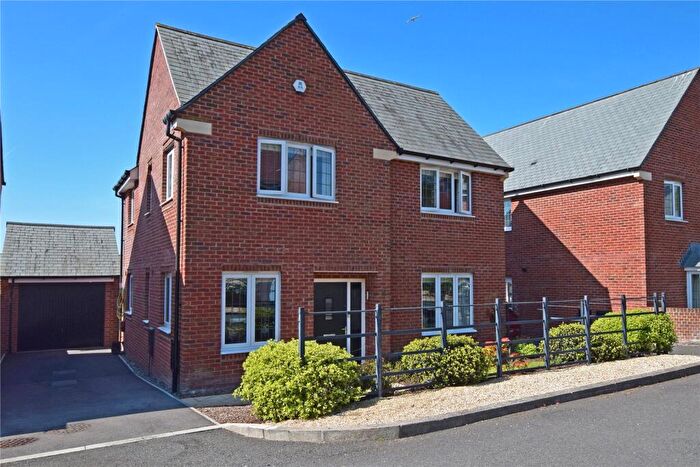
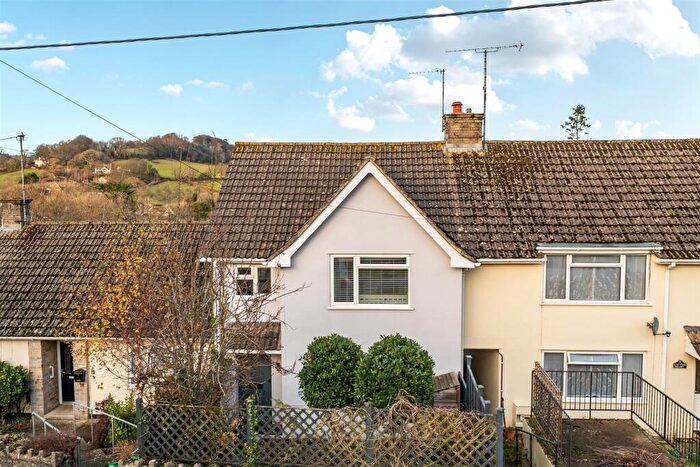
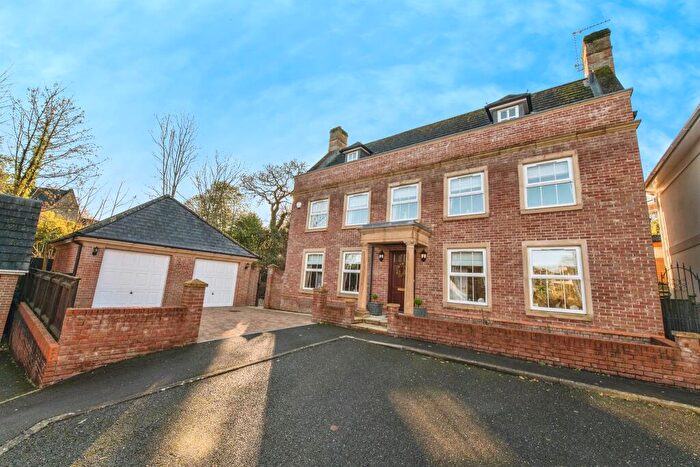
Houses for sale & to rent in Trinity, Lyme Regis
House Prices in Trinity
Properties in Trinity have an average house price of £587,543.00 and had 74 Property Transactions within the last 3 years¹.
Trinity is an area in Lyme Regis, Devon with 770 households², where the most expensive property was sold for £2,018,765.00.
Properties for sale in Trinity
Roads and Postcodes in Trinity
Navigate through our locations to find the location of your next house in Trinity, Lyme Regis for sale or to rent.
| Streets | Postcodes |
|---|---|
| Barnes Meadow | DT7 3TD |
| Cannington Lane | DT7 3SW |
| Cathole Lane | DT7 3SJ DT7 3XD DT7 3XE |
| Church Street | DT7 3TS |
| Cooksmead | DT7 3XJ |
| Crogg Lane | DT7 3TN |
| Cuckoo Hill Cottages | DT7 3SS |
| Cuckoo Lane | DT7 3SR DT7 3ST |
| Ethelstons Close | DT7 3UJ |
| Glebelands | DT7 3TB |
| Gore Lane | DT7 3TE DT7 3UT DT7 3UU DT7 3RJ |
| Haye Lane | DT7 3TP |
| Holcombe Lane | DT7 3SN |
| Home Farm Cottages | DT7 3XT |
| Home Farm North | DT7 3YA |
| Home Farm South | DT7 3YB |
| Launchycroft | DT7 3NF |
| Lime Kiln Lane | DT7 3XG DT7 3XQ |
| Lyme Road | DT7 3EG DT7 3TG DT7 3TH DT7 3TL DT7 3TQ DT7 3UY DT7 3UZ DT7 3XA DT7 3XB DT7 3TF DT7 3TJ |
| Masters Close | DT7 3XN |
| Mill Lane | DT7 3TZ |
| Old Home Farm | DT7 3YL |
| Pound Lane | DT7 3TT |
| Rhode Hill | DT7 3UF |
| Rhode Hill Mews | DT7 3TY |
| Rhode Lane | DT7 3TU DT7 3TX DT7 3RL |
| Sidmouth Road | DT7 3RD |
| Spring Head Road | DT7 3UH |
| Springhead | DT7 3UG |
| Springhead Road | DT7 3RS DT7 3UQ |
| St Marys Lane | DT7 3XH |
| Stable Courtyard | DT7 3RA |
| Tappers Knapp | DT7 3TW |
| The Bothy | DT7 3YD |
| The Gables | DT7 3XZ |
| The Gardens | DT7 3XS |
| The Glen | DT7 3TR |
| Venlake | DT7 3SE |
| Venlake Close | DT7 3UX |
| Venlake End | DT7 3SF |
| Venlake Lane | DT7 3SA DT7 3SB DT7 3SD DT7 3SG |
| Venlake Meadow | DT7 3SY |
| Wadley Hill | DT7 3SU |
| Whalley Lane | DT7 3UP DT7 3UR |
| Woodhouse Fields | DT7 3SH |
| Woodhouse Hill | DT7 3SL |
| Woodhouse Lane | DT7 3SQ DT7 3SX |
| Yawl Crescent | DT7 3XL |
| Yawl Hill Lane | DT7 3RP DT7 3RW DT7 3XF |
| DT7 3RE DT7 3RF DT7 3RH DT7 3RN DT7 3RR DT7 3XP DT7 3XR DT7 3XU DT7 3XW DT7 3XX DT7 3RB DT7 3RG DT7 3RQ DT7 3SP DT7 3UA DT7 3XY |
Transport near Trinity
- FAQ
- Price Paid By Year
- Property Type Price
Frequently asked questions about Trinity
What is the average price for a property for sale in Trinity?
The average price for a property for sale in Trinity is £587,543. There are 550 property listings for sale in Trinity.
What streets have the most expensive properties for sale in Trinity?
The streets with the most expensive properties for sale in Trinity are Rhode Lane at an average of £1,269,000, Yawl Hill Lane at an average of £1,055,500 and Springhead Road at an average of £837,500.
What streets have the most affordable properties for sale in Trinity?
The streets with the most affordable properties for sale in Trinity are The Bothy at an average of £290,000, Venlake at an average of £319,000 and Gore Lane at an average of £325,000.
Which train stations are available in or near Trinity?
Some of the train stations available in or near Trinity are Axminster, Honiton and Crewkerne.
Property Price Paid in Trinity by Year
The average sold property price by year was:
| Year | Average Sold Price | Price Change |
Sold Properties
|
|---|---|---|---|
| 2025 | £527,852 | -3% |
22 Properties |
| 2024 | £545,066 | -17% |
15 Properties |
| 2023 | £640,256 | 12% |
37 Properties |
| 2022 | £561,322 | 11% |
28 Properties |
| 2021 | £500,654 | 1% |
40 Properties |
| 2020 | £497,927 | -0,3% |
36 Properties |
| 2019 | £499,302 | 8% |
35 Properties |
| 2018 | £459,339 | -6% |
28 Properties |
| 2017 | £487,992 | 25% |
38 Properties |
| 2016 | £363,601 | -9% |
34 Properties |
| 2015 | £394,530 | -2% |
40 Properties |
| 2014 | £400,985 | 10% |
44 Properties |
| 2013 | £360,718 | 3% |
38 Properties |
| 2012 | £351,403 | -24% |
26 Properties |
| 2011 | £436,605 | 14% |
38 Properties |
| 2010 | £376,894 | 10% |
38 Properties |
| 2009 | £337,574 | 5% |
33 Properties |
| 2008 | £319,370 | -21% |
31 Properties |
| 2007 | £386,358 | 7% |
64 Properties |
| 2006 | £359,959 | 13% |
53 Properties |
| 2005 | £314,311 | 1% |
48 Properties |
| 2004 | £309,623 | 9% |
50 Properties |
| 2003 | £282,539 | 24% |
49 Properties |
| 2002 | £215,176 | 24% |
69 Properties |
| 2001 | £164,548 | -3% |
30 Properties |
| 2000 | £169,777 | -10% |
29 Properties |
| 1999 | £186,857 | 21% |
51 Properties |
| 1998 | £147,118 | 24% |
30 Properties |
| 1997 | £111,671 | 23% |
28 Properties |
| 1996 | £86,415 | -1% |
30 Properties |
| 1995 | £87,431 | - |
24 Properties |
Property Price per Property Type in Trinity
Here you can find historic sold price data in order to help with your property search.
The average Property Paid Price for specific property types in the last three years are:
| Property Type | Average Sold Price | Sold Properties |
|---|---|---|
| Semi Detached House | £421,750.00 | 10 Semi Detached Houses |
| Detached House | £732,773.00 | 42 Detached Houses |
| Terraced House | £436,270.00 | 12 Terraced Houses |
| Flat | £324,900.00 | 10 Flats |

