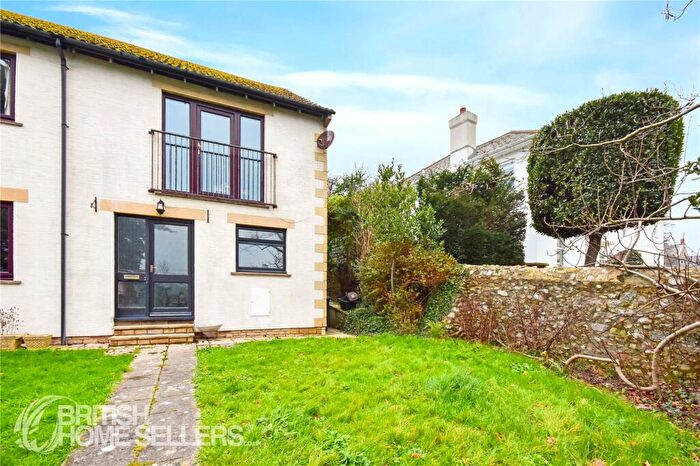
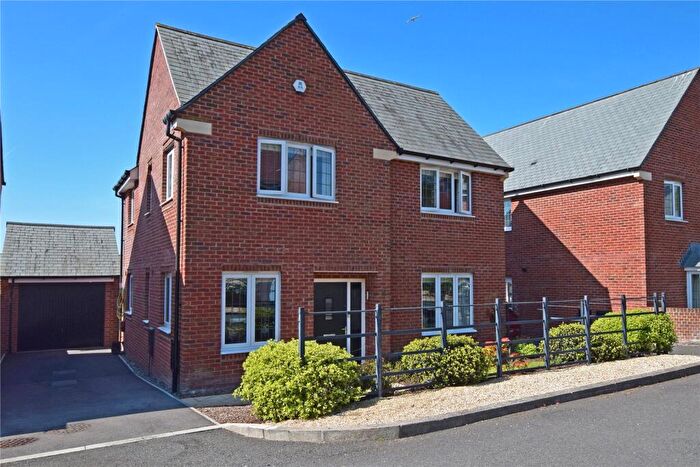
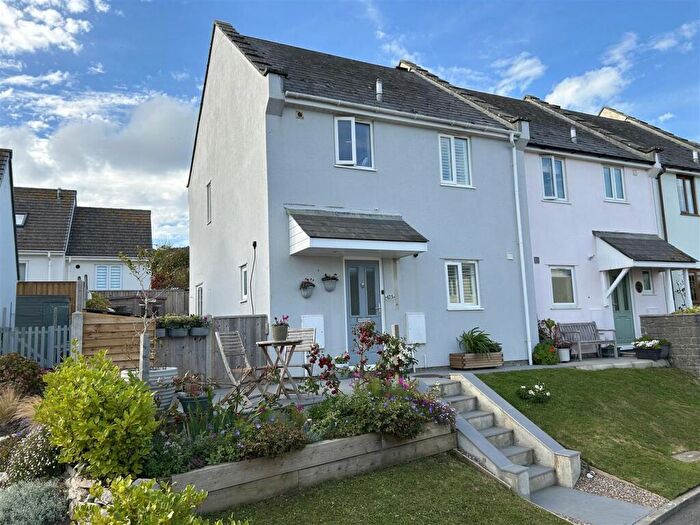
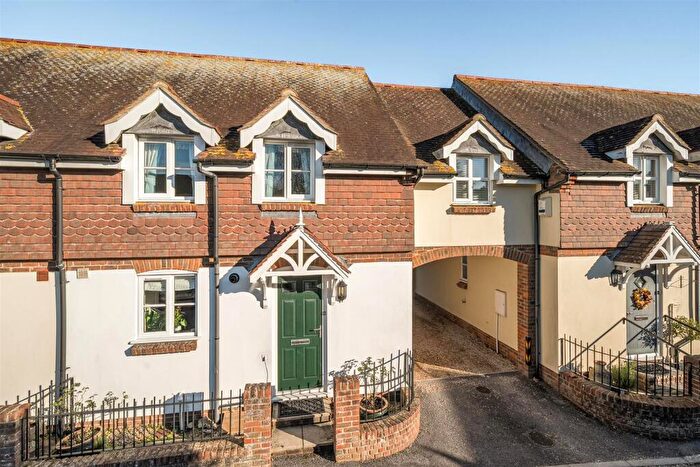
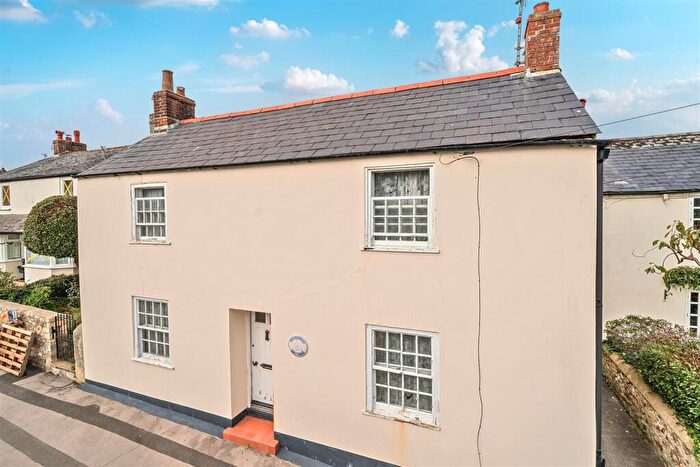
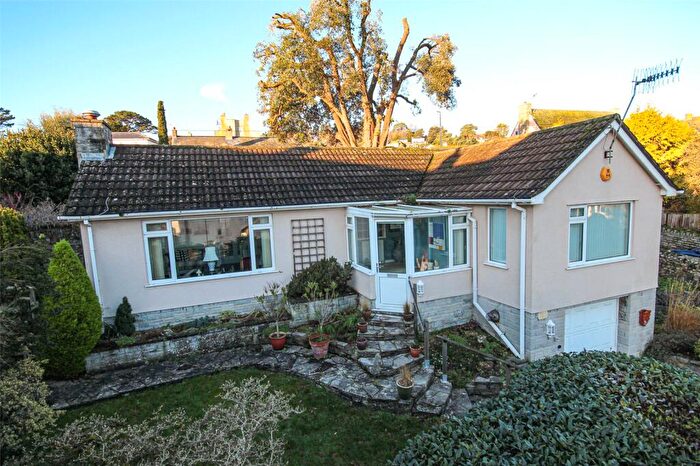
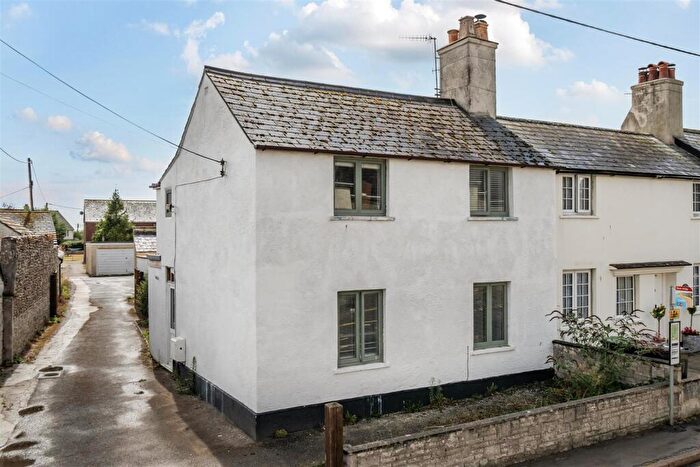
Houses for sale & to rent in Charmouth, Bridport
House Prices in Charmouth
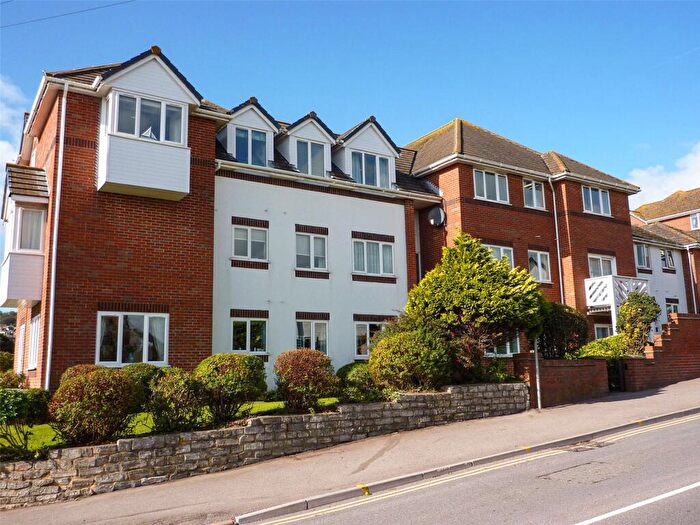
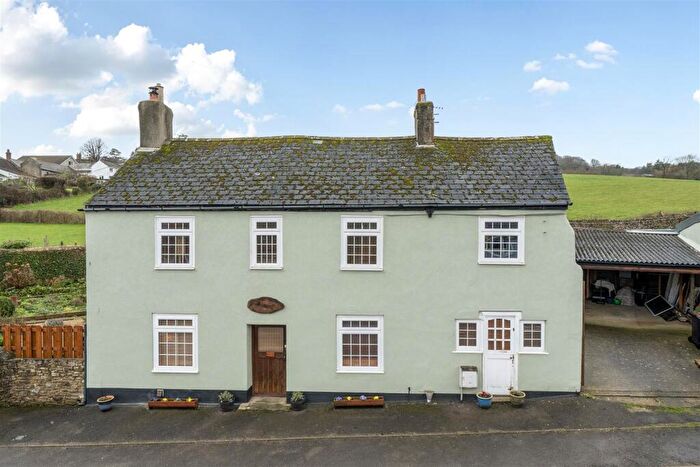
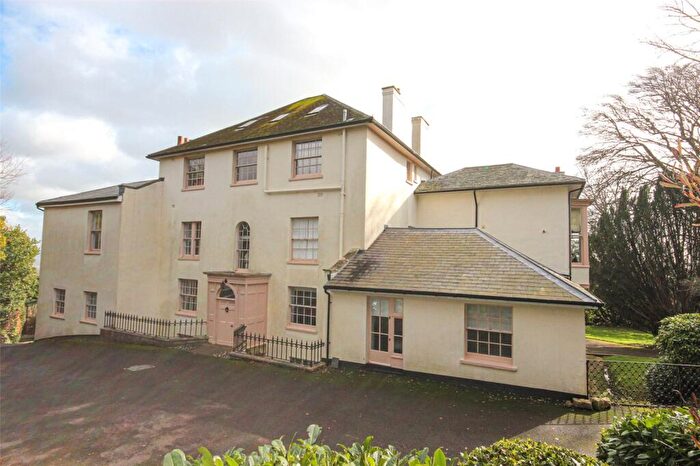
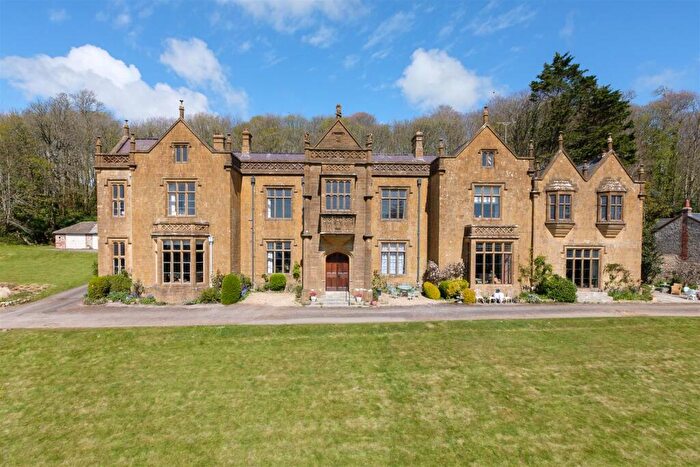
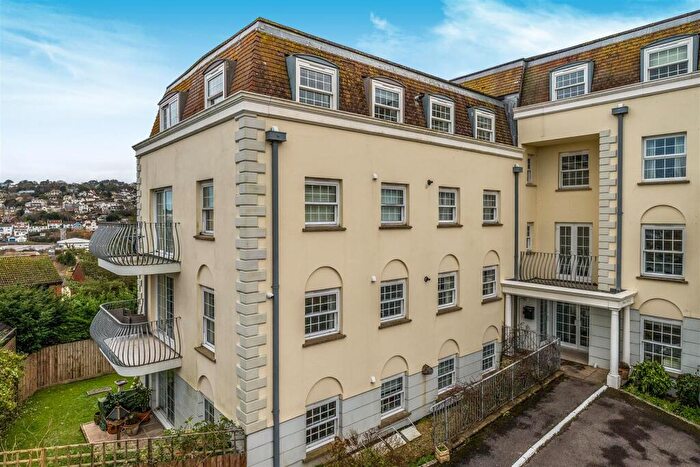
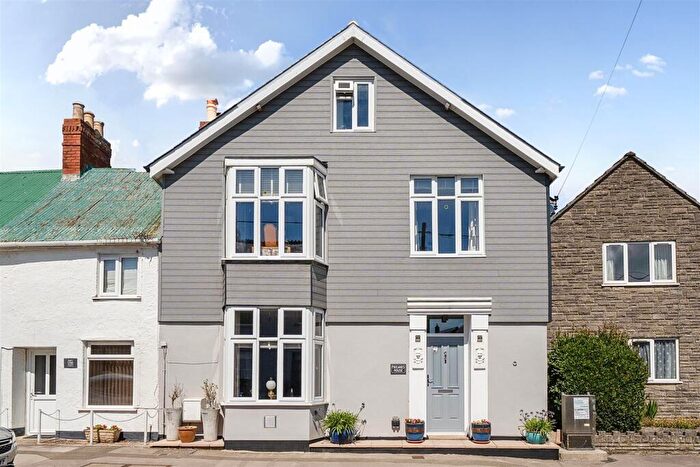
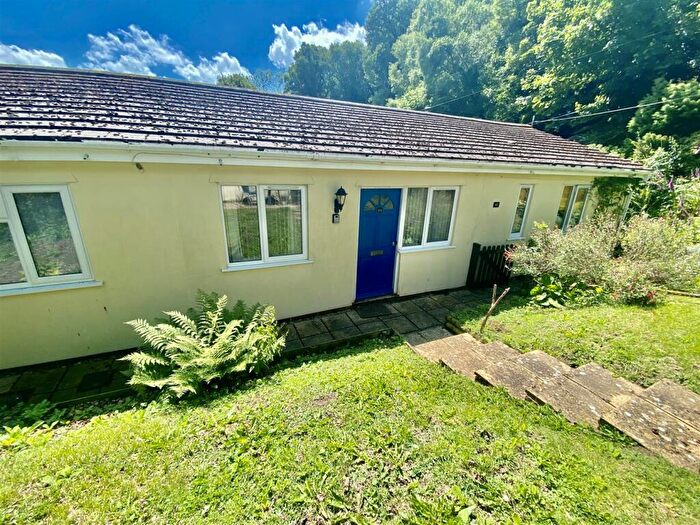
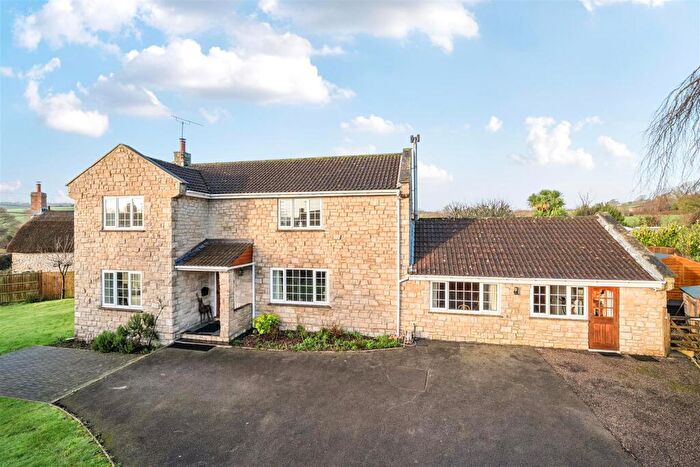
Properties in Charmouth have an average house price of £542,164.00 and had 64 Property Transactions within the last 3 years¹.
Charmouth is an area in Bridport, Dorset with 743 households², where the most expensive property was sold for £1,800,000.00.
Properties for sale in Charmouth
Roads and Postcodes in Charmouth
Navigate through our locations to find the location of your next house in Charmouth, Bridport for sale or to rent.
| Streets | Postcodes |
|---|---|
| Axminster Road | DT6 6BS DT6 6BY DT6 6NY DT6 6PA DT6 6PB |
| Barneys Close | DT6 6SE |
| Barrs Lane | DT6 6PS |
| Bridge Road | DT6 6QP DT6 6QS |
| Catherston Lane | DT6 6LX |
| Catherston Leweston | DT6 6LZ |
| Charberry Rise | DT6 6BN |
| Devonedge Lane | DT6 6QA |
| Double Common | DT6 6PT |
| Downside Close | DT6 6BH |
| Ellesdon | DT6 6QR |
| Elm Cottages | DT6 6NA |
| Elsdons Lane | DT6 6DA |
| Fernhill | DT6 6BX |
| Fernhill Heights | DT6 6AU |
| Fishpond | DT6 6NW |
| Five Acres | DT6 6BE |
| Gardenside | DT6 6BA |
| Georges Close | DT6 6RU |
| Grange Villas | DT6 6QQ |
| Greenhayes | DT6 6BJ |
| Hammonds Mead | DT6 6QX |
| Higher Sea Lane | DT6 6AX DT6 6AY DT6 6AZ DT6 6BB DT6 6BD |
| Kidmore Close | DT6 6RT |
| Littlehurst Close | DT6 6RZ |
| Longlands Cottages | DT6 6NE |
| Lower Catherston Road | DT6 6LY |
| Lower Sea Lane | DT6 6LH DT6 6LJ DT6 6LL DT6 6LR DT6 6LW |
| Meadow Way | DT6 6NS |
| Meerhayfield Cottages | DT6 6NG |
| Monkton Wyld Cottages | DT6 6DB |
| Nutcombe Close | DT6 6RX |
| Nutcombe Terrace | DT6 6NZ |
| Old Lyme Hill | DT6 6BP |
| Old Lyme Road | DT6 6BQ DT6 6BW |
| Old Rectory Close | DT6 6QD |
| Orchard Close | DT6 6RS |
| Parkway | DT6 6LP |
| Queens Walk | DT6 6AB |
| Riverside Cottages | DT6 6NQ DT6 6QZ |
| Riverway | DT6 6LS |
| School Lane | DT6 6NF |
| St Andrews Drive | DT6 6LN |
| The Street | DT6 6LT DT6 6NU DT6 6NX DT6 6PD DT6 6PE DT6 6PF DT6 6PN DT6 6PQ DT6 6PU DT6 6PZ DT6 6QE DT6 6QH DT6 6QJ |
| Wesley Close | DT6 6QT |
| West Cliff Road | DT6 6BG |
| Wootton Lane | DT6 6NH |
| DT6 6BU DT6 6BZ DT6 6DD DT6 6DF DT6 6RR |
Transport near Charmouth
- FAQ
- Price Paid By Year
- Property Type Price
Frequently asked questions about Charmouth
What is the average price for a property for sale in Charmouth?
The average price for a property for sale in Charmouth is £542,164. This amount is 29% higher than the average price in Bridport. There are 947 property listings for sale in Charmouth.
What streets have the most expensive properties for sale in Charmouth?
The streets with the most expensive properties for sale in Charmouth are Old Lyme Road at an average of £966,666, Fishpond at an average of £955,016 and Higher Sea Lane at an average of £813,928.
What streets have the most affordable properties for sale in Charmouth?
The streets with the most affordable properties for sale in Charmouth are Nutcombe Close at an average of £160,000, Fernhill Heights at an average of £195,000 and Fernhill at an average of £255,000.
Which train stations are available in or near Charmouth?
Some of the train stations available in or near Charmouth are Axminster, Crewkerne and Honiton.
Property Price Paid in Charmouth by Year
The average sold property price by year was:
| Year | Average Sold Price | Price Change |
Sold Properties
|
|---|---|---|---|
| 2025 | £563,736 | 23% |
17 Properties |
| 2024 | £434,660 | -49% |
25 Properties |
| 2023 | £647,659 | 18% |
22 Properties |
| 2022 | £531,976 | 6% |
56 Properties |
| 2021 | £498,465 | 16% |
45 Properties |
| 2020 | £417,586 | 12% |
33 Properties |
| 2019 | £366,500 | 7% |
30 Properties |
| 2018 | £340,693 | -4% |
36 Properties |
| 2017 | £354,550 | 14% |
39 Properties |
| 2016 | £304,975 | -16% |
43 Properties |
| 2015 | £353,942 | 9% |
39 Properties |
| 2014 | £320,736 | 6% |
48 Properties |
| 2013 | £300,743 | -11% |
41 Properties |
| 2012 | £335,050 | 9% |
20 Properties |
| 2011 | £303,798 | -8% |
31 Properties |
| 2010 | £329,101 | 16% |
29 Properties |
| 2009 | £277,474 | -2% |
53 Properties |
| 2008 | £283,601 | -7% |
42 Properties |
| 2007 | £302,720 | 5% |
51 Properties |
| 2006 | £286,439 | 2% |
51 Properties |
| 2005 | £281,137 | 11% |
48 Properties |
| 2004 | £251,086 | 17% |
60 Properties |
| 2003 | £207,714 | 18% |
50 Properties |
| 2002 | £170,307 | 10% |
63 Properties |
| 2001 | £154,039 | 15% |
59 Properties |
| 2000 | £131,686 | 4% |
53 Properties |
| 1999 | £126,093 | 17% |
53 Properties |
| 1998 | £104,247 | 2% |
51 Properties |
| 1997 | £102,626 | 15% |
77 Properties |
| 1996 | £87,118 | -9% |
53 Properties |
| 1995 | £94,987 | - |
28 Properties |
Property Price per Property Type in Charmouth
Here you can find historic sold price data in order to help with your property search.
The average Property Paid Price for specific property types in the last three years are:
| Property Type | Average Sold Price | Sold Properties |
|---|---|---|
| Semi Detached House | £476,766.00 | 15 Semi Detached Houses |
| Detached House | £706,532.00 | 31 Detached Houses |
| Terraced House | £315,875.00 | 12 Terraced Houses |
| Flat | £309,000.00 | 6 Flats |

