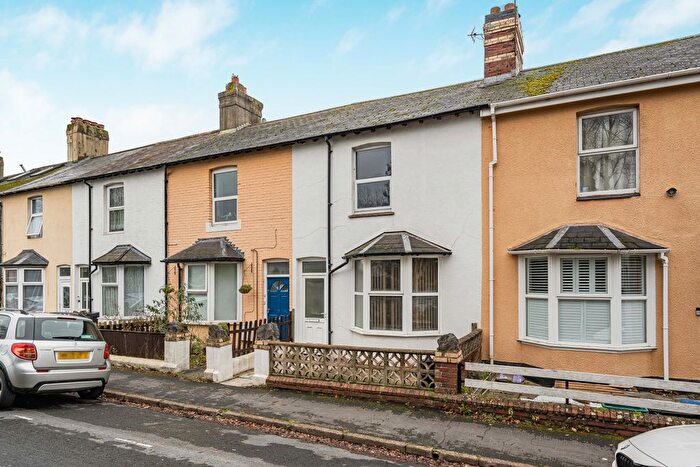
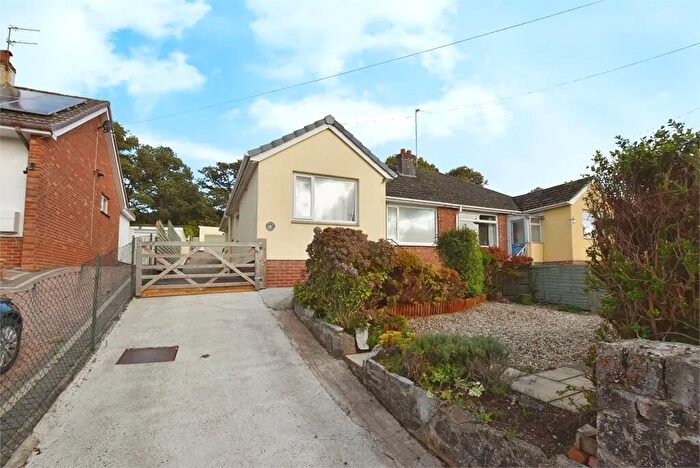
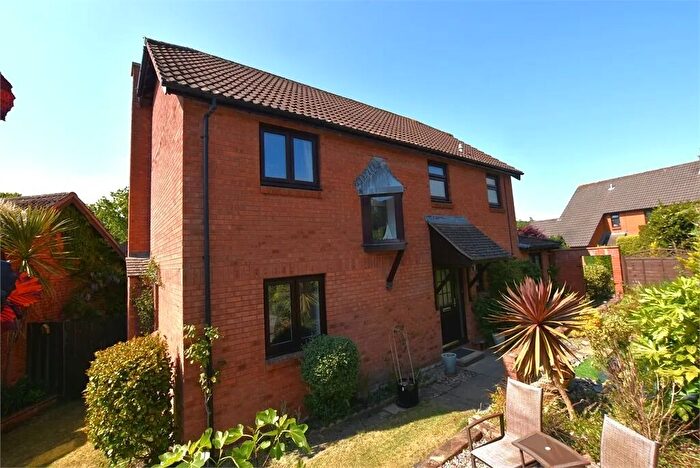
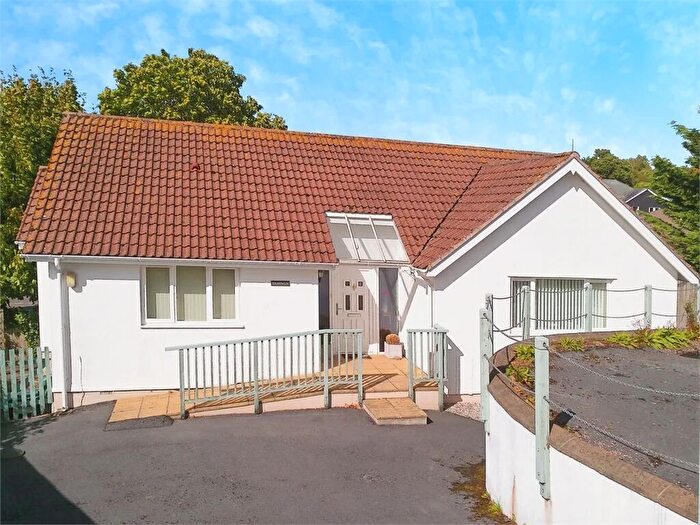
Houses for sale & to rent in Buckland And Milber, Newton Abbot
House Prices in Buckland And Milber
Properties in Buckland And Milber have an average house price of £282,518.00 and had 284 Property Transactions within the last 3 years¹.
Buckland And Milber is an area in Newton Abbot, Devon with 2,969 households², where the most expensive property was sold for £582,500.00.
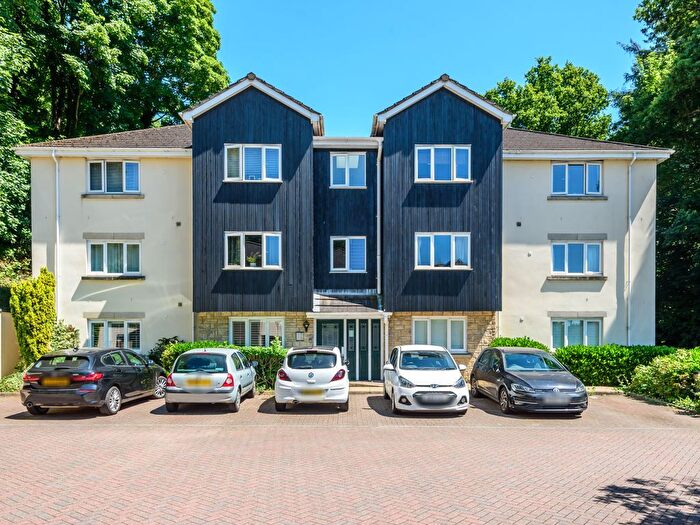
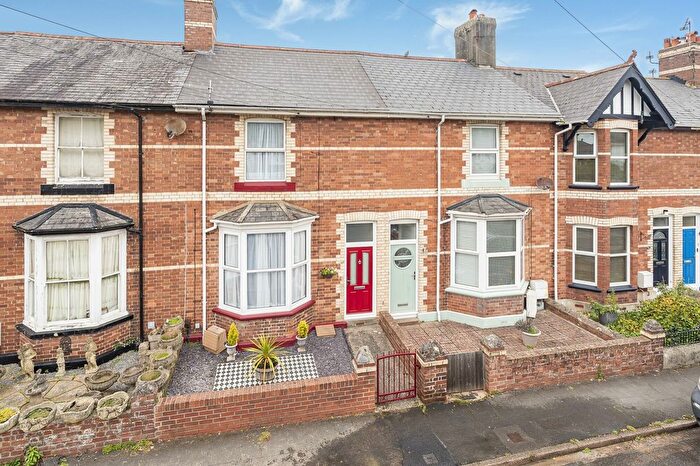
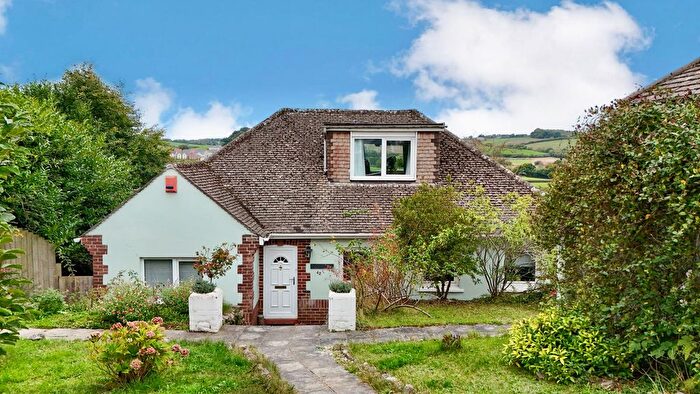
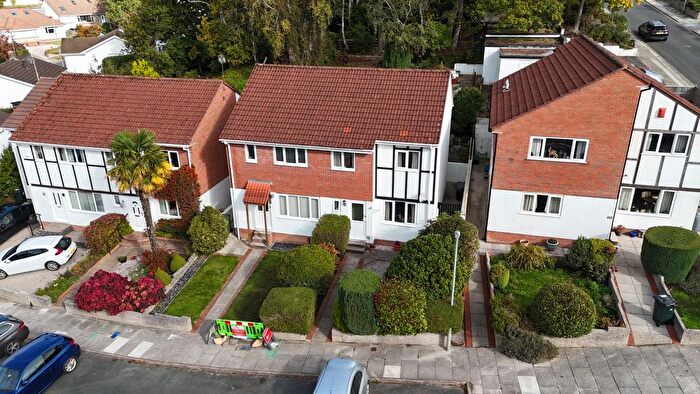
Properties for sale in Buckland And Milber
Previously listed properties in Buckland And Milber
Roads and Postcodes in Buckland And Milber
Navigate through our locations to find the location of your next house in Buckland And Milber, Newton Abbot for sale or to rent.
| Streets | Postcodes |
|---|---|
| Addison Road | TQ12 4NA |
| Alder Close | TQ12 4TJ |
| Aller Brake Road | TQ12 4NJ TQ12 4NL |
| Aller Park Road | TQ12 4NG TQ12 4NH TQ12 4NQ |
| Ash Way | TQ12 4LN TQ12 4LP TQ12 4LW |
| Aspen Drive | TQ12 4TN |
| Audley Rise | TQ12 4JW |
| Balmoral Close | TQ12 4BJ |
| Beechwood Avenue | TQ12 4LJ |
| Belgrave Road | TQ12 4JP TQ12 4JR TQ12 4JS |
| Birch Road | TQ12 4NT |
| Bracken Close | TQ12 4NU |
| Buckland Brake | TQ12 4DD TQ12 4DE |
| Buckland Road | TQ12 4DB TQ12 4DF TQ12 4DH TQ12 4DQ |
| Carew Gardens | TQ12 4DJ |
| Cedar Road | TQ12 4NY |
| Chestnut Drive | TQ12 4JX TQ12 4JZ |
| Chichester Way | TQ12 4HP |
| Church Way | TQ12 4NB |
| Drake Road | TQ12 4HL TQ12 4HN TQ12 4HW |
| Elizabeth Square | TQ12 4EJ |
| Fallowfield Close | TQ12 4EG |
| Fern Road | TQ12 4NR TQ12 4NZ |
| Flete Avenue | TQ12 4EH |
| Foxhollows | TQ12 4AN |
| Frobisher Road | TQ12 4HT |
| Gilbert Road | TQ12 4HS |
| Grenville Close | TQ12 4HR |
| Haccombe Path | TQ12 4JB |
| Haldon Close | TQ12 4BQ |
| Haldon Rise | TQ12 4BG |
| Hawkins Road | TQ12 4HJ |
| Hawthorn Close | TQ12 4TG |
| Haytor Drive | TQ12 4DR TQ12 4DU |
| Haytor Grove | TQ12 4DS |
| Hazel Close | TQ12 4JY |
| Heath Park | TQ12 4JQ |
| Howards Way | TQ12 4HU TQ12 4HX |
| Laburnum Road | TQ12 4LH |
| Lime Tree Walk | TQ12 4LF |
| Lower Fern Road | TQ12 4TQ |
| Margaret Gardens | TQ12 4DG |
| Mayflower Avenue | TQ12 4AR |
| Milber Trading Estate | TQ12 4SG |
| Monterey Park | TQ12 4BZ |
| Moore Close | TQ12 4TH |
| Moorland Close | TQ12 4ET |
| Moorland View | TQ12 4EP TQ12 4EW |
| Newtake Mount | TQ12 4JD |
| Newtake Rise | TQ12 4AS |
| Oak Tree Drive | TQ12 4NN |
| Oakland Road | TQ12 4EA TQ12 4EE TQ12 4EF |
| Park View | TQ12 4NX |
| Penn Inn Close | TQ12 4AY |
| Pinewood Road | TQ12 4LD TQ12 4LE TQ12 4LT |
| Plantation Close | TQ12 4NS |
| Poplar Close | TQ12 4PG |
| Queensway | TQ12 4BA TQ12 4BB TQ12 4BD TQ12 4BE TQ12 4BH TQ12 4BL TQ12 4BN |
| Raleigh Road | TQ12 4HG TQ12 4HH TQ12 4HQ |
| Reynell Avenue | TQ12 4HE TQ12 4HF |
| Ridgeway Road | TQ12 4LS |
| Rosewarne Avenue | TQ12 4ED |
| Rowantree Road | TQ12 4LL |
| Sandringham Road | TQ12 4HA TQ12 4HB TQ12 4HD |
| Shaldon Road | TQ12 4AX |
| Silverwood Avenue | TQ12 4LG |
| St Lukes Close | TQ12 4NF |
| St Lukes Road | TQ12 4ND TQ12 4NE |
| St Marychurch Road | TQ12 4BS TQ12 4BU TQ12 4LA TQ12 4LB |
| Sunny Close | TQ12 4EQ |
| Sutherland Close | TQ12 4TL |
| Swanborough Road | TQ12 4JL TQ12 4JN |
| The Copse | TQ12 4JJ |
| Tor View Avenue | TQ12 4EL TQ12 4EN |
| Twickenham Road | TQ12 4JA TQ12 4JE TQ12 4JF TQ12 4JG TQ12 4JH |
| Villiers Avenue | TQ12 4AT |
| Westward View | TQ12 4DT |
| Wildwoods Crescent | TQ12 4HY |
| Willow Close | TQ12 4PZ |
| Windsor Avenue | TQ12 4DL TQ12 4DN TQ12 4DP TQ12 4DW |
| Woodlands Road | TQ12 4ER |
| TQ12 4UN |
Transport near Buckland And Milber
- FAQ
- Price Paid By Year
- Property Type Price
Frequently asked questions about Buckland And Milber
What is the average price for a property for sale in Buckland And Milber?
The average price for a property for sale in Buckland And Milber is £282,518. This amount is 16% lower than the average price in Newton Abbot. There are 509 property listings for sale in Buckland And Milber.
What streets have the most expensive properties for sale in Buckland And Milber?
The streets with the most expensive properties for sale in Buckland And Milber are Shaldon Road at an average of £540,000, Lower Fern Road at an average of £496,250 and Aspen Drive at an average of £458,000.
What streets have the most affordable properties for sale in Buckland And Milber?
The streets with the most affordable properties for sale in Buckland And Milber are Pinewood Road at an average of £125,000, Wildwoods Crescent at an average of £168,666 and Addison Road at an average of £169,750.
Which train stations are available in or near Buckland And Milber?
Some of the train stations available in or near Buckland And Milber are Newton Abbot, Torre and Teignmouth.
Property Price Paid in Buckland And Milber by Year
The average sold property price by year was:
| Year | Average Sold Price | Price Change |
Sold Properties
|
|---|---|---|---|
| 2025 | £280,843 | -8% |
86 Properties |
| 2024 | £303,828 | 13% |
95 Properties |
| 2023 | £264,261 | -12% |
103 Properties |
| 2022 | £296,094 | 11% |
112 Properties |
| 2021 | £264,206 | 11% |
156 Properties |
| 2020 | £235,473 | 3% |
106 Properties |
| 2019 | £229,103 | -4% |
124 Properties |
| 2018 | £238,640 | 6% |
103 Properties |
| 2017 | £224,207 | 8% |
120 Properties |
| 2016 | £206,303 | 8% |
111 Properties |
| 2015 | £190,215 | 3% |
106 Properties |
| 2014 | £185,351 | 7% |
142 Properties |
| 2013 | £173,204 | -3% |
91 Properties |
| 2012 | £178,428 | 2% |
82 Properties |
| 2011 | £174,286 | -10% |
80 Properties |
| 2010 | £191,196 | 2% |
75 Properties |
| 2009 | £187,726 | 8% |
80 Properties |
| 2008 | £173,480 | -2% |
88 Properties |
| 2007 | £177,439 | -0,1% |
137 Properties |
| 2006 | £177,636 | 5% |
135 Properties |
| 2005 | £168,158 | 11% |
89 Properties |
| 2004 | £150,146 | 10% |
149 Properties |
| 2003 | £135,387 | 17% |
130 Properties |
| 2002 | £112,253 | 15% |
146 Properties |
| 2001 | £95,838 | 10% |
138 Properties |
| 2000 | £86,231 | 19% |
128 Properties |
| 1999 | £70,185 | 9% |
146 Properties |
| 1998 | £63,713 | 2% |
137 Properties |
| 1997 | £62,457 | 5% |
137 Properties |
| 1996 | £59,629 | 11% |
120 Properties |
| 1995 | £53,034 | - |
86 Properties |
Property Price per Property Type in Buckland And Milber
Here you can find historic sold price data in order to help with your property search.
The average Property Paid Price for specific property types in the last three years are:
| Property Type | Average Sold Price | Sold Properties |
|---|---|---|
| Semi Detached House | £264,122.00 | 85 Semi Detached Houses |
| Detached House | £362,875.00 | 106 Detached Houses |
| Terraced House | £220,712.00 | 80 Terraced Houses |
| Flat | £127,923.00 | 13 Flats |

