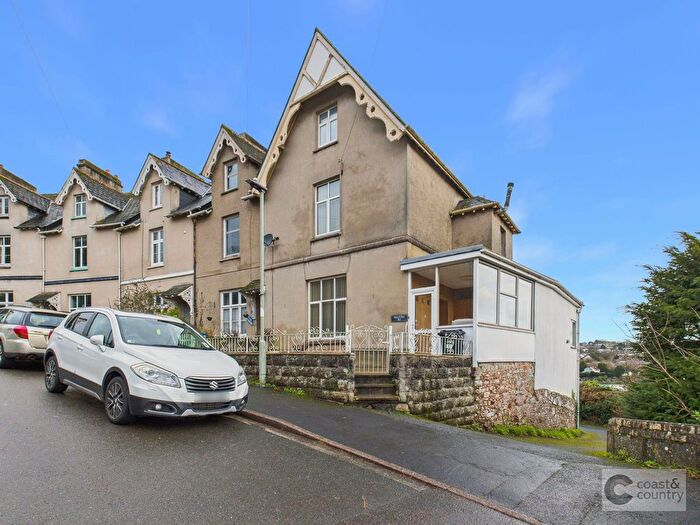
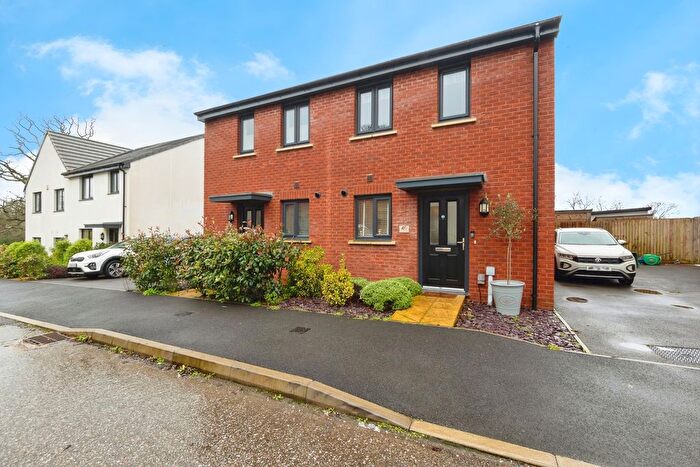
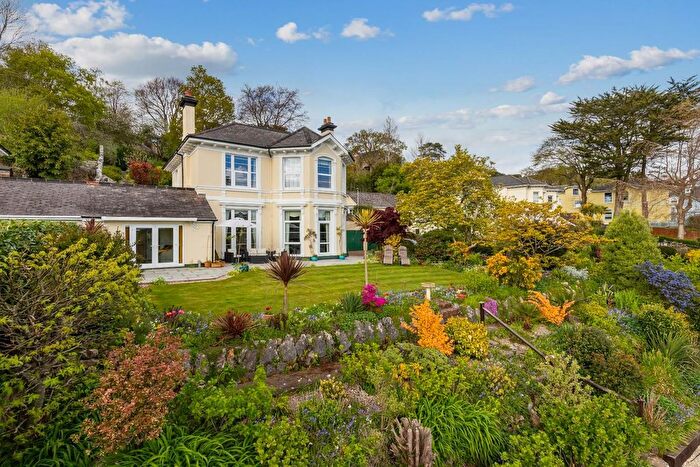
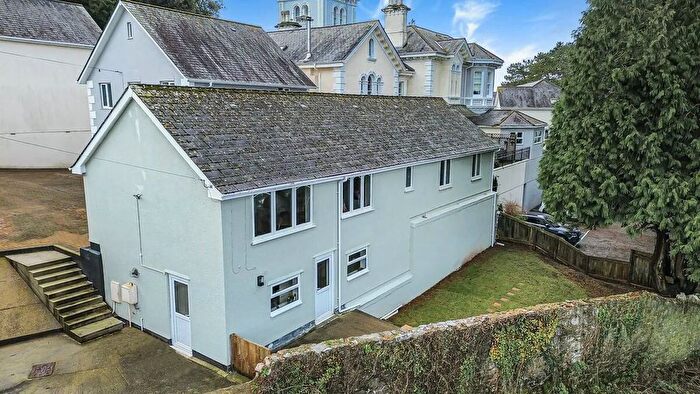
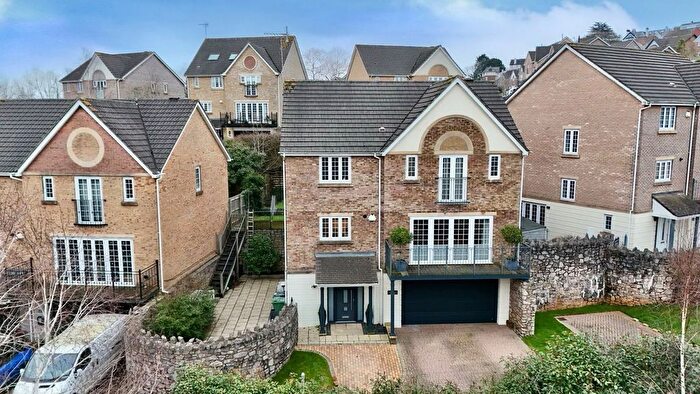
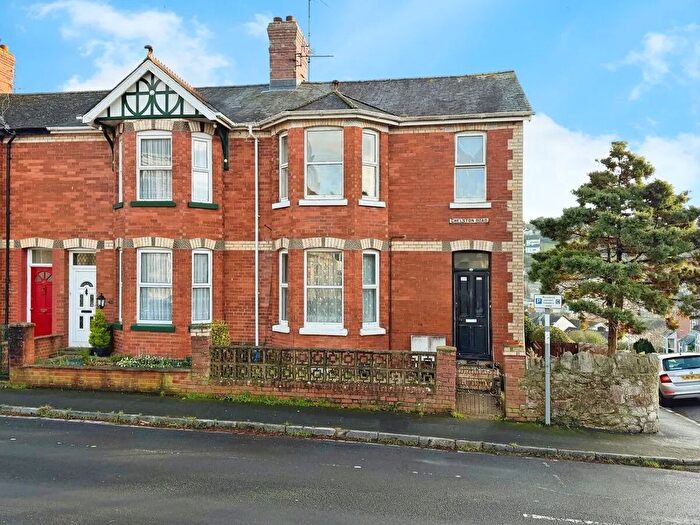
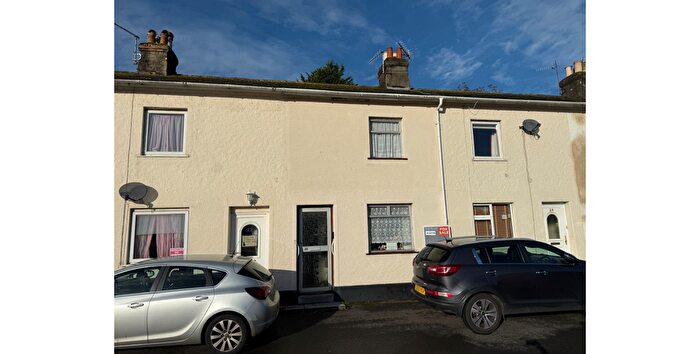
Houses for sale & to rent in Bushell, Newton Abbot
House Prices in Bushell
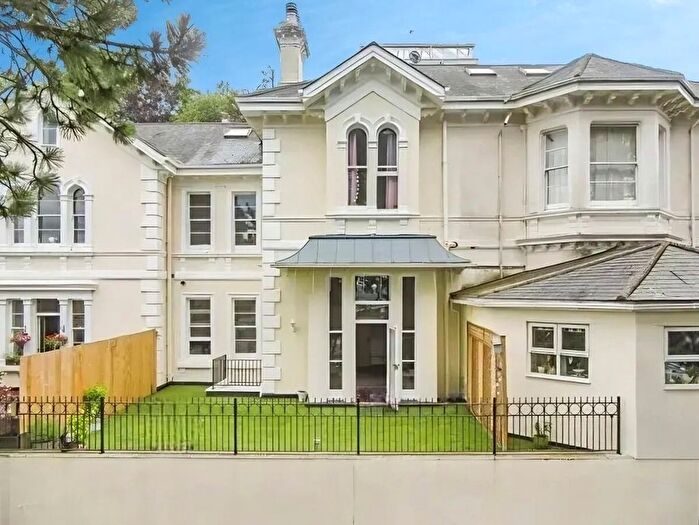
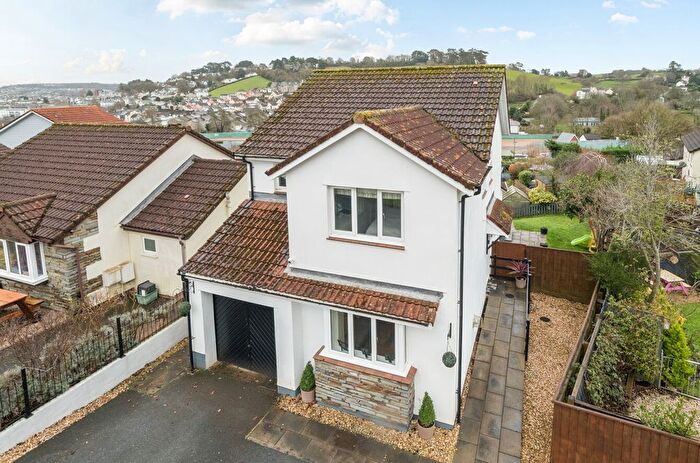
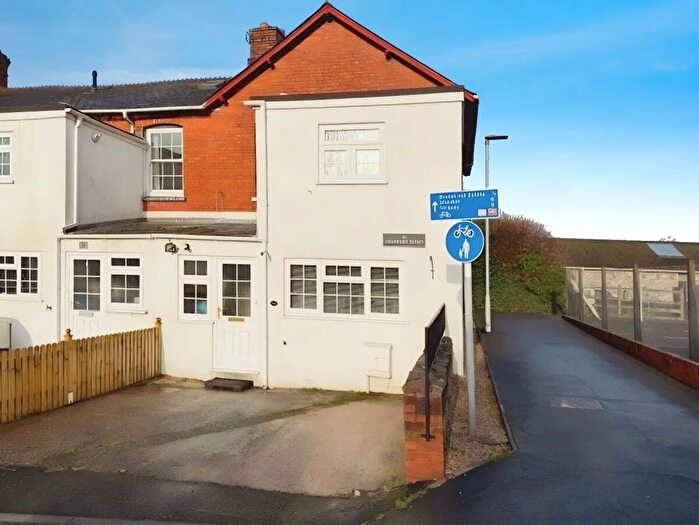
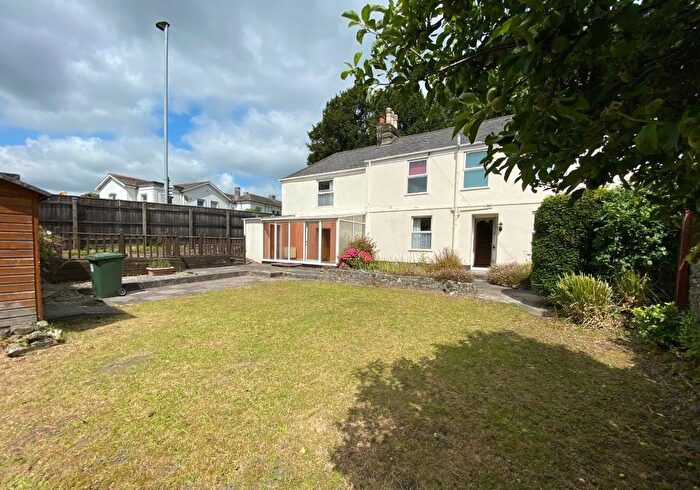
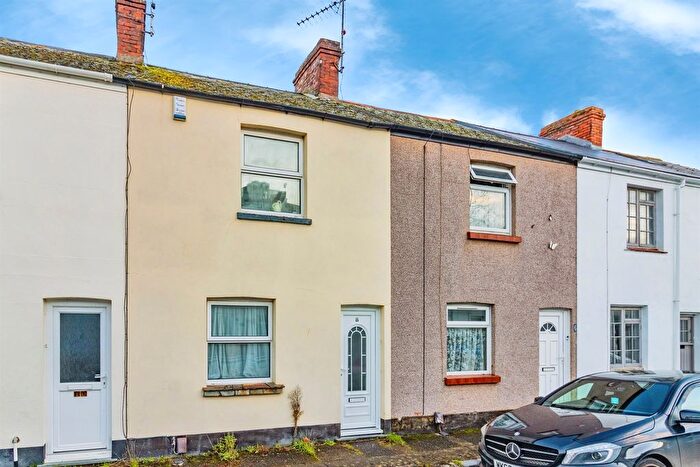
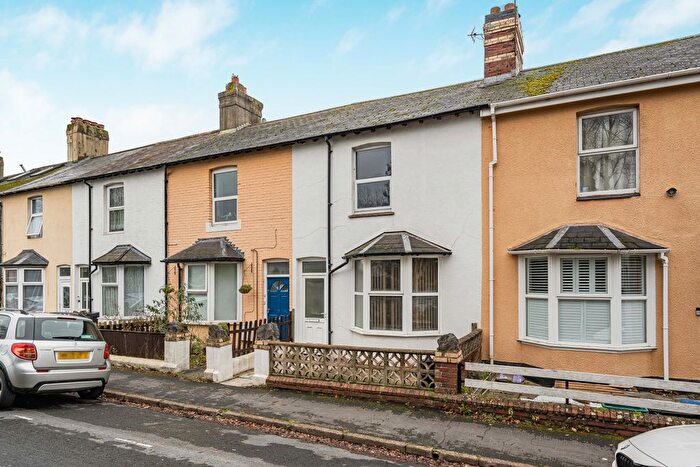
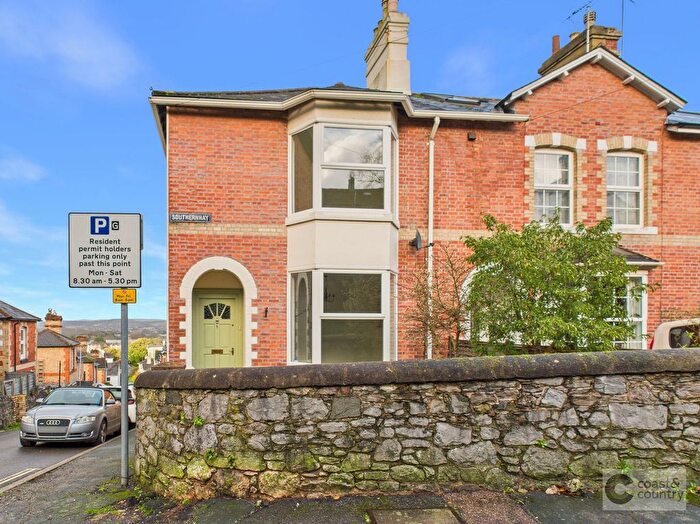
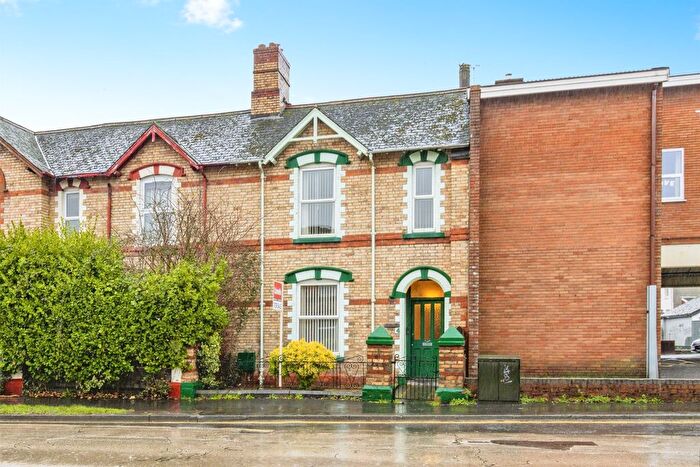
Properties in Bushell have an average house price of £219,403.00 and had 329 Property Transactions within the last 3 years¹.
Bushell is an area in Newton Abbot, Devon with 3,150 households², where the most expensive property was sold for £745,000.00.
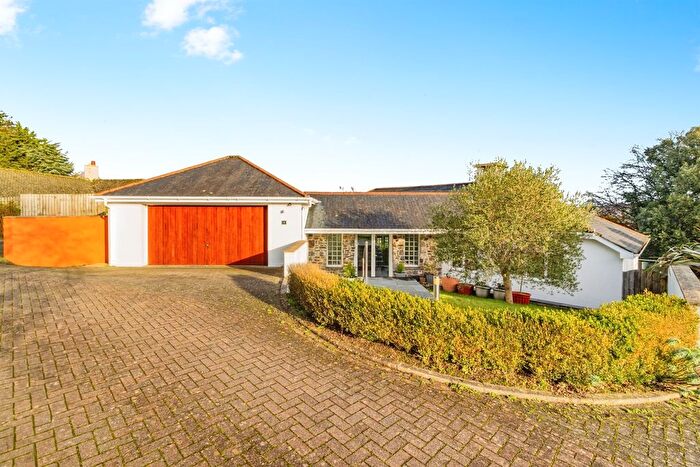
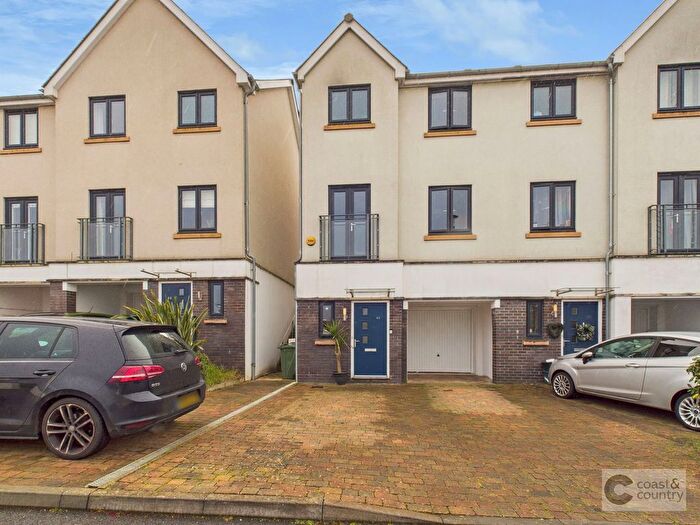
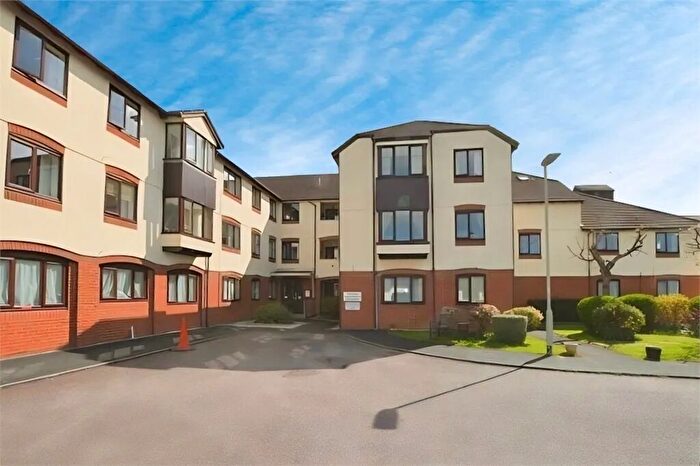
Properties for sale in Bushell
Previously listed properties in Bushell
Roads and Postcodes in Bushell
Navigate through our locations to find the location of your next house in Bushell, Newton Abbot for sale or to rent.
Transport near Bushell
-
Newton Abbot Station
-
Torre Station
-
Teignmouth Station
-
Torquay Station
-
Paignton Station
-
Dawlish Station
-
Totnes Station
-
Dawlish Warren Station
-
Starcross Station
- FAQ
- Price Paid By Year
- Property Type Price
Frequently asked questions about Bushell
What is the average price for a property for sale in Bushell?
The average price for a property for sale in Bushell is £219,403. This amount is 35% lower than the average price in Newton Abbot. There are 912 property listings for sale in Bushell.
What streets have the most expensive properties for sale in Bushell?
The streets with the most expensive properties for sale in Bushell are Courtenay Park at an average of £622,500, Nelson Place at an average of £496,785 and Orleigh Avenue at an average of £466,875.
What streets have the most affordable properties for sale in Bushell?
The streets with the most affordable properties for sale in Bushell are Salisbury Road at an average of £82,596, Whitelake Place at an average of £83,500 and Bearnes Lane at an average of £103,125.
Which train stations are available in or near Bushell?
Some of the train stations available in or near Bushell are Newton Abbot, Torre and Teignmouth.
Property Price Paid in Bushell by Year
The average sold property price by year was:
| Year | Average Sold Price | Price Change |
Sold Properties
|
|---|---|---|---|
| 2025 | £221,047 | 8% |
84 Properties |
| 2024 | £202,671 | -17% |
129 Properties |
| 2023 | £236,820 | 4% |
116 Properties |
| 2022 | £228,216 | -3% |
147 Properties |
| 2021 | £234,283 | 11% |
171 Properties |
| 2020 | £209,459 | 11% |
112 Properties |
| 2019 | £187,161 | -6% |
112 Properties |
| 2018 | £198,292 | 4% |
132 Properties |
| 2017 | £189,972 | 5% |
131 Properties |
| 2016 | £181,260 | 10% |
152 Properties |
| 2015 | £163,092 | -5% |
138 Properties |
| 2014 | £171,925 | 5% |
152 Properties |
| 2013 | £163,013 | 1% |
144 Properties |
| 2012 | £161,827 | -5% |
135 Properties |
| 2011 | £169,689 | 4% |
149 Properties |
| 2010 | £163,149 | -5% |
179 Properties |
| 2009 | £170,707 | 7% |
116 Properties |
| 2008 | £159,551 | -13% |
96 Properties |
| 2007 | £179,878 | 11% |
189 Properties |
| 2006 | £159,307 | 0,1% |
192 Properties |
| 2005 | £159,082 | 2% |
158 Properties |
| 2004 | £156,619 | 10% |
224 Properties |
| 2003 | £140,715 | 22% |
215 Properties |
| 2002 | £110,259 | 13% |
223 Properties |
| 2001 | £95,632 | 10% |
288 Properties |
| 2000 | £85,752 | 27% |
262 Properties |
| 1999 | £62,518 | 10% |
229 Properties |
| 1998 | £56,556 | 12% |
147 Properties |
| 1997 | £49,789 | 9% |
163 Properties |
| 1996 | £45,318 | 2% |
117 Properties |
| 1995 | £44,554 | - |
128 Properties |
Property Price per Property Type in Bushell
Here you can find historic sold price data in order to help with your property search.
The average Property Paid Price for specific property types in the last three years are:
| Property Type | Average Sold Price | Sold Properties |
|---|---|---|
| Flat | £125,469.00 | 99 Flats |
| Semi Detached House | £277,175.00 | 51 Semi Detached Houses |
| Detached House | £404,750.00 | 38 Detached Houses |
| Terraced House | £214,509.00 | 141 Terraced Houses |

