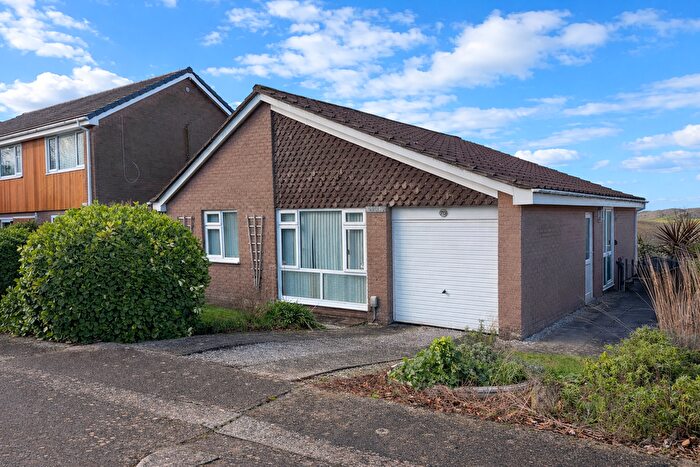
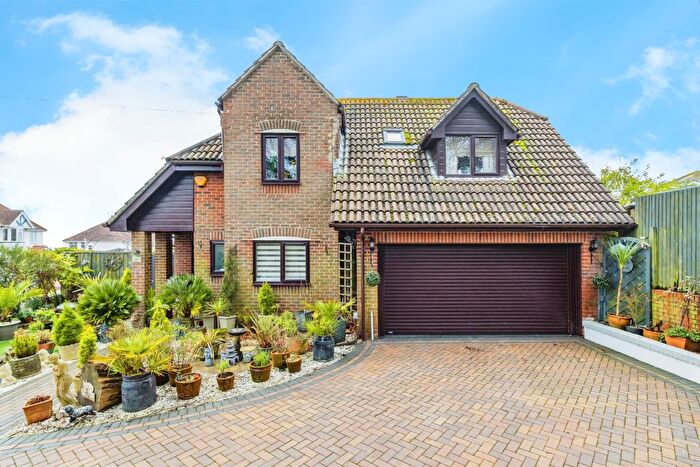
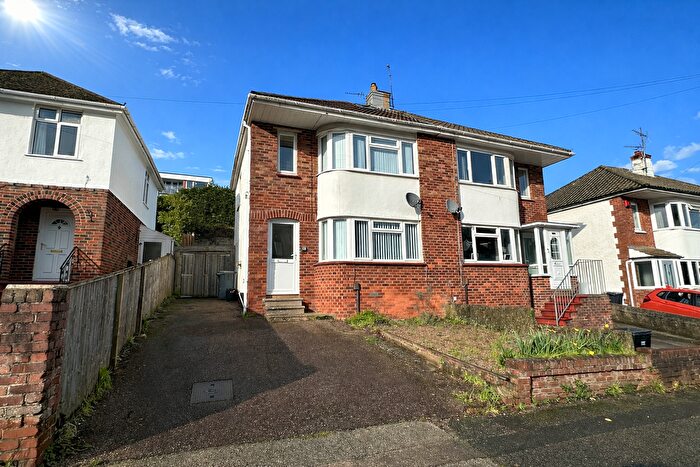
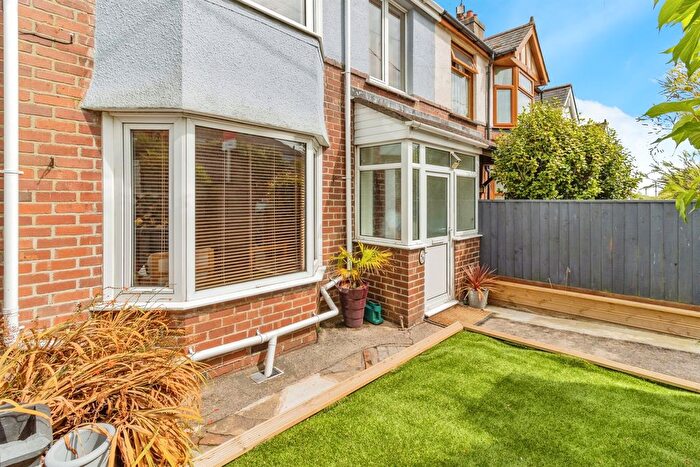
Houses for sale & to rent in Marldon, Paignton
House Prices in Marldon
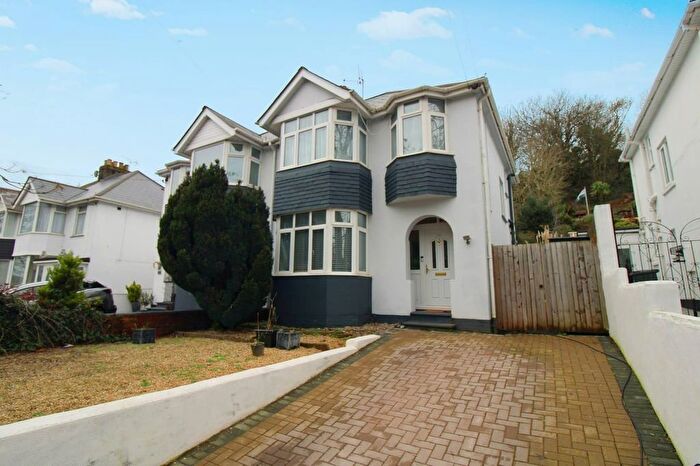
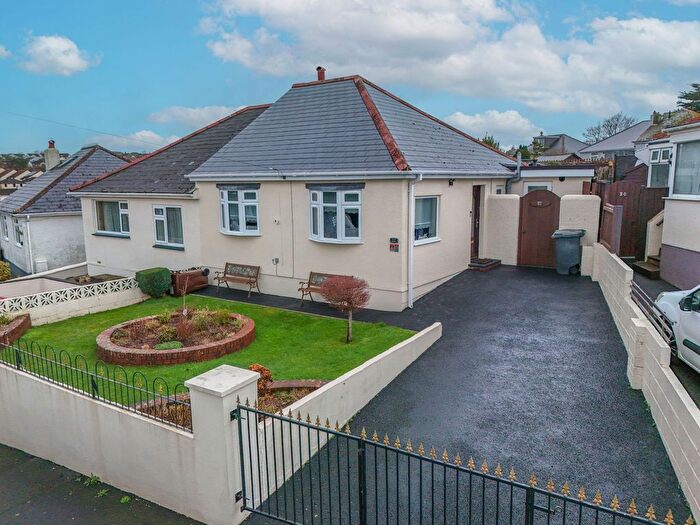
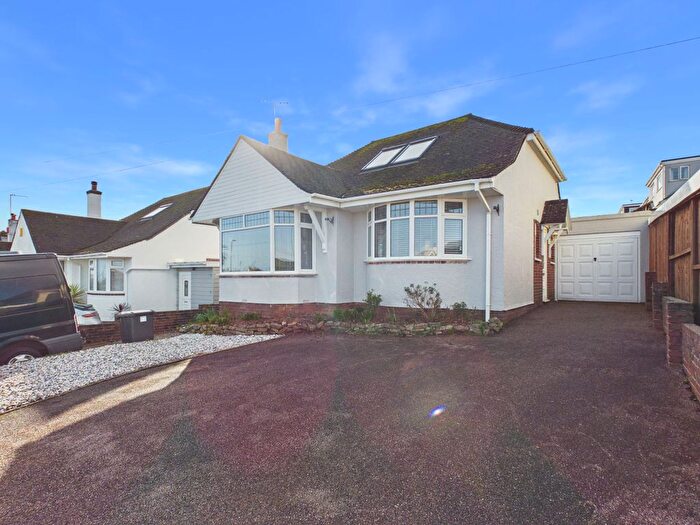
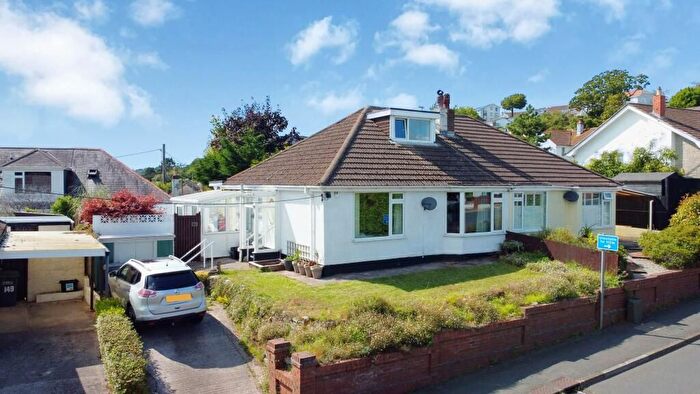
Properties in Marldon have an average house price of £407,730.00 and had 89 Property Transactions within the last 3 years¹.
Marldon is an area in Paignton, Devon with 913 households², where the most expensive property was sold for £1,100,000.00.
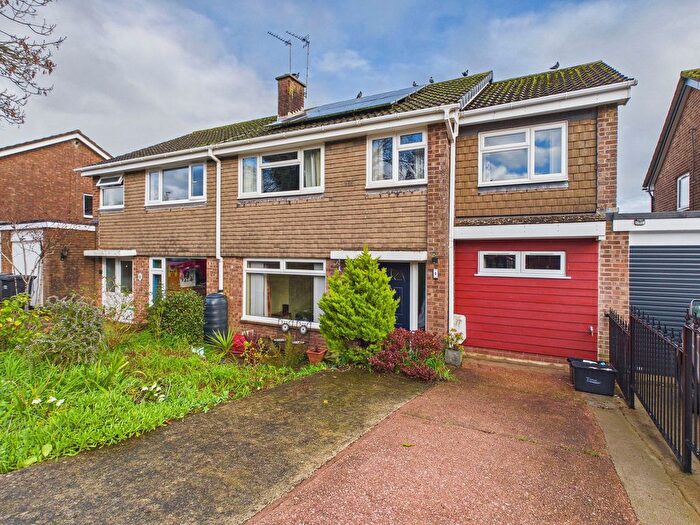
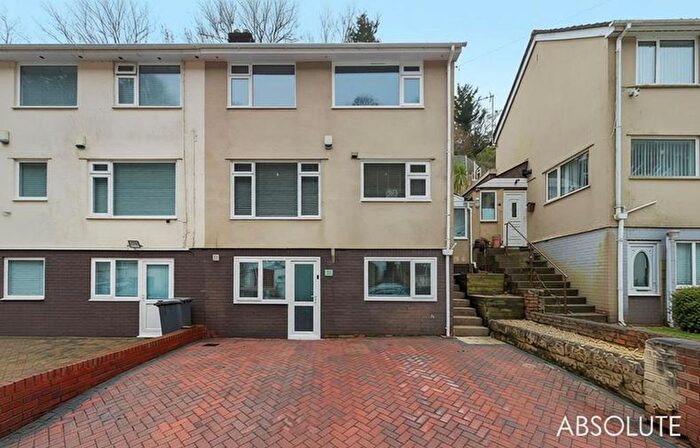
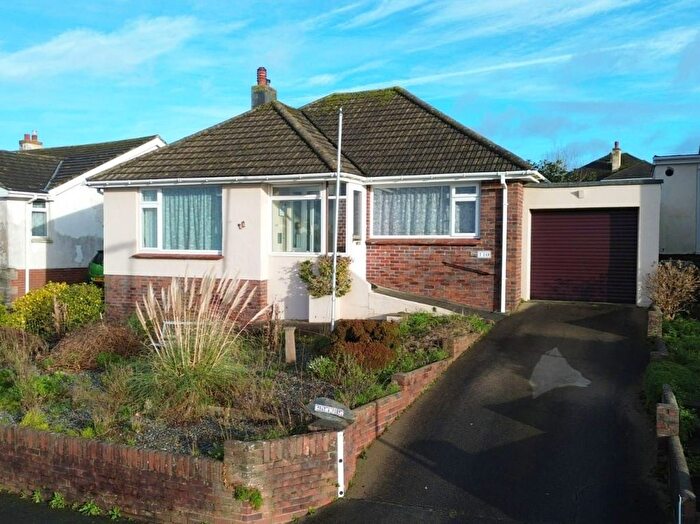
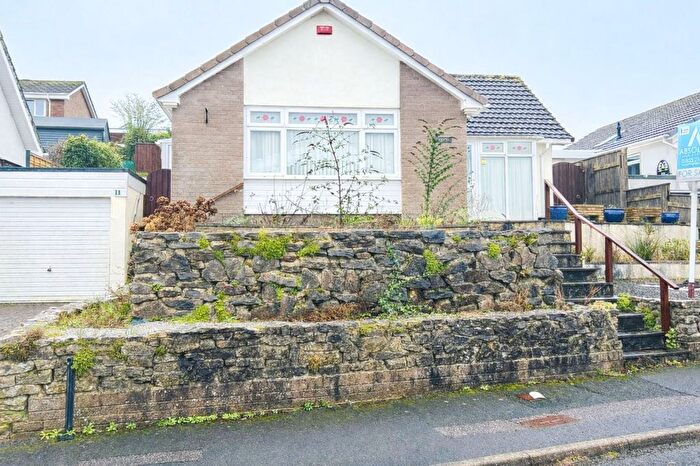
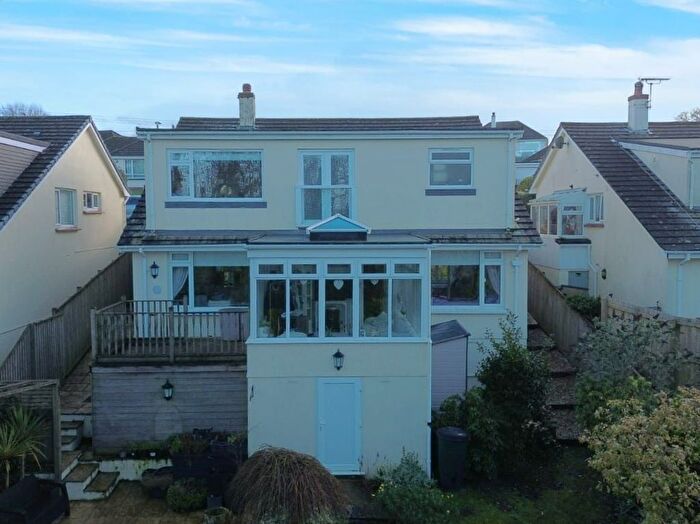
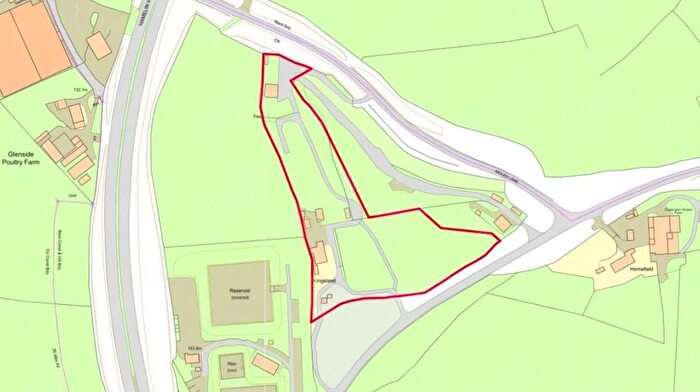
Properties for sale in Marldon
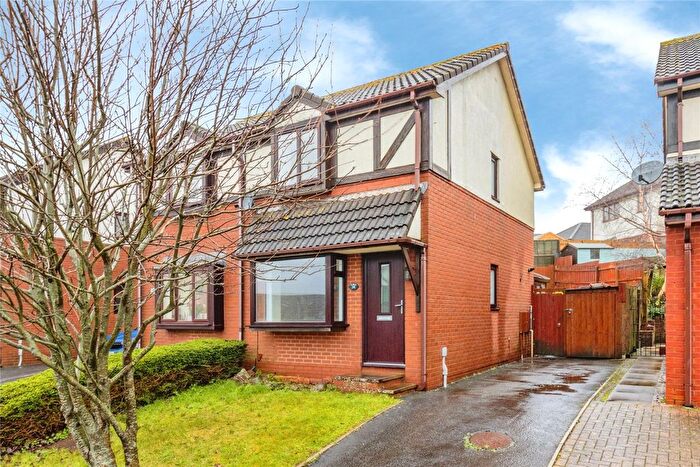
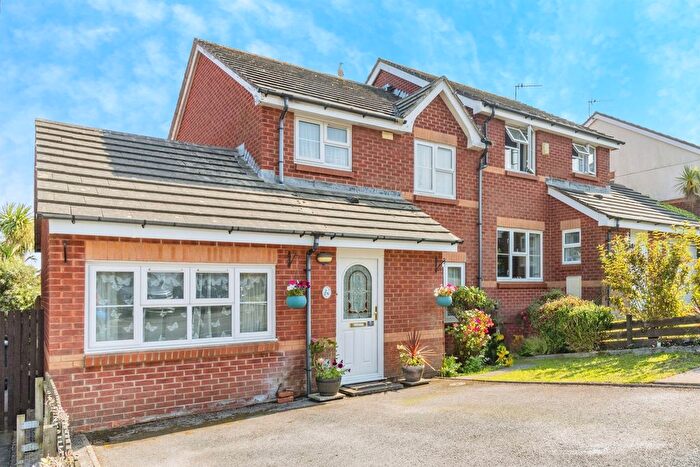
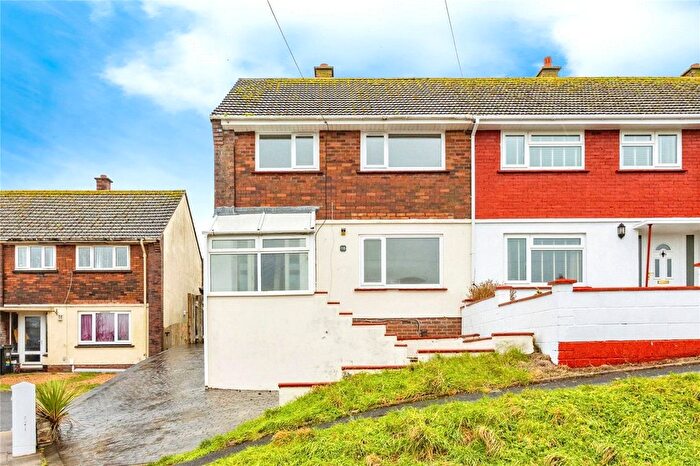
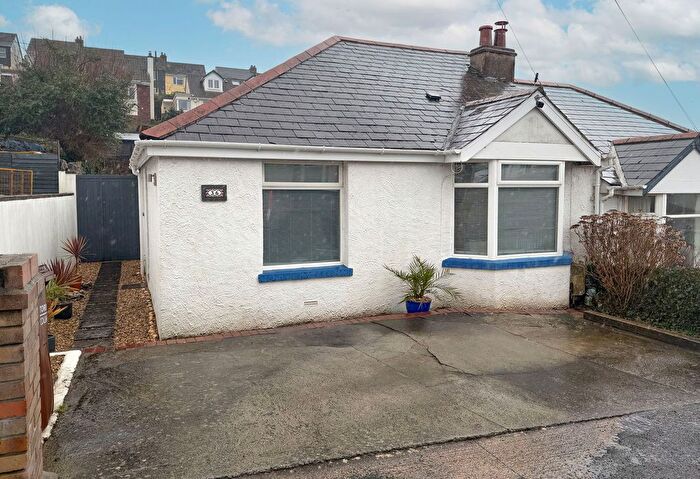
Previously listed properties in Marldon
Roads and Postcodes in Marldon
Navigate through our locations to find the location of your next house in Marldon, Paignton for sale or to rent.
| Streets | Postcodes |
|---|---|
| Bampton Close | TQ3 1NB |
| Belfield Avenue | TQ3 1NU |
| Belfield Close | TQ3 1NZ |
| Belfield Rise | TQ3 1NX |
| Belfield Way | TQ3 1NY |
| Brockhurst Park | TQ3 1LB |
| Brownscombe Close | TQ3 1LU |
| Butterlake | TQ3 1SN |
| Church Cottages | TQ3 1SL |
| Church Hill | TQ3 1SF |
| Churscombe Green | TQ3 1NT |
| Churscombe Park | TQ3 1NP |
| Churscombe Road | TQ3 1NA |
| Compton | TQ3 1TA TQ3 1TD |
| Five Lanes Road | TQ3 1NQ |
| Furzegood | TQ3 1PH |
| Gentian Close | TQ3 1LS |
| Higher Compton Barton | TQ3 1SA |
| Ipplepen Road | TQ3 1SE TQ3 1SG |
| Kiln Road | TQ3 1SH |
| Love Lane Close | TQ3 1TH |
| Loventor Crescent | TQ3 1LT |
| Marldon Cross Hill | TQ3 1NE TQ3 1NF TQ3 1PA TQ3 1PB TQ3 1PD TQ3 1SD |
| Marldon Grove | TQ3 1PN |
| Meadow Park | TQ3 1NR |
| Millmans Road | TQ3 1PE |
| Moles Lane | TQ3 1SY |
| Moor View | TQ3 1PL |
| Moorview End | TQ3 1PJ |
| Nether Meadow | TQ3 1NJ |
| Parkfield Close | TQ3 1PF |
| Pembroke Park | TQ3 1NL |
| Peters Crescent | TQ3 1PG TQ3 1PQ |
| Singmore Road | TQ3 1NW |
| Vicarage Hill | TQ3 1NH |
| Vicarage Road | TQ3 1NN |
| Village Road | TQ3 1SJ |
| Weekaborough Drive | TQ3 1ND |
| Westerland | TQ3 1RR TQ3 1RU |
| Westerland Lane | TQ3 1RP |
| Westview Road | TQ3 1NG |
| Wildwoods Lane | TQ3 1RS |
| TQ3 1SP TQ3 1SQ TQ3 1SR TQ3 1TB |
Transport near Marldon
- FAQ
- Price Paid By Year
- Property Type Price
Frequently asked questions about Marldon
What is the average price for a property for sale in Marldon?
The average price for a property for sale in Marldon is £407,730. This amount is 0.37% lower than the average price in Paignton. There are 1,835 property listings for sale in Marldon.
What streets have the most expensive properties for sale in Marldon?
The streets with the most expensive properties for sale in Marldon are Westerland at an average of £803,000, Church Hill at an average of £650,000 and Ipplepen Road at an average of £635,000.
What streets have the most affordable properties for sale in Marldon?
The streets with the most affordable properties for sale in Marldon are Belfield Avenue at an average of £190,000, Nether Meadow at an average of £196,000 and Furzegood at an average of £233,750.
Which train stations are available in or near Marldon?
Some of the train stations available in or near Marldon are Paignton, Torquay and Torre.
Property Price Paid in Marldon by Year
The average sold property price by year was:
| Year | Average Sold Price | Price Change |
Sold Properties
|
|---|---|---|---|
| 2025 | £420,400 | 6% |
25 Properties |
| 2024 | £395,398 | -4% |
35 Properties |
| 2023 | £411,693 | -21% |
29 Properties |
| 2022 | £497,279 | 22% |
29 Properties |
| 2021 | £388,555 | 1% |
53 Properties |
| 2020 | £383,950 | 17% |
33 Properties |
| 2019 | £319,346 | 8% |
28 Properties |
| 2018 | £294,400 | 9% |
34 Properties |
| 2017 | £267,785 | 3% |
37 Properties |
| 2016 | £260,966 | -4% |
30 Properties |
| 2015 | £272,523 | 8% |
38 Properties |
| 2014 | £250,953 | 1% |
42 Properties |
| 2013 | £249,066 | 7% |
42 Properties |
| 2012 | £232,809 | -22% |
32 Properties |
| 2011 | £283,812 | 13% |
28 Properties |
| 2010 | £246,075 | 5% |
26 Properties |
| 2009 | £233,557 | 5% |
32 Properties |
| 2008 | £221,454 | -29% |
23 Properties |
| 2007 | £285,279 | 19% |
42 Properties |
| 2006 | £232,226 | -4% |
56 Properties |
| 2005 | £240,641 | 0,5% |
42 Properties |
| 2004 | £239,498 | 24% |
30 Properties |
| 2003 | £182,505 | 11% |
34 Properties |
| 2002 | £161,680 | -5% |
63 Properties |
| 2001 | £170,125 | 20% |
81 Properties |
| 2000 | £136,428 | 23% |
83 Properties |
| 1999 | £104,479 | 9% |
65 Properties |
| 1998 | £95,557 | 28% |
47 Properties |
| 1997 | £68,629 | 1% |
43 Properties |
| 1996 | £68,092 | 3% |
41 Properties |
| 1995 | £66,194 | - |
26 Properties |
Property Price per Property Type in Marldon
Here you can find historic sold price data in order to help with your property search.
The average Property Paid Price for specific property types in the last three years are:
| Property Type | Average Sold Price | Sold Properties |
|---|---|---|
| Semi Detached House | £339,105.00 | 28 Semi Detached Houses |
| Detached House | £469,229.00 | 44 Detached Houses |
| Terraced House | £372,000.00 | 16 Terraced Houses |
| Flat | £195,000.00 | 1 Flat |

