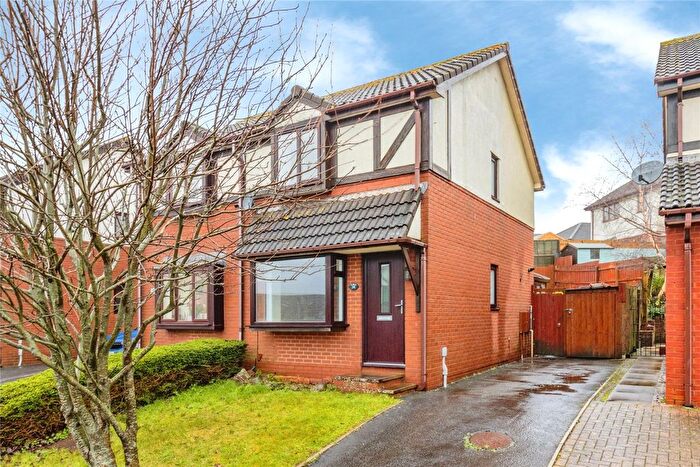
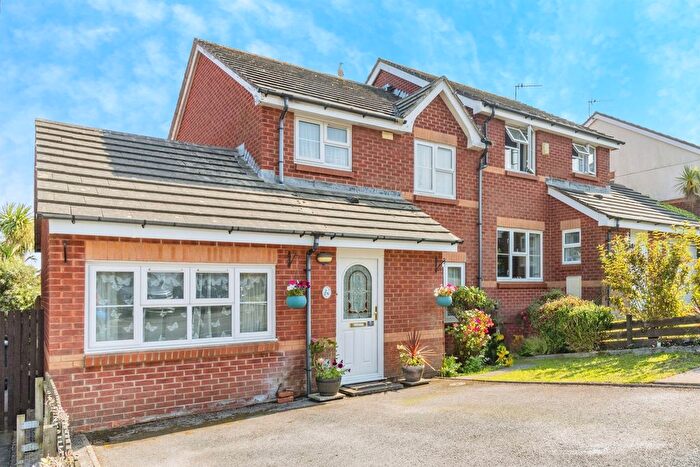
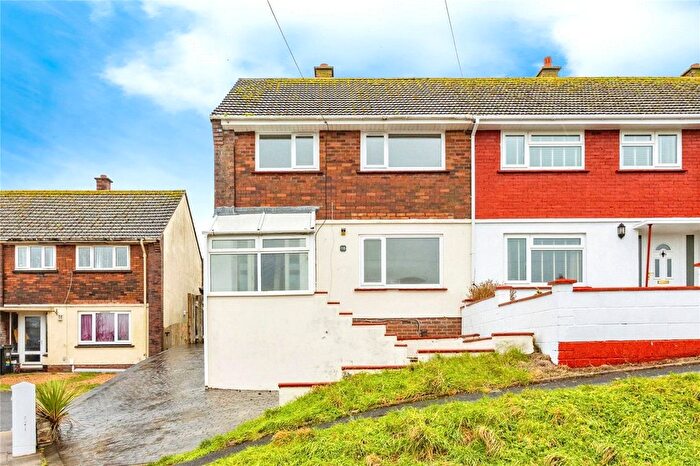
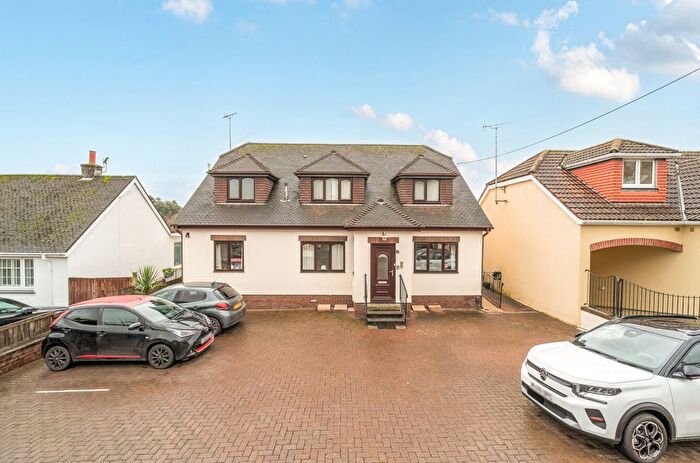
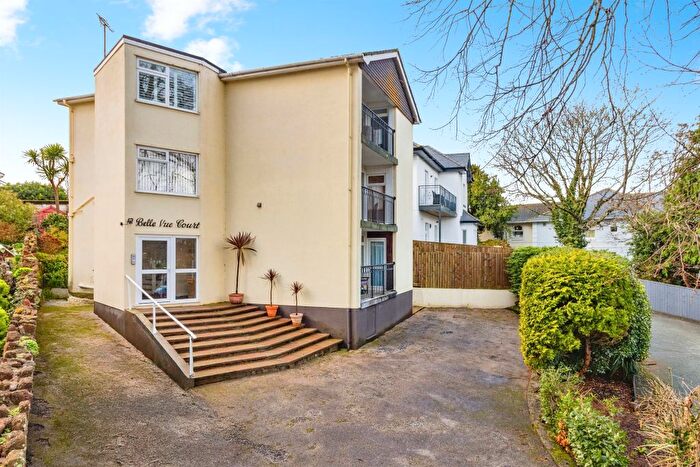
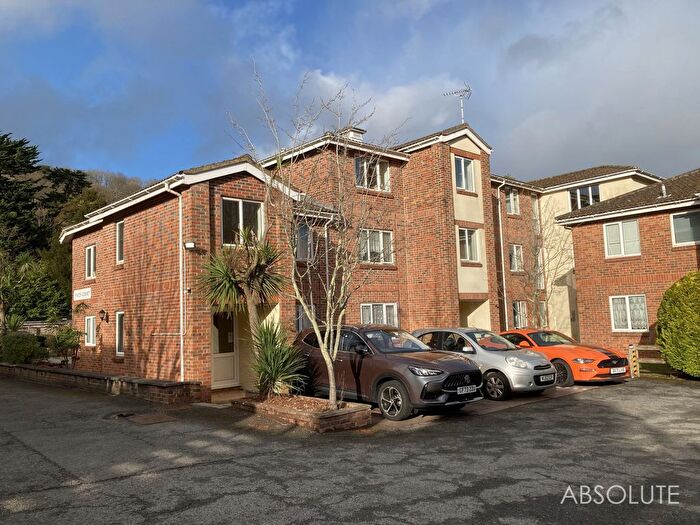
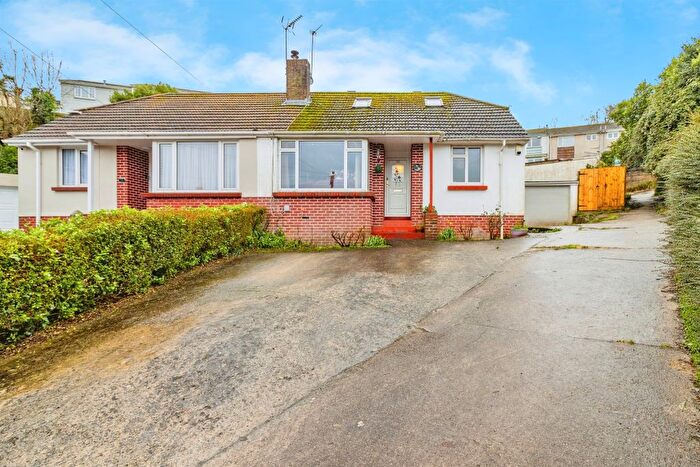
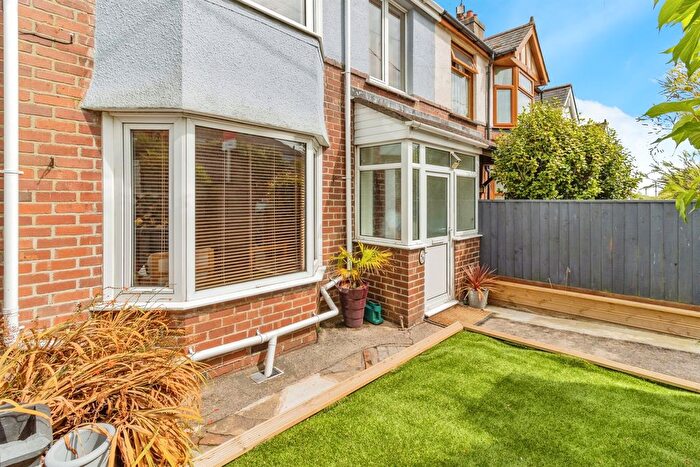
Houses for sale & to rent in Blatchcombe, Paignton
House Prices in Blatchcombe
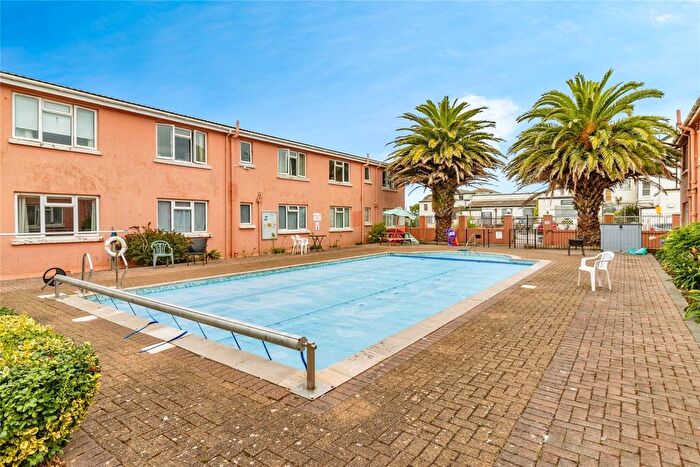
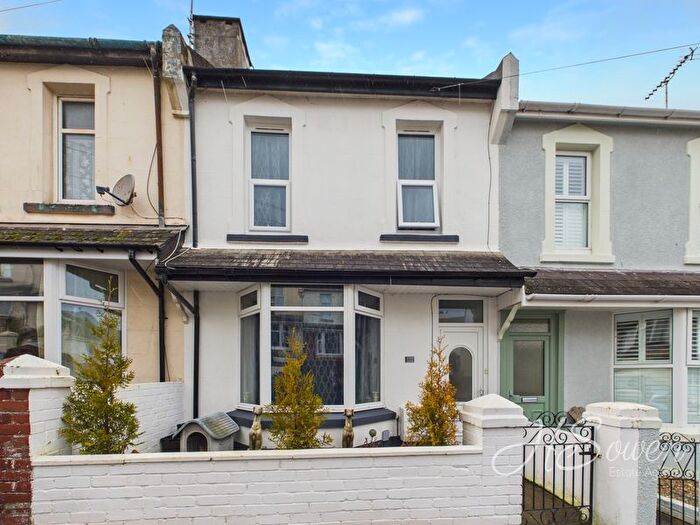
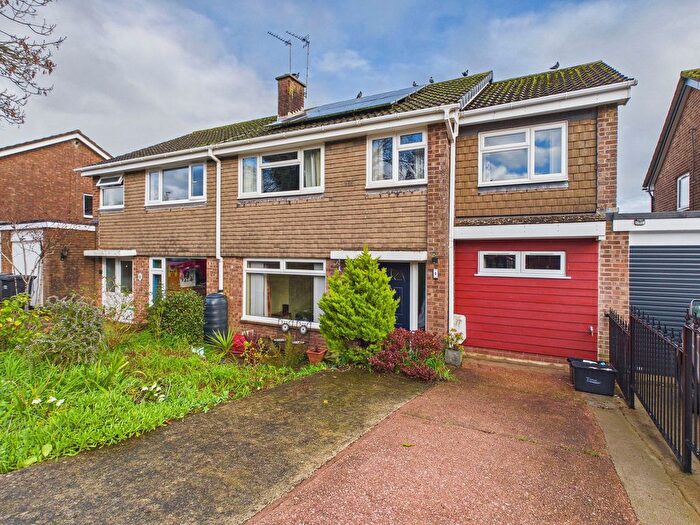
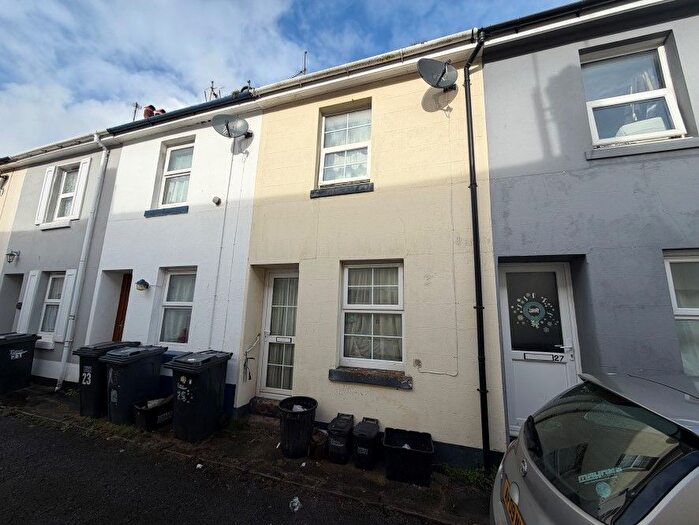
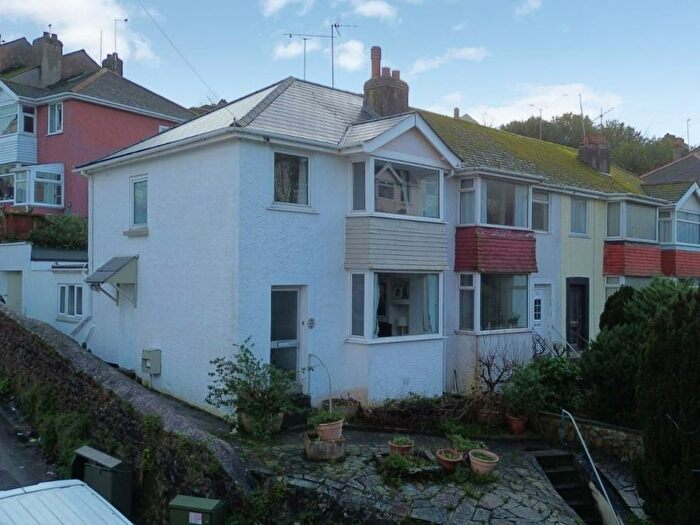
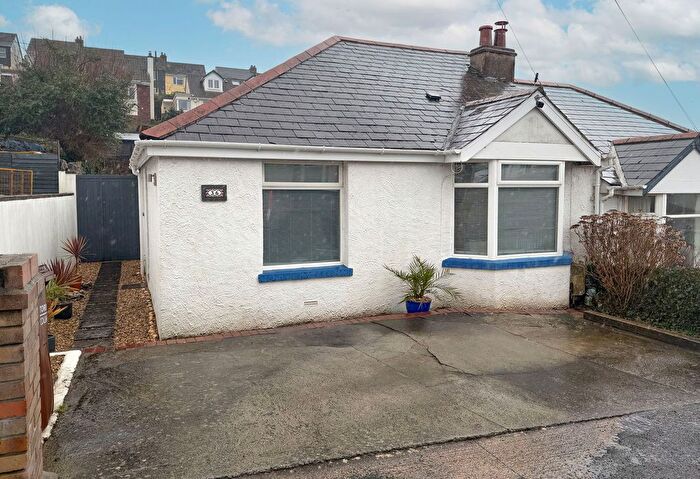
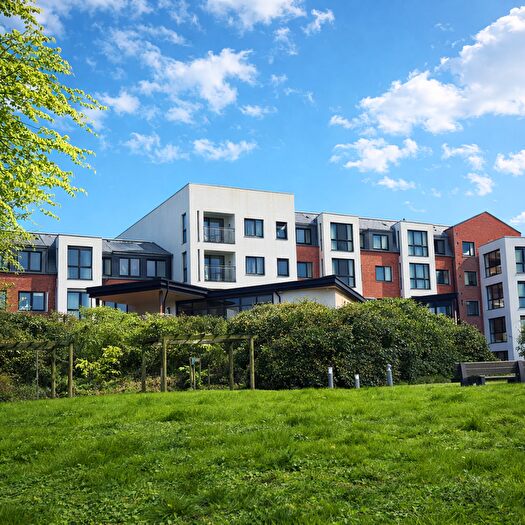
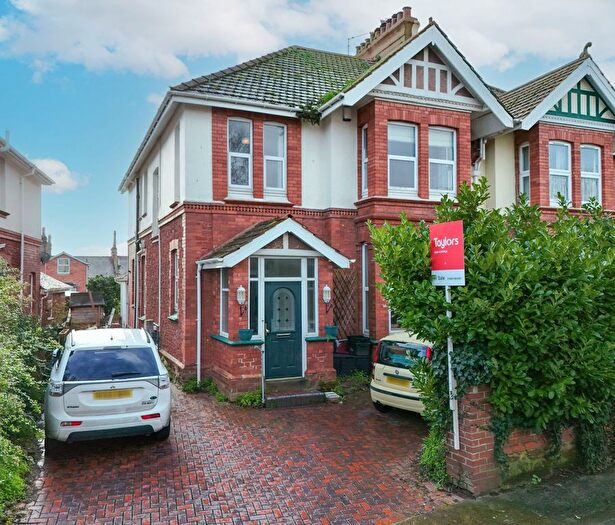
Properties in Blatchcombe have an average house price of £250,175.00 and had 350 Property Transactions within the last 3 years¹.
Blatchcombe is an area in Paignton, Torbay with 4,017 households², where the most expensive property was sold for £1,075,000.00.
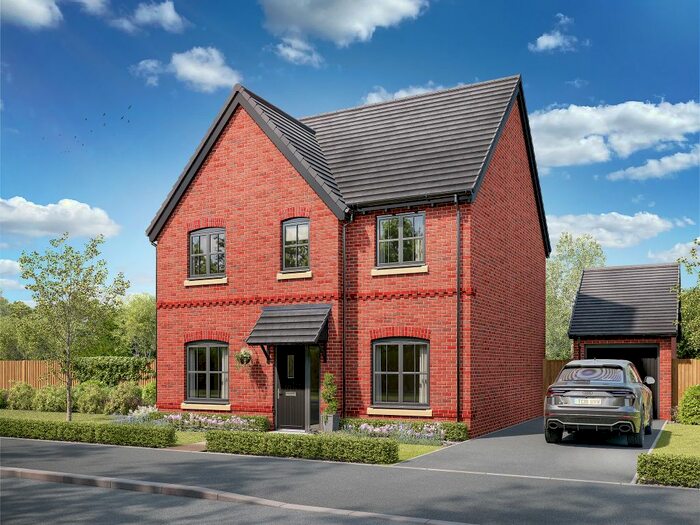
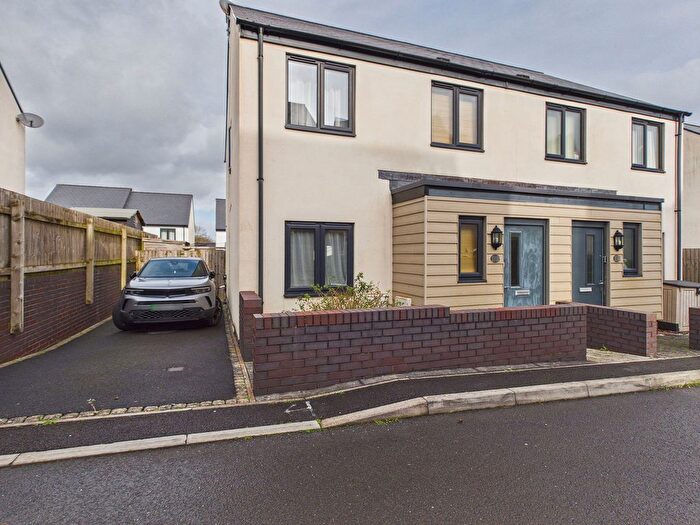
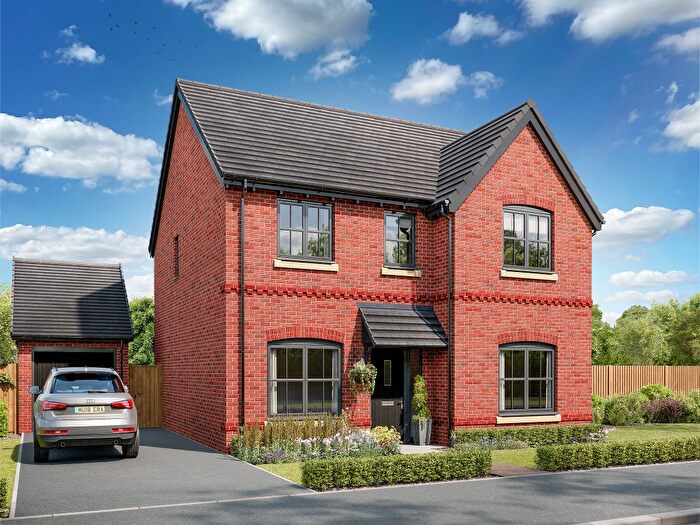
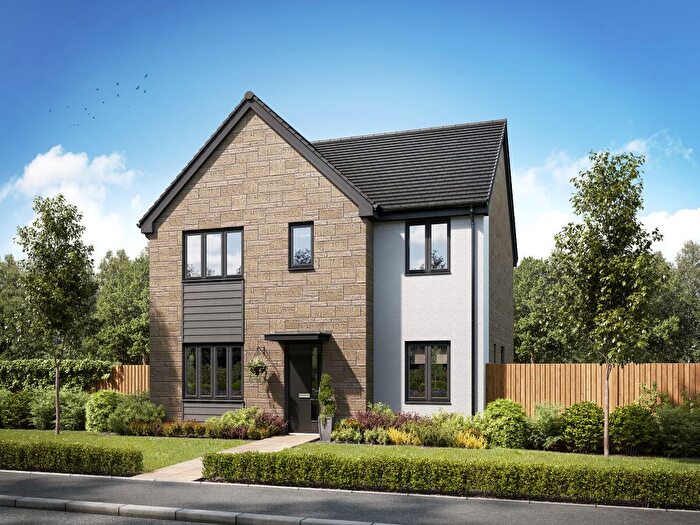
Properties for sale in Blatchcombe
Roads and Postcodes in Blatchcombe
Navigate through our locations to find the location of your next house in Blatchcombe, Paignton for sale or to rent.
| Streets | Postcodes |
|---|---|
| Abelia Close | TQ3 3TQ |
| Ailescombe Road | TQ3 3HZ |
| Alfriston Road | TQ3 3FR |
| Aspen Way | TQ4 7QR |
| Barton Avenue | TQ3 3HY TQ3 3JA TQ3 3JG TQ3 3JQ |
| Barton Close | TQ3 3TG |
| Barton Crescent | TQ3 3JE |
| Barton Drive | TQ3 3SH |
| Barton Gardens | TQ3 3JB |
| Barton Road | TQ3 3JD |
| Belfield Road | TQ3 3UY TQ3 3UZ TQ3 3XB |
| Blagdon Road | TQ3 3YA |
| Blakey Down Lane | TQ3 3NZ |
| Borough Park Road | TQ3 3TZ TQ3 3UA |
| Borough Road | TQ4 7DH TQ4 7DQ |
| Brecon Close | TQ4 7GF |
| Brixham Road | TQ4 7BA TQ4 7HG TQ4 7HQ |
| Cambrian Close | TQ4 7GA |
| Chartwell Close | TQ3 3LT |
| Cleatlands Close | TQ4 7AY |
| Collaton Mews | TQ4 7LL |
| Copley Close | TQ3 3QD |
| Cotehele Drive | TQ3 3GN |
| Dixon Close | TQ3 3NA |
| Drakes Road | TQ4 7HH |
| Dukes Close | TQ3 3YW |
| Dunstone Close | TQ3 3PA |
| Dunstone Park Road | TQ3 3NF TQ3 3NG TQ3 3XH |
| Dunstone Rise | TQ3 3PD |
| Earlswood Drive | TQ3 3GR |
| Falcon Park | TQ4 7PZ |
| Fernicombe Road | TQ3 3UP TQ3 3UX TQ3 3XD |
| Foxhole Road | TQ3 3ST TQ3 3SU TQ3 3TA TQ3 3TB TQ3 3TD TQ3 3TE TQ3 3TF |
| Grampian Close | TQ4 7GD |
| Great Parks Road | TQ3 3TS |
| Heligan Drive | TQ3 3GE |
| Higher Blagdon Cottages | TQ3 3YF |
| Higher Ramshill Lane | TQ3 3XY |
| Highfield Crescent | TQ3 3TP TQ3 3TR |
| Hillside Road | TQ3 3JF |
| Hodson Close | TQ3 3NU |
| Holne Moor Close | TQ3 3GH |
| Honeysuckle Close | TQ3 3PB |
| Hoyles Road | TQ3 3PH TQ3 3PJ TQ3 3PQ |
| James Avenue | TQ3 3LZ |
| Jasmine Grove | TQ3 3TH |
| Kerria Close | TQ3 3SF |
| Kings Ash Road | TQ3 3TT TQ3 3TU TQ3 3TX TQ3 3TY TQ3 3XF TQ3 3XG TQ3 3XL |
| Kingsland Drive | TQ4 7HJ |
| Langridge Road | TQ3 3PT |
| Lanhydrock Close | TQ3 3GP |
| Long Road | TQ4 7BL TQ4 7PQ |
| Longstone Road | TQ4 7HL TQ4 7HN |
| Lower Yalberton Cottages | TQ4 7PH |
| Luscombe Crescent | TQ3 3TW |
| Luscombe Lane | TQ3 3ZU |
| Luscombe Road | TQ3 3TL TQ3 3TN TQ3 3XW TQ3 3YL TQ3 3ZW |
| Lutyens Drive | TQ3 3LA TQ3 3LU |
| Marldon Road | TQ3 3LY TQ3 3NB TQ3 3ND TQ3 3NE TQ3 3NJ TQ3 3NL TQ3 3NN TQ3 3NQ TQ3 3NS TQ3 3NW |
| Mimosa Way | TQ4 7FE |
| Montesson Close | TQ3 3GX |
| Montesson Road | TQ3 3GT |
| Mulberry Close | TQ3 3GB TQ3 3GD |
| New Park Road | TQ3 3UU |
| Northleat Avenue | TQ3 3UG |
| Overclose | TQ3 3PX |
| Pembroke Road | TQ3 3UR TQ3 3UT |
| Pennine Drive | TQ4 7GB |
| Pimm Road | TQ3 3XA |
| Pines Road | TQ3 3PE TQ3 3PF TQ3 3PG |
| Queen Elizabeth Drive | TQ3 3YN TQ3 3YP TQ3 3YR TQ3 3YS |
| Ramshill Road | TQ3 3PL TQ3 3PN TQ3 3PP TQ3 3PW |
| Redwell Lane | TQ3 3SN |
| Redwell Road | TQ3 3PR TQ3 3PS TQ3 3PU TQ3 3PY |
| Smallcombe Road | TQ3 3RX TQ3 3SJ TQ3 3SL TQ3 3SP TQ3 3SR TQ3 3SW TQ3 3TJ |
| Snowdonia Close | TQ4 7GE |
| Spencer Road | TQ3 3SX TQ3 3SY TQ3 3SZ |
| Spruce Way | TQ3 3SG |
| St Johns Terrace | TQ3 3FD |
| St Marys Park | TQ4 7DA TQ4 7DB |
| Stoke Road | TQ4 7DD TQ4 7PA |
| Swincombe Drive | TQ3 3QF |
| Tallow Wood Close | TQ3 3HD |
| The Grove | TQ4 7DL |
| Tor Park Road | TQ4 7PB TQ4 7PL |
| Totnes Road | TQ4 7DE TQ4 7DG TQ4 7HB TQ4 7HD TQ4 7HE TQ4 7PT TQ4 7PW TQ4 7PY |
| Treesdale Close | TQ3 3QB |
| Trelissick Close | TQ3 3FN |
| Trelissick Road | TQ3 3GJ TQ3 3GS TQ3 3GU TQ3 3GW TQ3 3GY TQ3 3GZ |
| Trentham Close | TQ3 3GF |
| Trojan Industrial Park | TQ4 7EP |
| Two Acre Close | TQ3 3XX |
| Underidge Close | TQ3 3XU |
| Underidge Drive | TQ3 3XP |
| Underidge Lane | TQ3 3FH |
| Underidge Road | TQ3 3XS |
| Waddeton Road | TQ4 7BJ |
| Waterleat Avenue | TQ3 3UD TQ3 3UE TQ3 3UF TQ3 3UJ |
| Waterleat Close | TQ3 3UN |
| Waterleat Road | TQ3 3UB TQ3 3UH TQ3 3UQ |
| Watkins Way | TQ3 3JJ |
| West Lane | TQ3 3YQ |
| Westleat Avenue | TQ3 3UL |
| Whitebeam Close | TQ3 3GA |
| Woburn Close | TQ3 3GG |
| Woodland Glade | TQ4 7PD |
| Yalberton Industrial Estate | TQ4 7QL |
| Yalberton Road | TQ4 7PE |
| TQ3 3YB TQ3 3YE TQ3 3YG TQ4 7PU |
Transport near Blatchcombe
- FAQ
- Price Paid By Year
- Property Type Price
Frequently asked questions about Blatchcombe
What is the average price for a property for sale in Blatchcombe?
The average price for a property for sale in Blatchcombe is £250,175. This amount is 6% lower than the average price in Paignton. There are 4,694 property listings for sale in Blatchcombe.
What streets have the most expensive properties for sale in Blatchcombe?
The streets with the most expensive properties for sale in Blatchcombe are Woodland Glade at an average of £550,000, Lower Yalberton Cottages at an average of £516,500 and Long Road at an average of £473,750.
What streets have the most affordable properties for sale in Blatchcombe?
The streets with the most affordable properties for sale in Blatchcombe are Redwell Road at an average of £70,000, Two Acre Close at an average of £88,500 and Underidge Road at an average of £102,928.
Which train stations are available in or near Blatchcombe?
Some of the train stations available in or near Blatchcombe are Paignton, Torquay and Torre.
Property Price Paid in Blatchcombe by Year
The average sold property price by year was:
| Year | Average Sold Price | Price Change |
Sold Properties
|
|---|---|---|---|
| 2025 | £248,212 | 4% |
120 Properties |
| 2024 | £238,369 | -12% |
128 Properties |
| 2023 | £267,299 | 1% |
102 Properties |
| 2022 | £264,019 | 10% |
152 Properties |
| 2021 | £236,660 | 11% |
205 Properties |
| 2020 | £211,116 | 9% |
158 Properties |
| 2019 | £192,080 | -4% |
190 Properties |
| 2018 | £199,294 | 1% |
193 Properties |
| 2017 | £196,624 | 7% |
213 Properties |
| 2016 | £182,869 | -0,5% |
165 Properties |
| 2015 | £183,697 | 6% |
206 Properties |
| 2014 | £172,970 | 1% |
197 Properties |
| 2013 | £170,768 | 6% |
164 Properties |
| 2012 | £161,174 | 8% |
133 Properties |
| 2011 | £148,689 | -4% |
125 Properties |
| 2010 | £155,102 | 0,1% |
114 Properties |
| 2009 | £154,898 | -7% |
114 Properties |
| 2008 | £166,438 | -4% |
109 Properties |
| 2007 | £173,606 | 4% |
221 Properties |
| 2006 | £167,074 | 6% |
305 Properties |
| 2005 | £157,131 | 5% |
204 Properties |
| 2004 | £150,015 | 13% |
261 Properties |
| 2003 | £129,940 | 11% |
336 Properties |
| 2002 | £115,378 | 18% |
349 Properties |
| 2001 | £95,160 | 10% |
369 Properties |
| 2000 | £86,006 | 15% |
394 Properties |
| 1999 | £73,244 | 13% |
346 Properties |
| 1998 | £63,592 | 9% |
232 Properties |
| 1997 | £57,551 | 4% |
208 Properties |
| 1996 | £55,042 | -5% |
227 Properties |
| 1995 | £57,966 | - |
171 Properties |
Property Price per Property Type in Blatchcombe
Here you can find historic sold price data in order to help with your property search.
The average Property Paid Price for specific property types in the last three years are:
| Property Type | Average Sold Price | Sold Properties |
|---|---|---|
| Flat | £131,748.00 | 26 Flats |
| Semi Detached House | £235,357.00 | 140 Semi Detached Houses |
| Detached House | £376,342.00 | 71 Detached Houses |
| Terraced House | £216,509.00 | 113 Terraced Houses |

