
Houses for sale in EX10 8DB, York Street, Sidmouth Town, Sidmouth
House Prices in EX10 8DB, York Street, Sidmouth Town
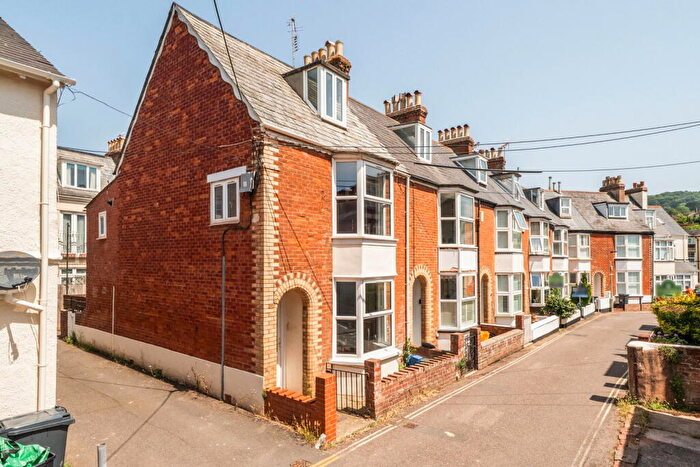
Properties in EX10 8DB have an average house price of £375k and had 1 Property Transaction within the last 3 years.¹ EX10 8DB is a postcode in York Street located in Sidmouth Town, an area in Sidmouth, Devon, with 1 household², where the most expensive property was sold for £375k.
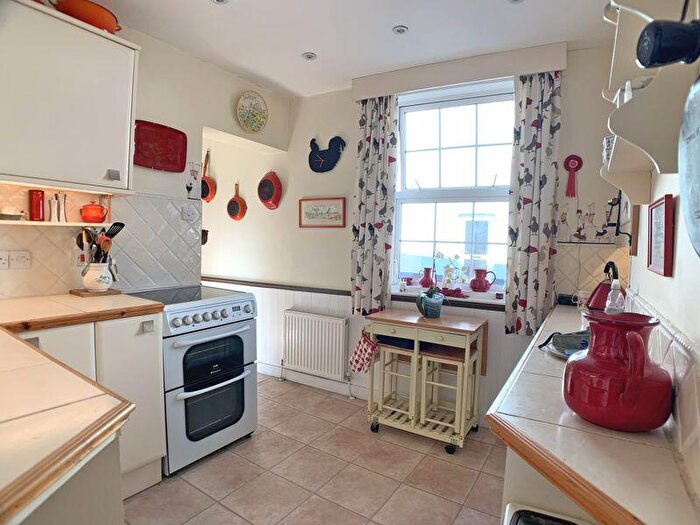
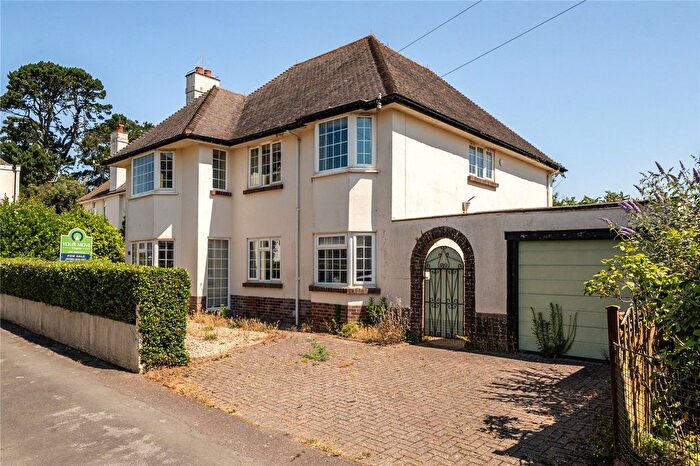
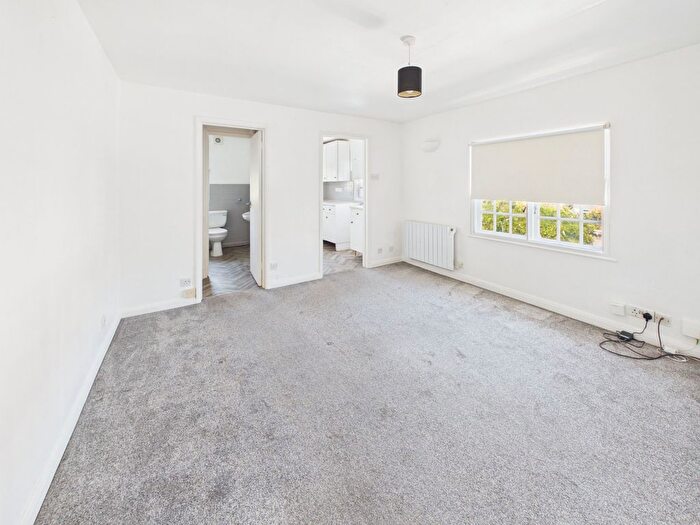
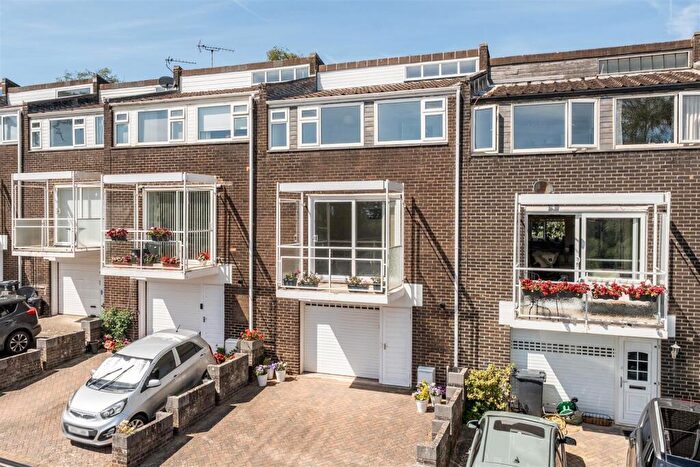
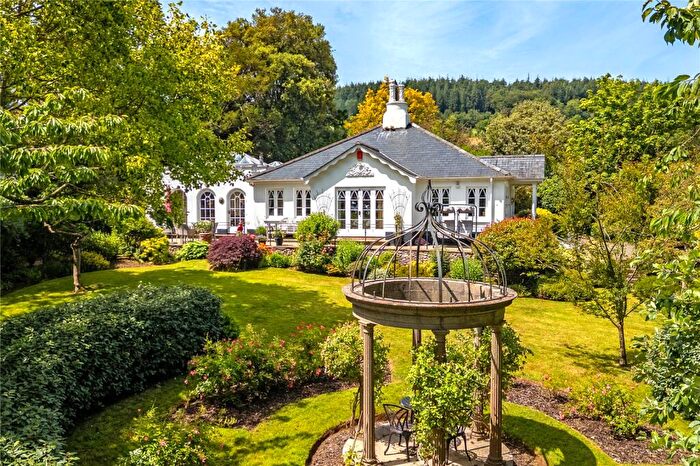
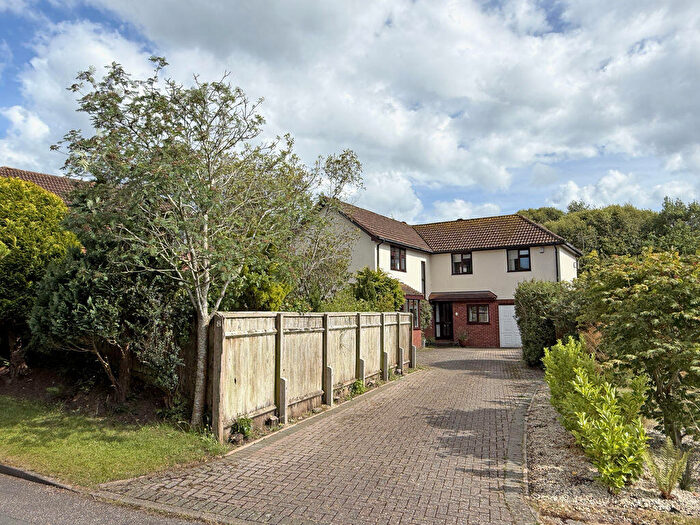
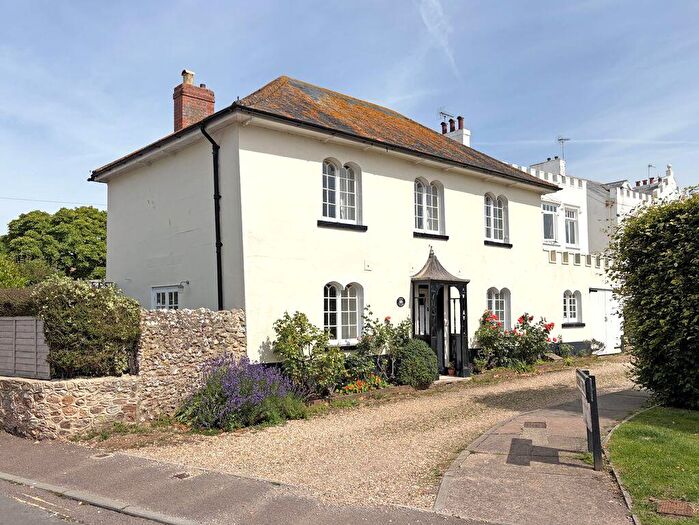
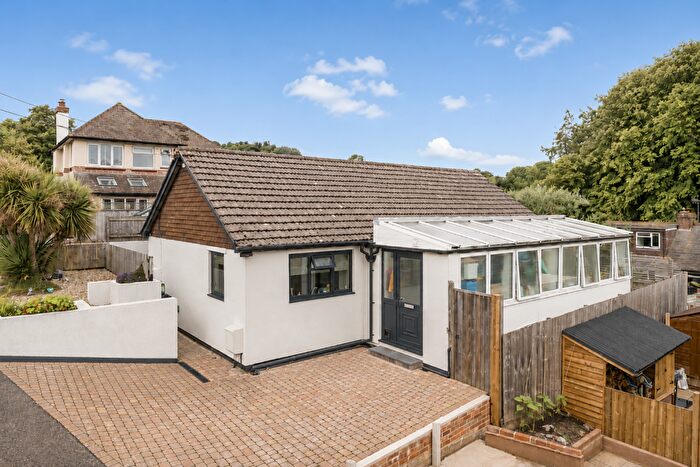
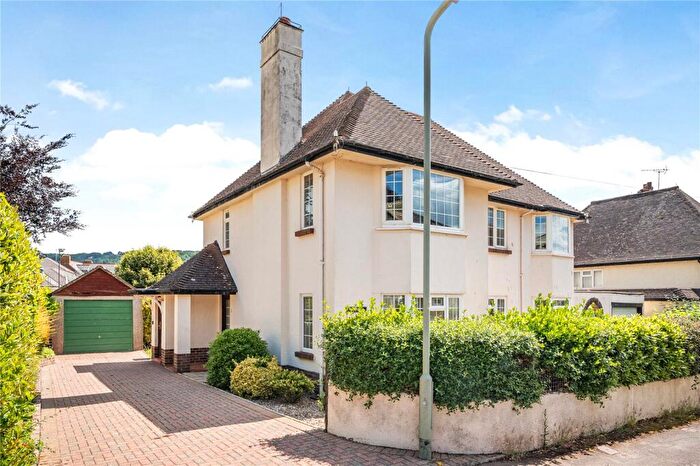
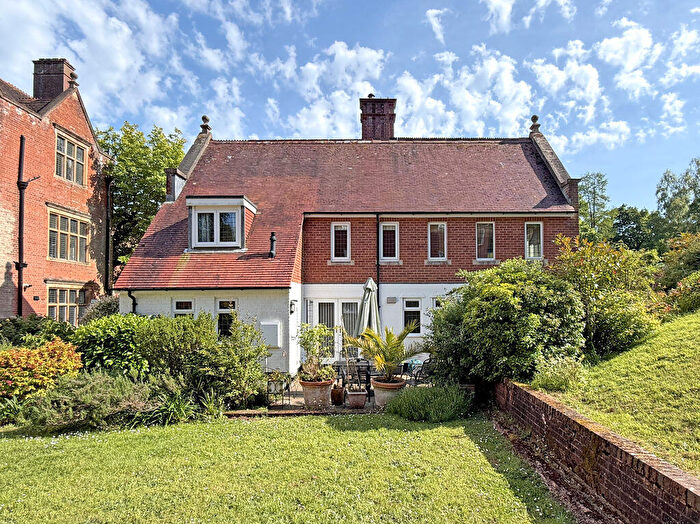
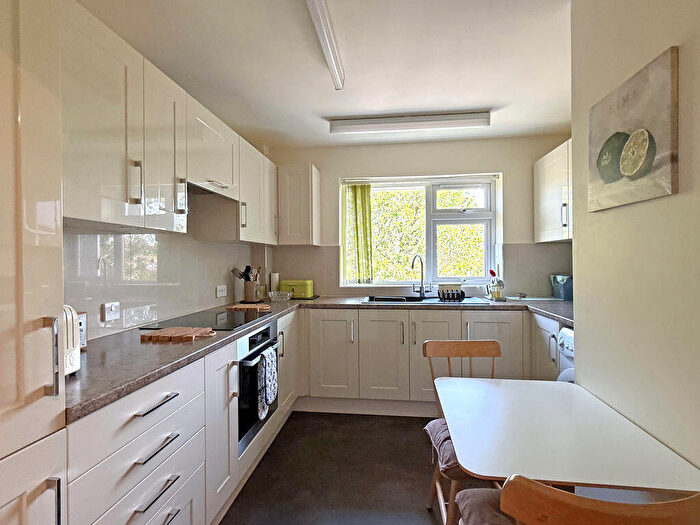
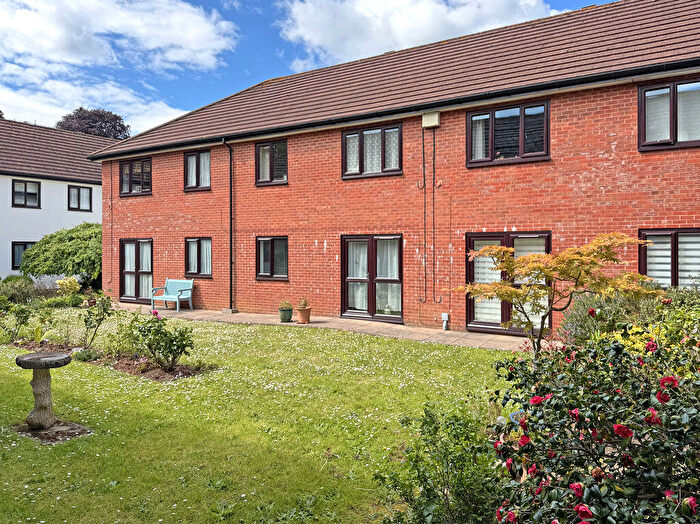
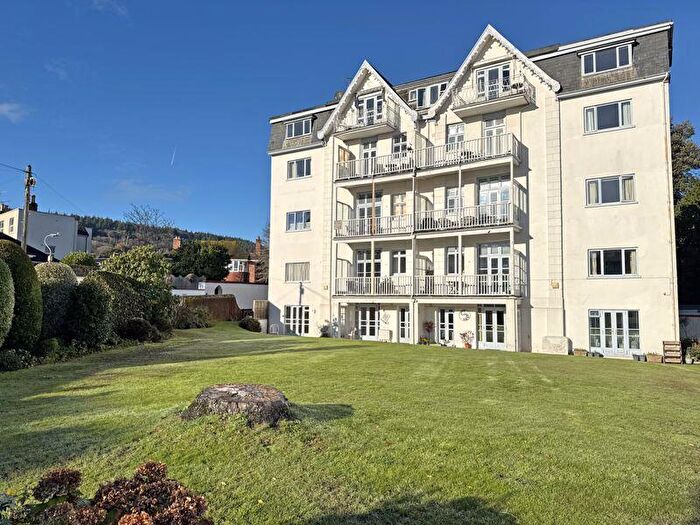
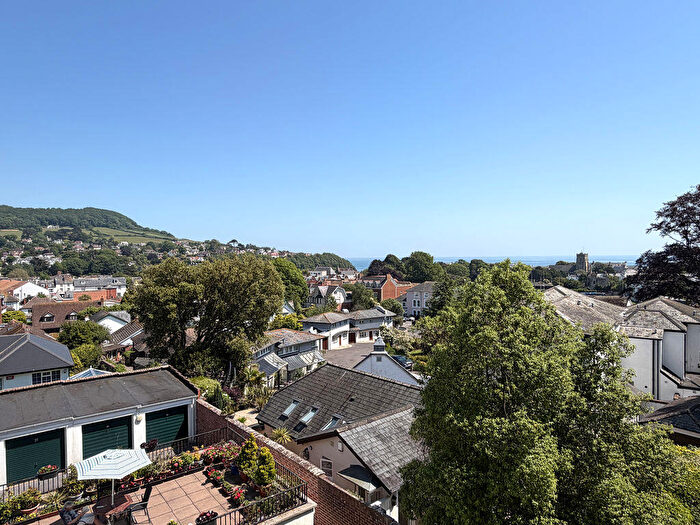
Properties for sale near EX10 8DB, York Street
![]()
If you are looking to sell your house, let it out, or receive a property valuation, an expert can help you.
Click the button below to get started.
Price Paid in York Street, EX10 8DB, Sidmouth Town
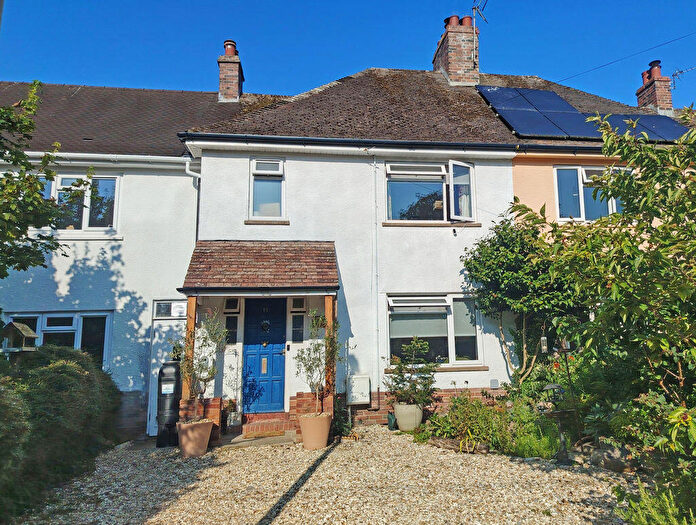
44 York Street, EX10 8DB, Sidmouth Town Sidmouth
Property 44 has been sold 2 times. The last time it was sold was in 28/03/2023 and the sold price was £375,000.00.
This terraced house, sold as a freehold on 28/03/2023, is a 81 sqm semi-detached house with an EPC rating of E.
| Date | Price | Property Type | Tenure | Classification |
|---|---|---|---|---|
| 28/03/2023 | £375,000.00 | Terraced House | freehold | Established Building |
| 24/02/2021 | £300,000.00 | Terraced House | freehold | Established Building |
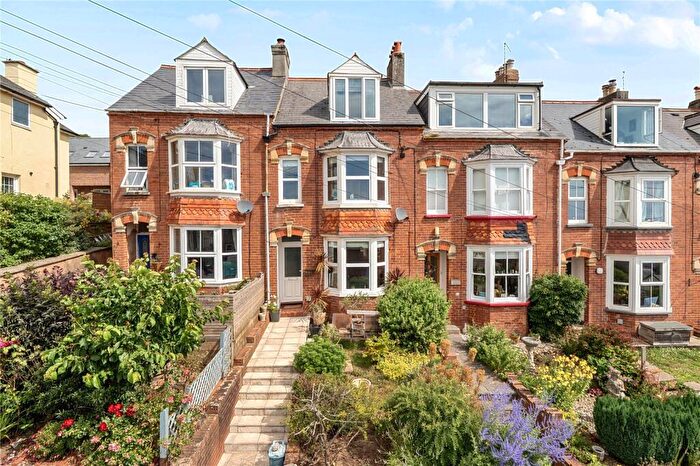
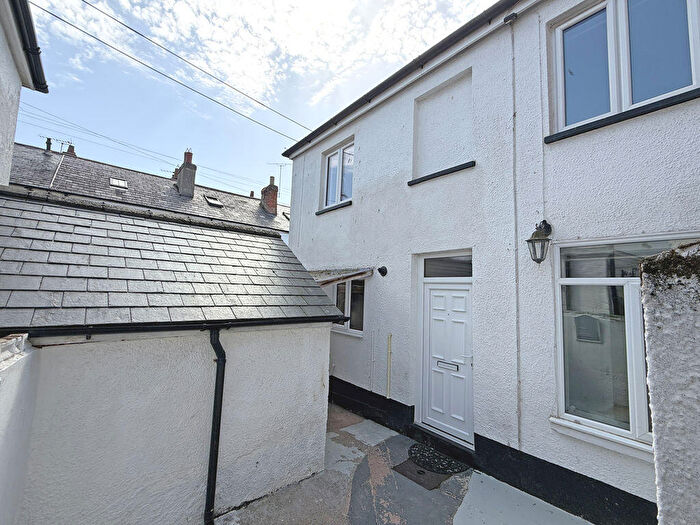
46 York Street, EX10 8DB, Sidmouth Town Sidmouth
Property 46 has been sold 3 times. The last time it was sold was in 13/02/2015 and the sold price was £325,000.00.
This detached house, sold as a freehold on 13/02/2015, is a 75 sqm detached house with an EPC rating of D.
| Date | Price | Property Type | Tenure | Classification |
|---|---|---|---|---|
| 13/02/2015 | £325,000.00 | Detached House | freehold | Established Building |
| 10/06/2010 | £290,000.00 | Terraced House | freehold | Established Building |
| 12/04/2006 | £240,000.00 | Terraced House | freehold | Established Building |
Postcodes in York Street, Sidmouth Town
Navigate through other locations in York Street, Sidmouth Town, Sidmouth to see more property listings for sale or to rent.
Property price trends in EX10 8DB, York Street
According to the latest Land Registry data, the average home in EX10 8DB, York Street sold for £375,000 in 2023. That figure comes from 5 sales logged over the past 17 years.
Prices have continued to climb over the last three years. Compared with 2021, when the typical sale came in around £300,000, that's a rise of roughly 25%.
Zoom out to the past decade for the fuller picture. Back in 2015, homes here averaged £325,000, so the typical sold price has climbed about 15.4% since then, roughly 1.8% a year. Stretch the view to fifteen years and that annual pace edges up closer to 2.7%.
Property Price Paid in EX10 8DB, York Street by Year
The average sold property price by year was:
| Year | Average Sold Price | Price Change |
Sold Properties
|
|---|---|---|---|
| 2023 | £375,000 | 20% |
1 Property |
| 2021 | £300,000 | -8% |
1 Property |
| 2015 | £325,000 | 11% |
1 Property |
| 2010 | £290,000 | 17% |
1 Property |
| 2006 | £240,000 | - |
1 Property |
Property Price per Property Type in EX10 8DB, York Street
Here you can find historic sold price data in order to help with your property search.
The average Property Paid Price for specific property types in the last three years are:
| Property Type | Average Sold Price | Sold Properties |
|---|---|---|
| Terraced House | £375,000.00 | 1 Terraced House |
