
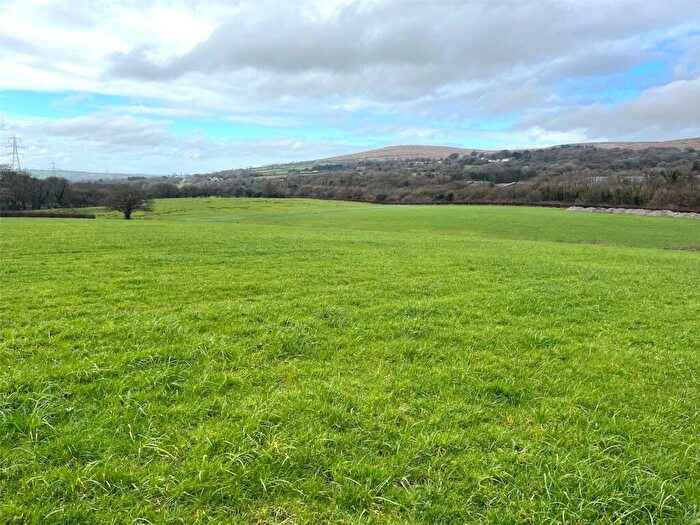
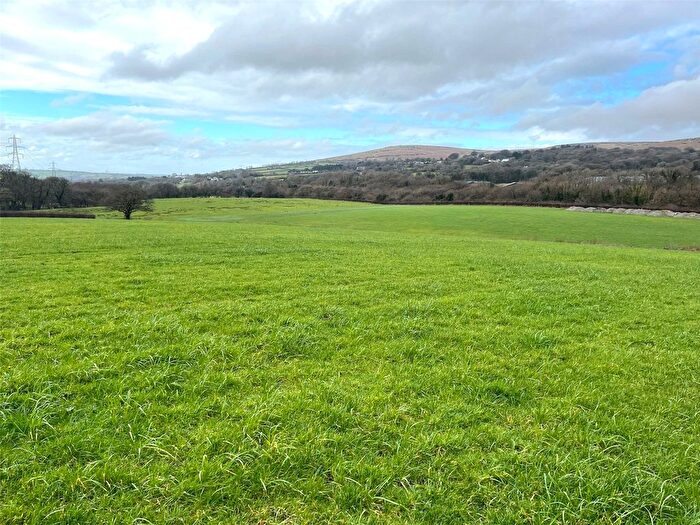
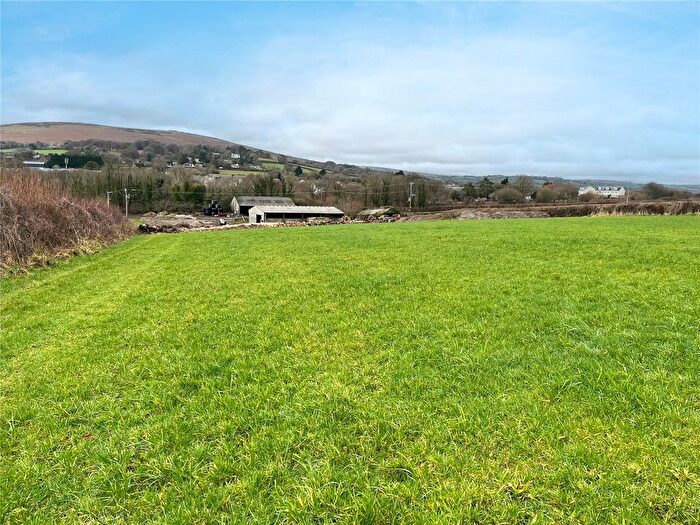
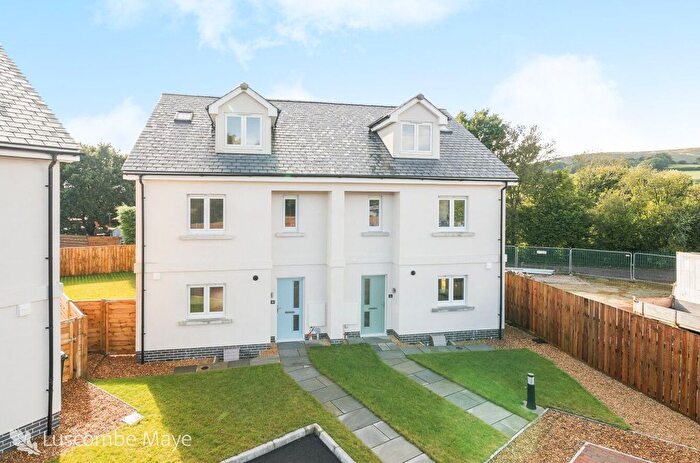
Houses for sale in Erme Valley, South Brent
House Prices in Erme Valley
Properties in Erme Valley have an average house price of £569k and had 4 Property Transactions within the last 3 years¹.
Erme Valley is an area in South Brent, Devon with 99 households², where the most expensive property was sold for £890k.
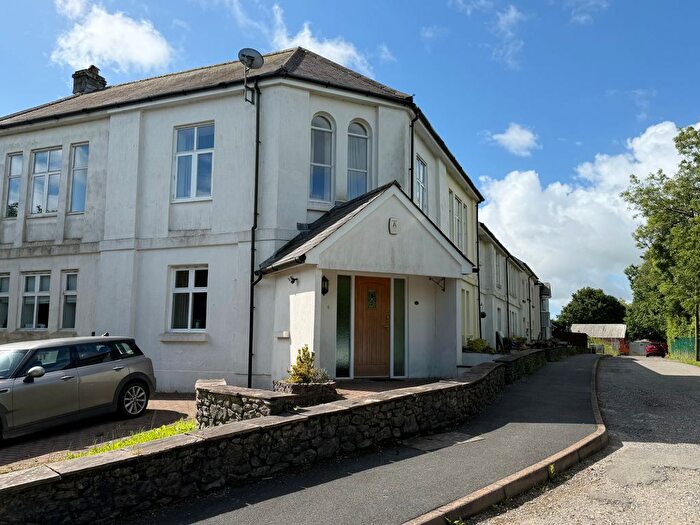
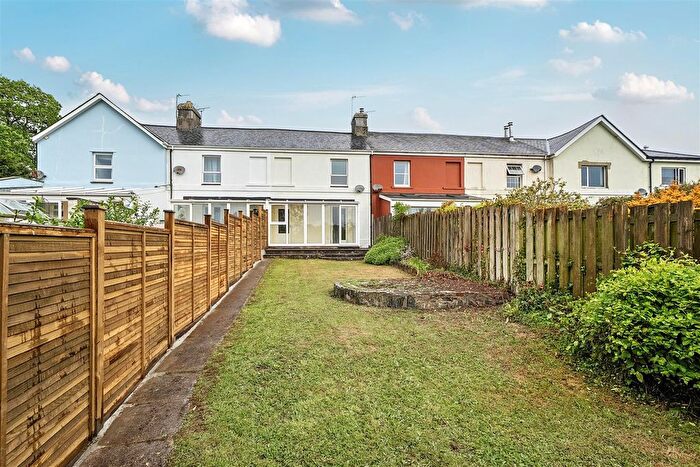
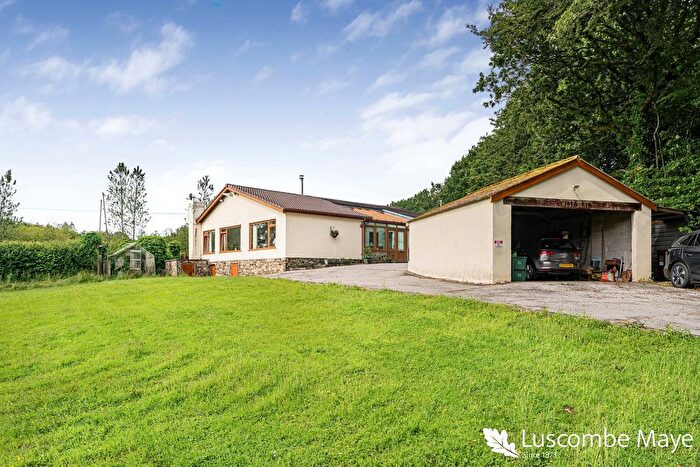
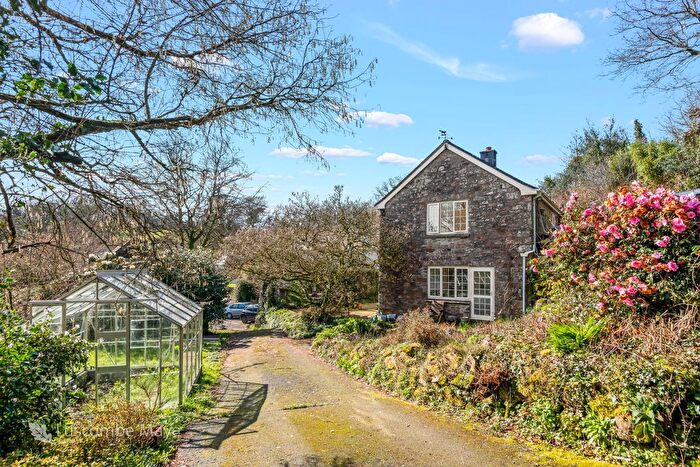
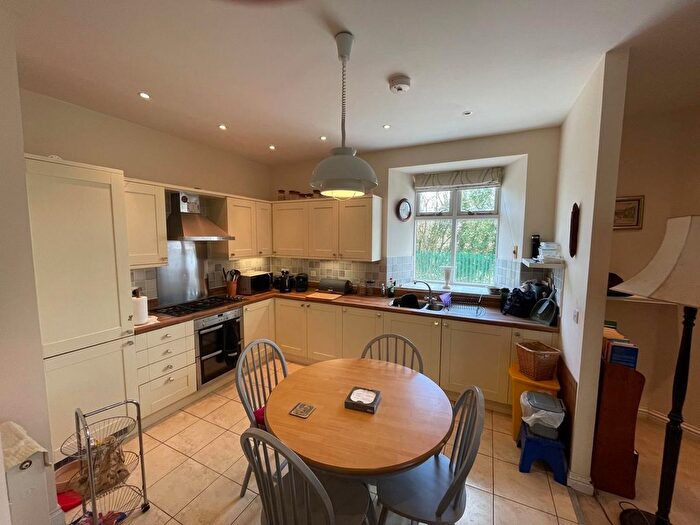
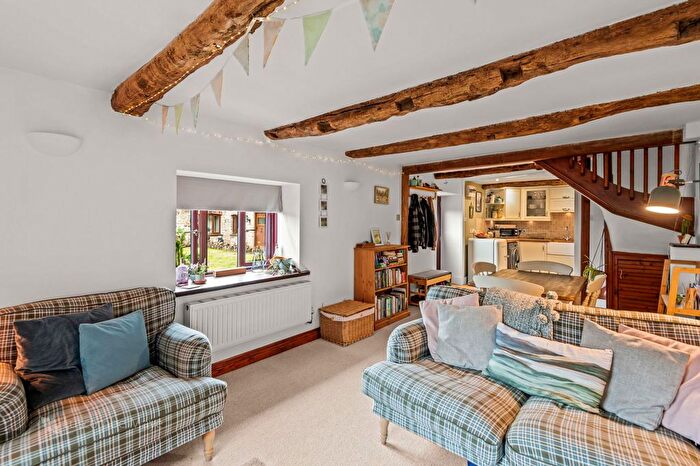
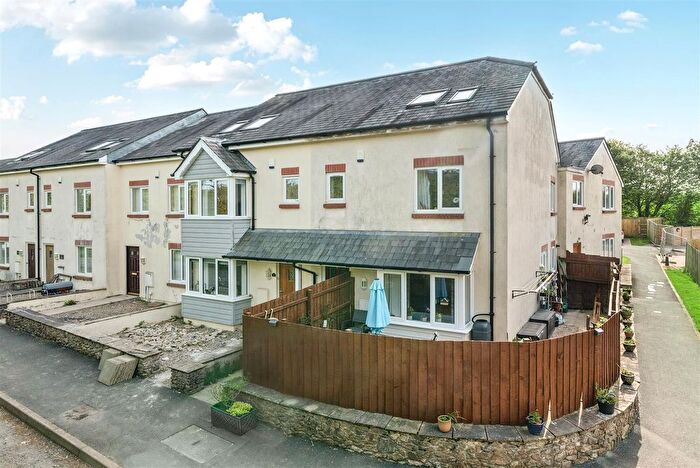
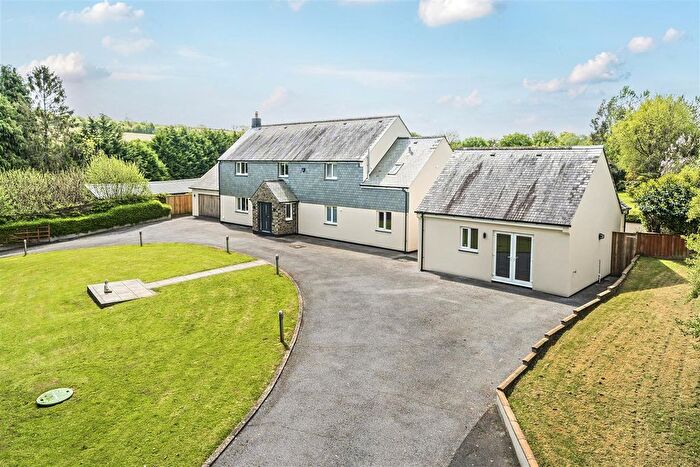
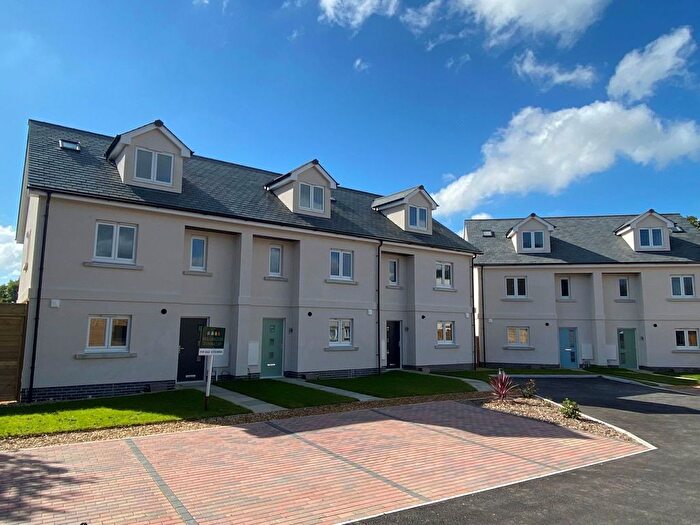
Previously listed properties in Erme Valley
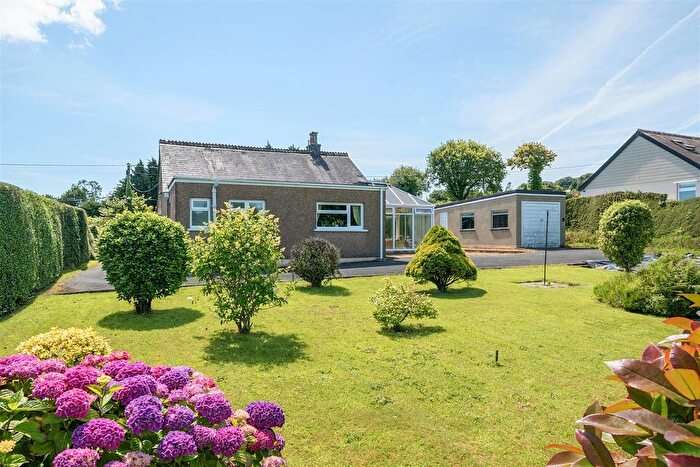
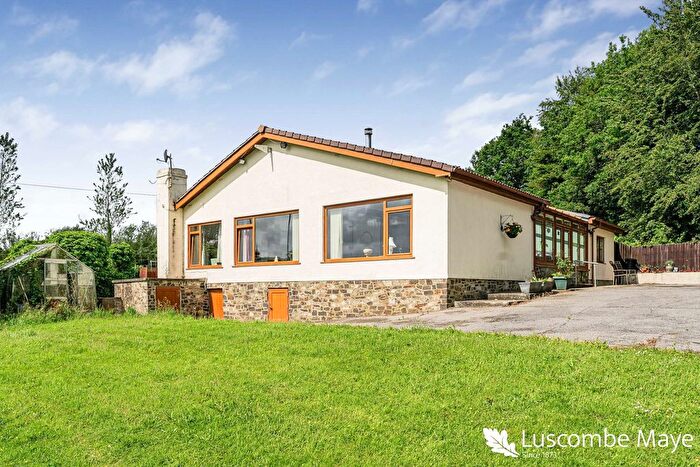
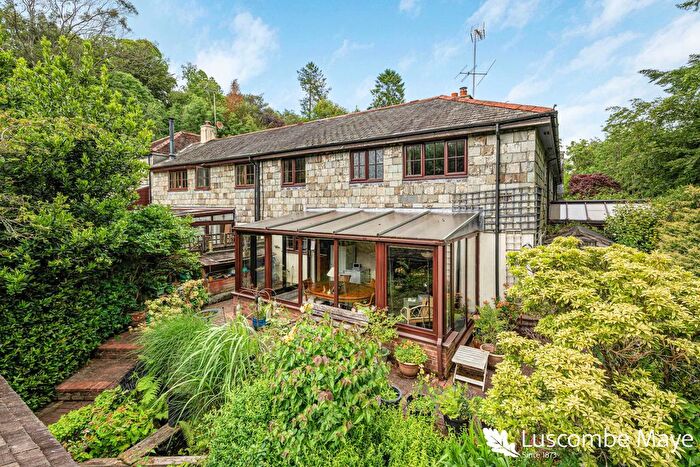
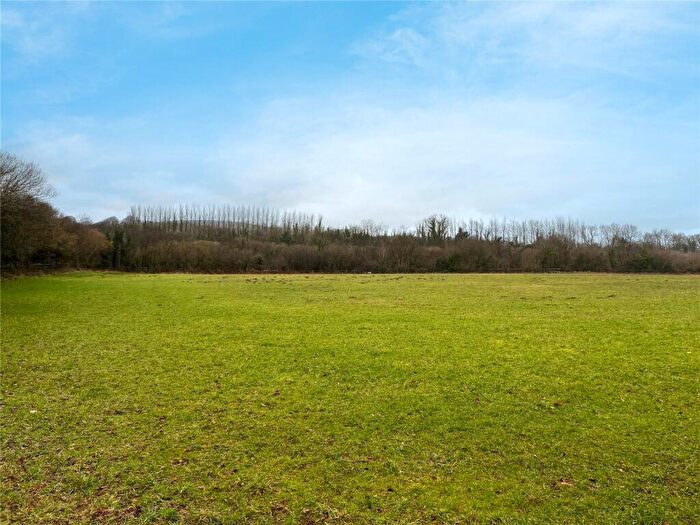
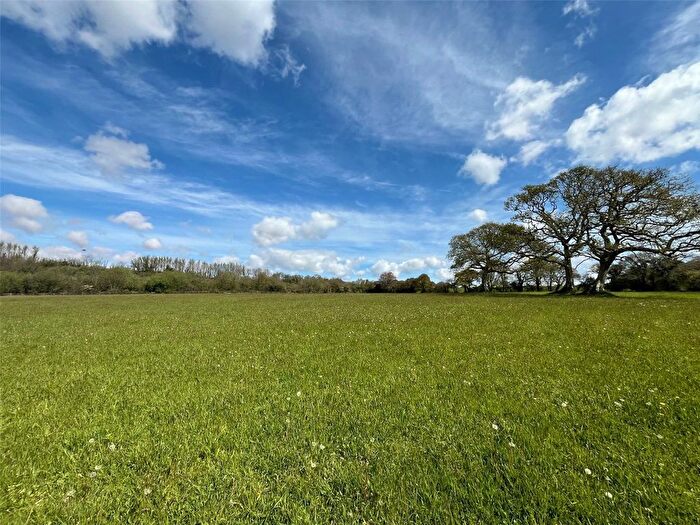
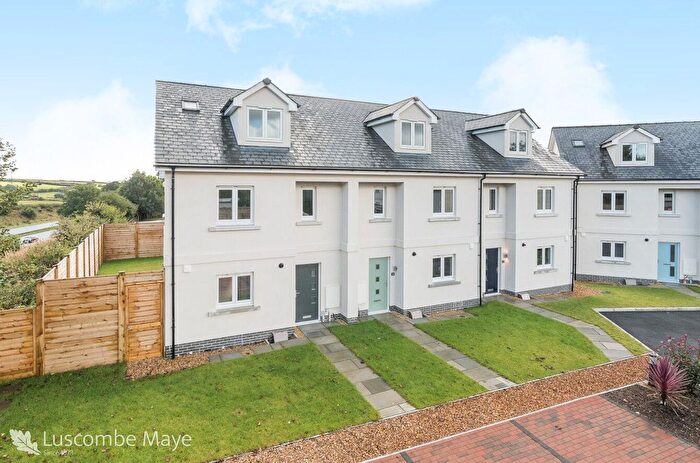
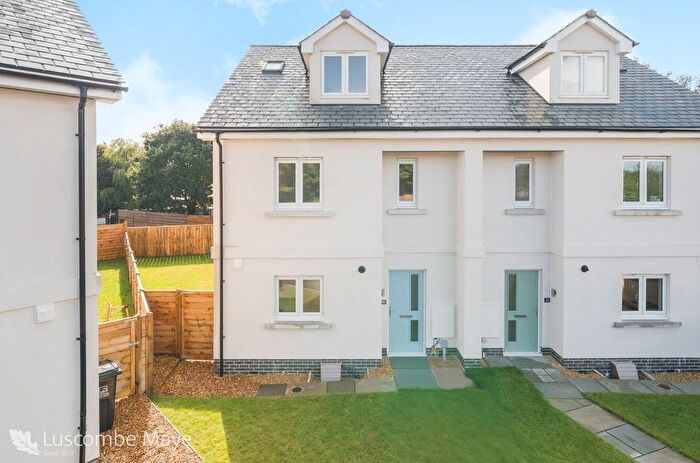
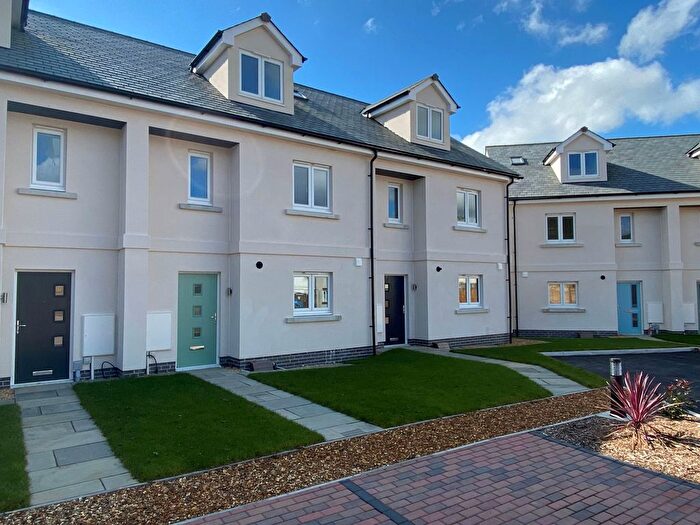
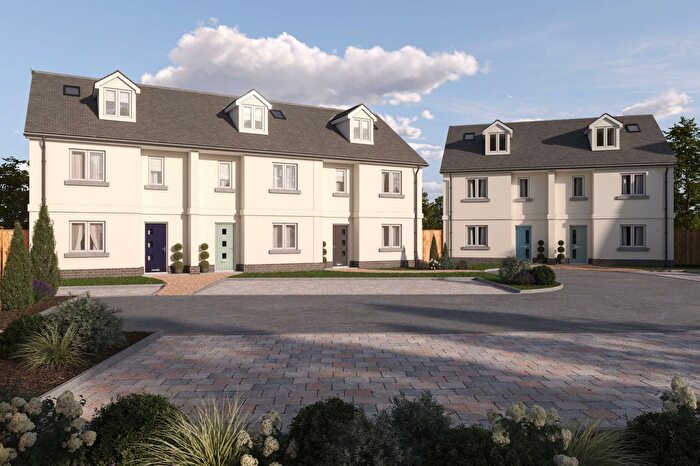
![]()
If you are looking to sell your house, let it out, or receive a property valuation, an expert can help you.
Click the button below to get started.

Roads and Postcodes in Erme Valley
Navigate through our locations to find the location of your next house in Erme Valley, South Brent for sale or to rent.
| Streets | Postcodes |
|---|---|
| Beacon Terrace | TQ10 9HD |
| Shute Lane | TQ10 9HE |
| Station Cottages | TQ10 9HG |
| TQ10 9EP TQ10 9ES TQ10 9HA TQ10 9HB TQ10 9HF TQ10 9HH TQ10 9HJ TQ10 9HL TQ10 9HQ |
Property price trends in Erme Valley
According to the latest Land Registry data, the average home in Erme Valley sold for £569,000 in 2023. That figure comes from 88 sales logged over the past 28 years.
Prices have continued to climb over the last three years. Compared with 2020, when the typical sale came in around £508,666, that's a rise of roughly 11.9%.
Looking back five years, average prices are up about 74.6% since 2018, a gain of around £243,167 in cash terms.
Zoom out to the past decade for the fuller picture. Back in 2013, homes here averaged £286,357, so the typical sold price has climbed about 98.7% since then, roughly 7.1% a year. Stretch the view to fifteen years and that annual pace eases back to about 3.9%.
Frequently asked questions about Erme Valley
What is the average price for a property for sale in Erme Valley?
The average price for a property for sale in Erme Valley is £569,000. This amount is 48% higher than the average price in South Brent. There are 35 property listings for sale in Erme Valley.
Which train stations are available in or near Erme Valley?
Some of the train stations available in or near Erme Valley are Ivybridge, Totnes and Paignton.
Property Price Paid in Erme Valley by Year
The average sold property price by year was:
| Year | Average Sold Price | Price Change |
Sold Properties
|
|---|---|---|---|
| 2023 | £569,000 | -6% |
4 Properties |
| 2022 | £600,666 | 10% |
3 Properties |
| 2021 | £542,500 | 6% |
4 Properties |
| 2020 | £508,666 | 36% |
3 Properties |
| 2018 | £325,833 | 43% |
3 Properties |
| 2017 | £185,000 | -42% |
1 Property |
| 2016 | £261,833 | 30% |
3 Properties |
| 2015 | £184,000 | -21% |
1 Property |
| 2014 | £222,750 | -29% |
2 Properties |
| 2013 | £286,357 | -27% |
7 Properties |
Property Price per Property Type in Erme Valley
Here you can find historic sold price data in order to help with your property search.
The average Property Paid Price for specific property types in the last three years are:
| Property Type | Average Sold Price | Sold Properties |
|---|---|---|
| Terraced House | £280,000.00 | 2 Terraced Houses |
| Detached House | £858,000.00 | 2 Detached Houses |
