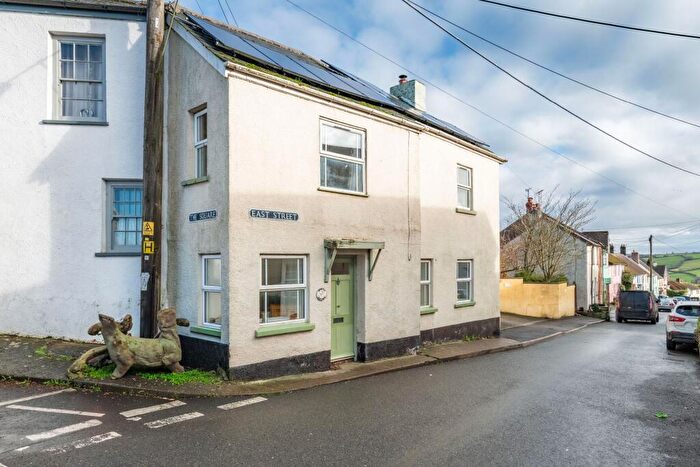
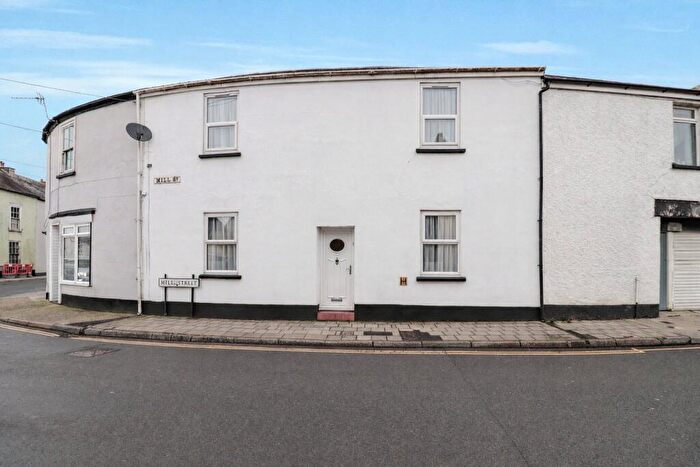
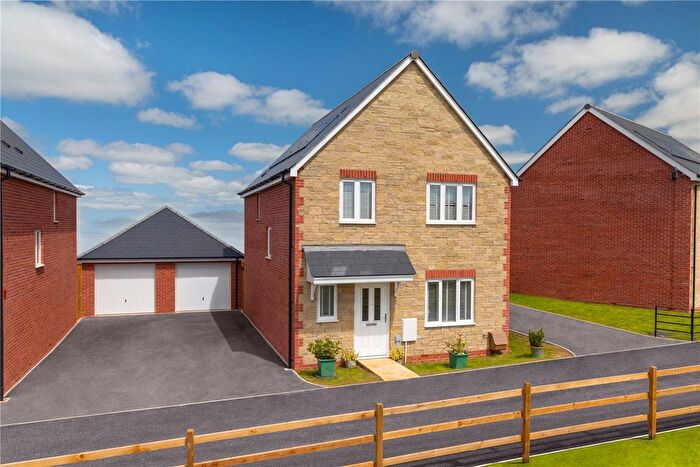
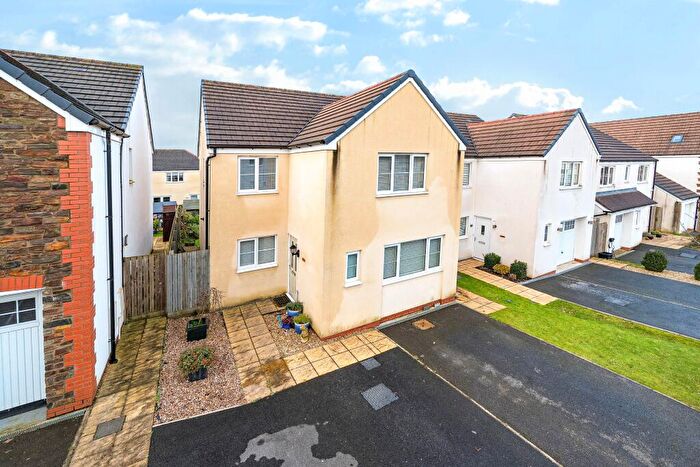
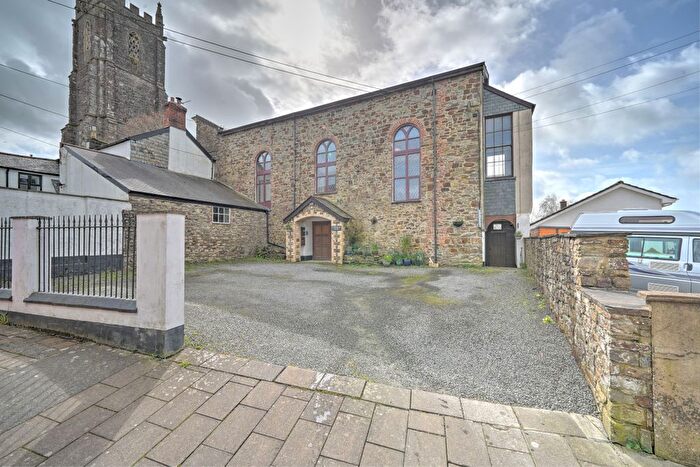
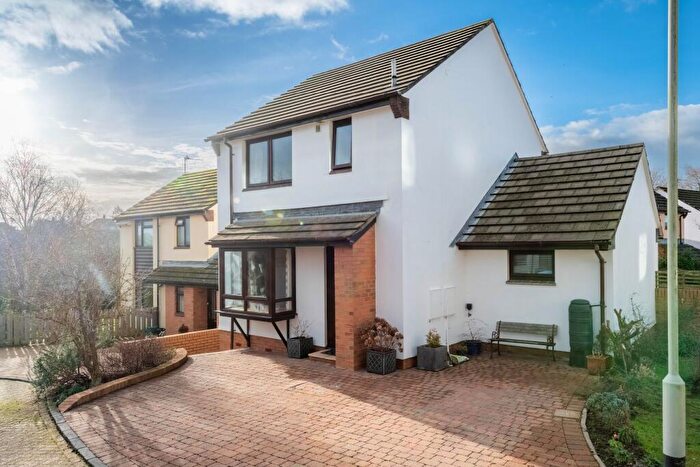
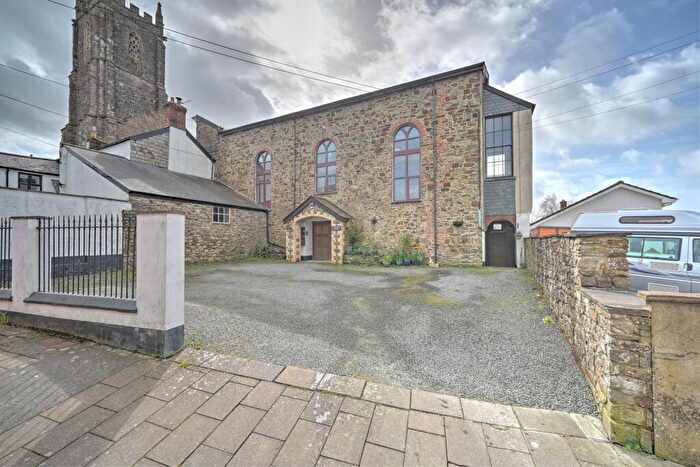
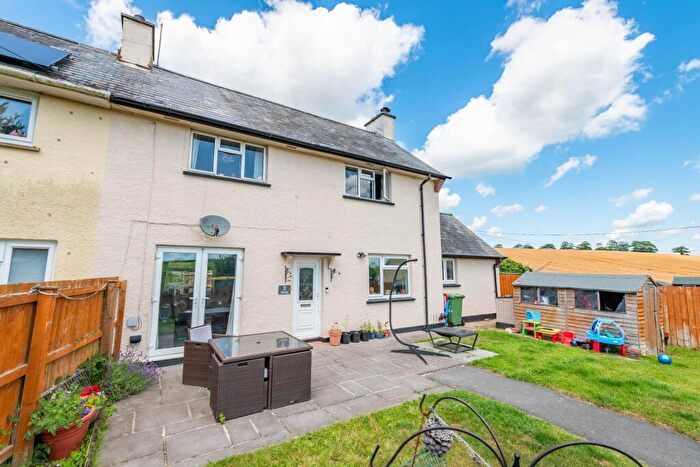
Houses for sale & to rent in North Molton, South Molton
House Prices in North Molton
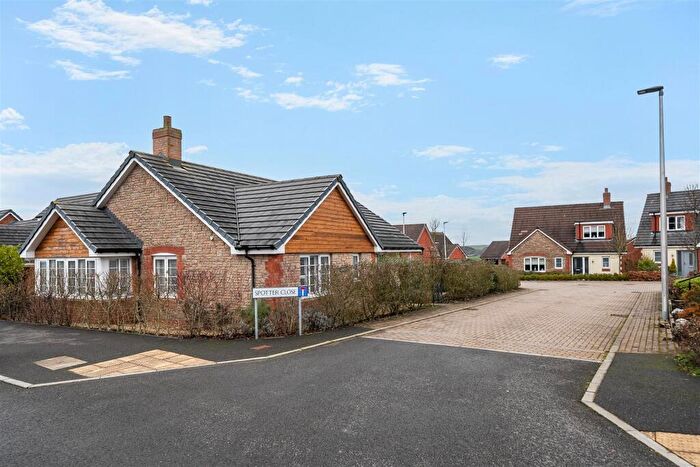
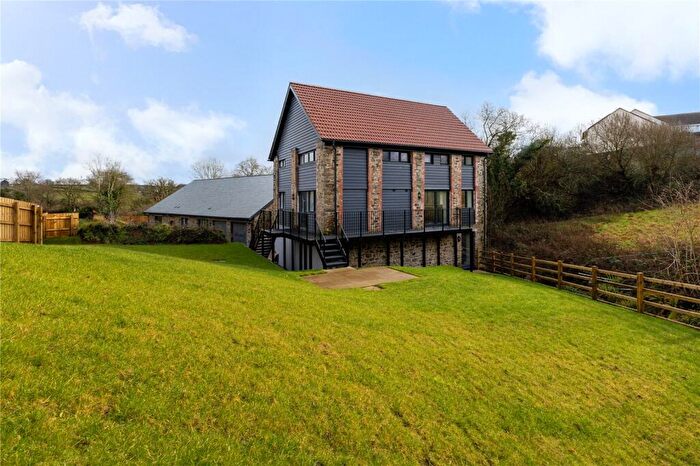
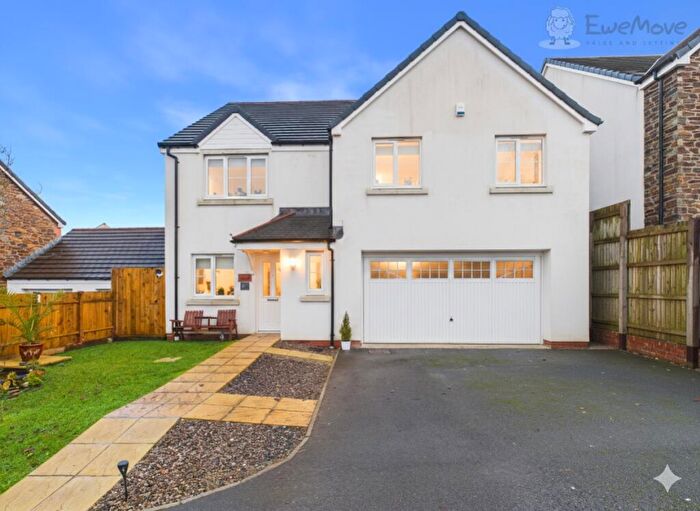
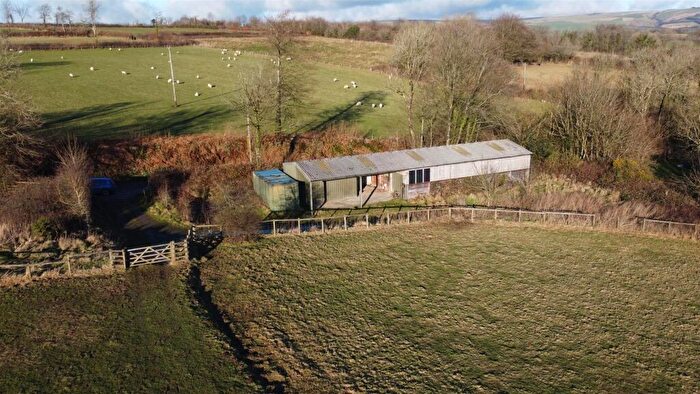
Properties in North Molton have an average house price of £305,320.00 and had 32 Property Transactions within the last 3 years¹.
North Molton is an area in South Molton, Devon with 555 households², where the most expensive property was sold for £615,000.00.
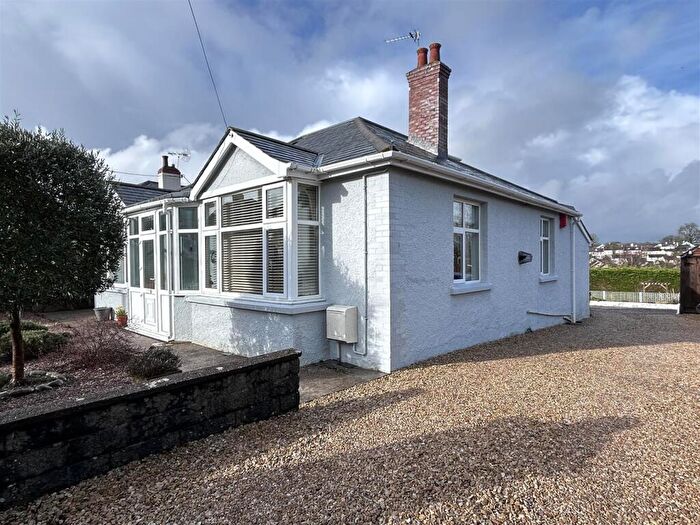
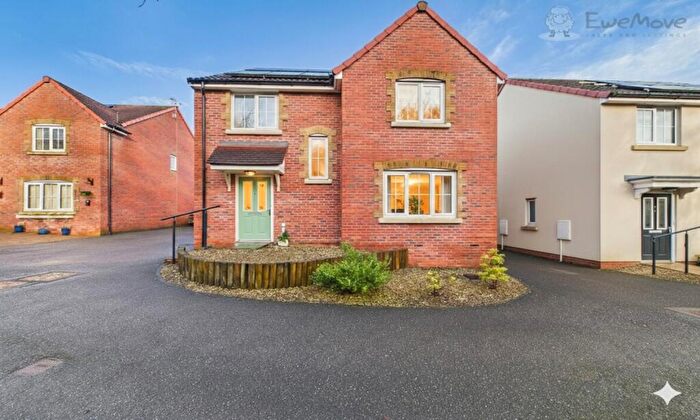
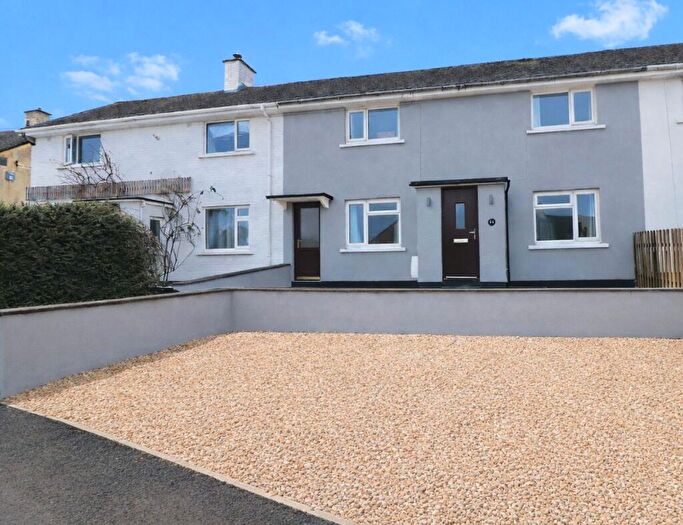
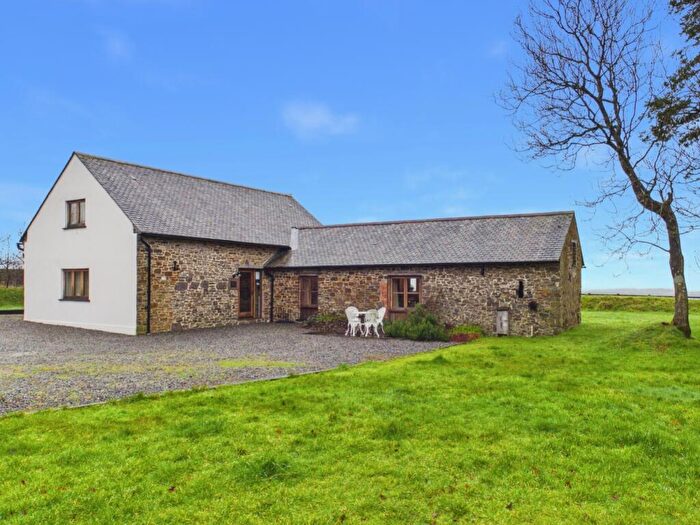
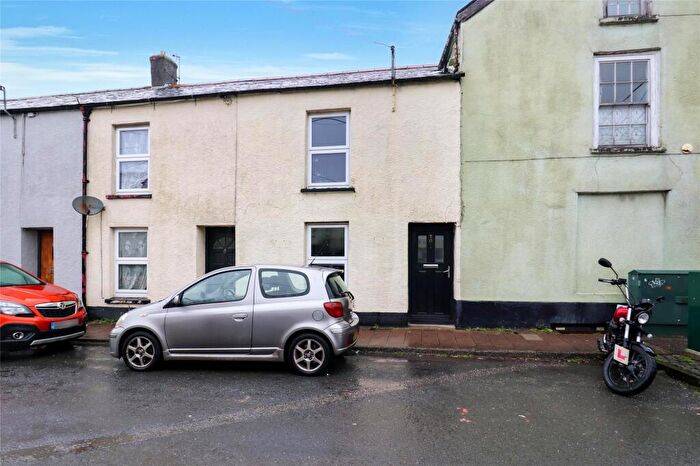
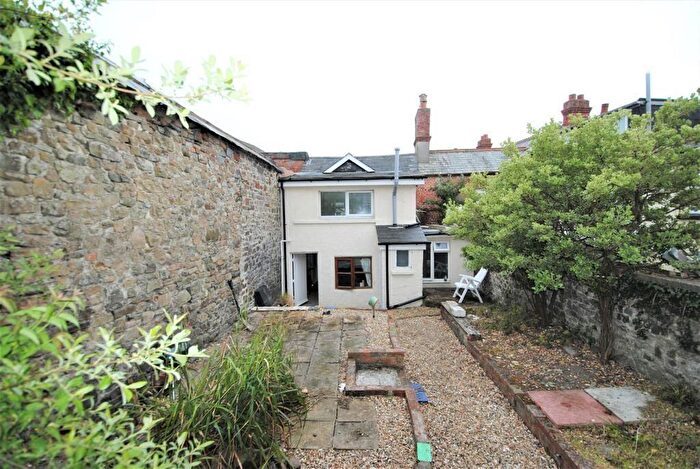
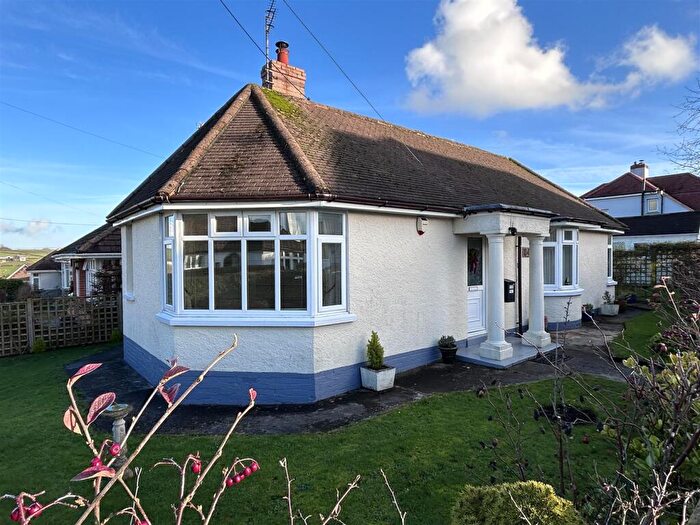
Properties for sale in North Molton
Roads and Postcodes in North Molton
Navigate through our locations to find the location of your next house in North Molton, South Molton for sale or to rent.
| Streets | Postcodes |
|---|---|
| Back Lane | EX36 3HW |
| Bottreaux Mill | EX36 3PR EX36 3PS EX36 3PT |
| Bridge Site | EX36 3JN |
| Broad Close | EX36 3JD |
| Dure Lane | EX36 3JE |
| East Street | EX36 3HR EX36 3HT EX36 3HU EX36 3HX EX36 3JF EX36 3JJ EX36 3JQ |
| Fore Street | EX36 3HL |
| Heasley Mill | EX36 3LE EX36 3LA EX36 3LF EX36 3LG EX36 3LQ |
| Jubilee Gardens | EX36 3HS |
| Mole Cottages | EX36 3JL |
| Molland | EX36 3ND EX36 3NG EX36 3NE EX36 3NH EX36 3NJ EX36 3NL EX36 3NP EX36 3NQ |
| Oakford Close | EX36 3HF |
| Oakford Villas | EX36 3HJ EX36 3HN |
| Riverside | EX36 3JH |
| Roberts Field | EX36 3HD |
| Sandyway | EX36 3LX EX36 3LT |
| Stonemans Cottages | EX36 3JG |
| The Square | EX36 3HP |
| Thorne Cottages | EX36 3JW |
| Winsor Meadow | EX36 3FJ |
| EX36 3EJ EX36 3EP EX36 3ER EX36 3ET EX36 3EU EX36 3EW EX36 3HA EX36 3HG EX36 3HQ EX36 3JP EX36 3JS EX36 3JU EX36 3LP EX36 3LR EX36 3LS EX36 3NT EX36 3PN EX36 3DE EX36 3EL EX36 3EN EX36 3ES EX36 3EX EX36 3EY EX36 3EZ EX36 3HH EX36 3JR EX36 3JT EX36 3JX EX36 3JY EX36 3JZ EX36 3LN EX36 3LW |
Transport near North Molton
-
Umberleigh Station
-
King's Nympton Station
-
Portsmouth Arms Station
-
Chapelton Station
-
Eggesford Station
-
Barnstaple Station
-
Lapford Station
- FAQ
- Price Paid By Year
- Property Type Price
Frequently asked questions about North Molton
What is the average price for a property for sale in North Molton?
The average price for a property for sale in North Molton is £305,320. This amount is 0.85% higher than the average price in South Molton. There are 665 property listings for sale in North Molton.
What streets have the most expensive properties for sale in North Molton?
The streets with the most expensive properties for sale in North Molton are Bottreaux Mill at an average of £615,000, Back Lane at an average of £362,500 and East Street at an average of £336,000.
What streets have the most affordable properties for sale in North Molton?
The streets with the most affordable properties for sale in North Molton are Winsor Meadow at an average of £177,022, Fore Street at an average of £210,000 and Jubilee Gardens at an average of £215,000.
Which train stations are available in or near North Molton?
Some of the train stations available in or near North Molton are Umberleigh, King's Nympton and Portsmouth Arms.
Property Price Paid in North Molton by Year
The average sold property price by year was:
| Year | Average Sold Price | Price Change |
Sold Properties
|
|---|---|---|---|
| 2025 | £328,888 | 10% |
9 Properties |
| 2024 | £296,355 | 0,2% |
12 Properties |
| 2023 | £295,818 | -34% |
11 Properties |
| 2022 | £396,924 | 27% |
14 Properties |
| 2021 | £291,647 | -1% |
22 Properties |
| 2020 | £294,321 | 3% |
14 Properties |
| 2019 | £285,787 | 16% |
12 Properties |
| 2018 | £240,988 | 2% |
22 Properties |
| 2017 | £237,130 | 14% |
20 Properties |
| 2016 | £203,287 | -34% |
12 Properties |
| 2015 | £272,880 | -6% |
13 Properties |
| 2014 | £290,445 | 10% |
23 Properties |
| 2013 | £262,563 | 22% |
15 Properties |
| 2012 | £205,665 | -8% |
6 Properties |
| 2011 | £221,950 | -14% |
5 Properties |
| 2010 | £253,428 | 16% |
14 Properties |
| 2009 | £213,200 | -35% |
10 Properties |
| 2008 | £287,681 | -8% |
11 Properties |
| 2007 | £310,270 | 22% |
20 Properties |
| 2006 | £242,962 | 4% |
16 Properties |
| 2005 | £234,300 | 7% |
10 Properties |
| 2004 | £219,062 | 24% |
17 Properties |
| 2003 | £165,723 | 10% |
13 Properties |
| 2002 | £148,971 | 4% |
16 Properties |
| 2001 | £143,383 | 6% |
15 Properties |
| 2000 | £134,855 | 20% |
18 Properties |
| 1999 | £108,075 | 25% |
18 Properties |
| 1998 | £80,873 | 16% |
18 Properties |
| 1997 | £68,310 | 19% |
25 Properties |
| 1996 | £55,392 | -8% |
14 Properties |
| 1995 | £59,839 | - |
11 Properties |
Property Price per Property Type in North Molton
Here you can find historic sold price data in order to help with your property search.
The average Property Paid Price for specific property types in the last three years are:
| Property Type | Average Sold Price | Sold Properties |
|---|---|---|
| Semi Detached House | £329,687.00 | 8 Semi Detached Houses |
| Detached House | £350,000.00 | 14 Detached Houses |
| Terraced House | £237,966.00 | 9 Terraced Houses |
| Flat | £91,068.00 | 1 Flat |

