
Houses for sale in Bishops Nympton, Tiverton
House Prices in Bishops Nympton
Properties in Bishops Nympton have an average house price of £398k and had 7 Property Transactions within the last 3 years¹.
Bishops Nympton is an area in Tiverton, Devon with 84 households², where the most expensive property was sold for £695k.
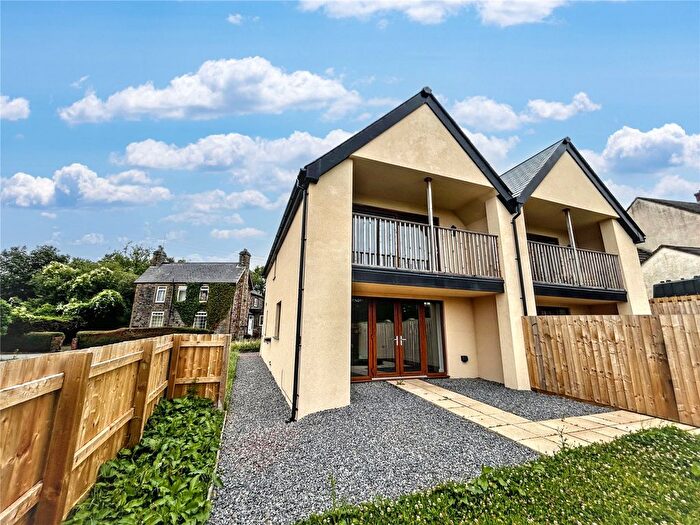
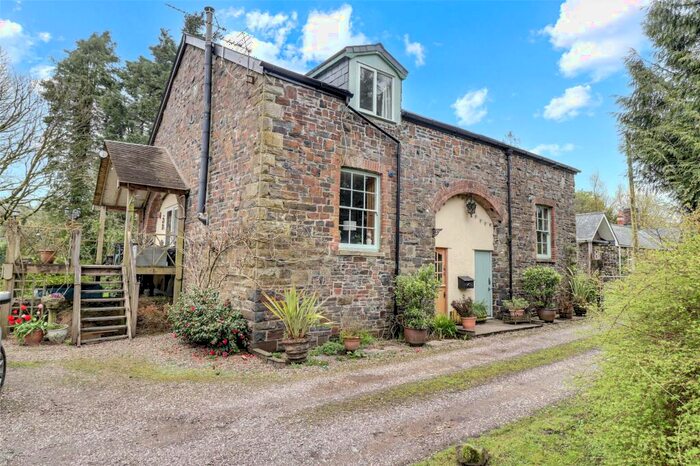
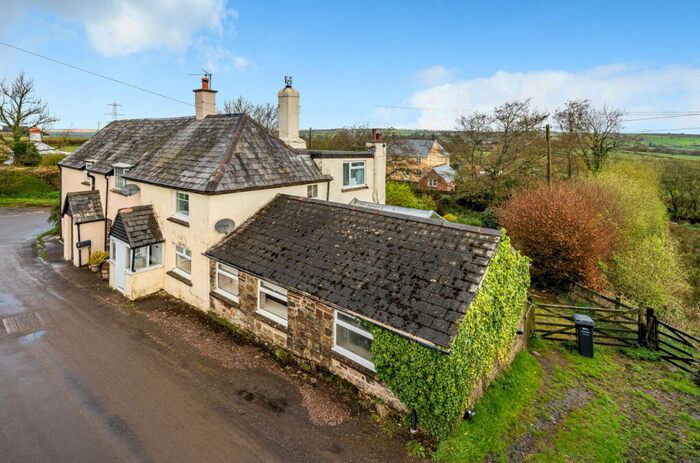
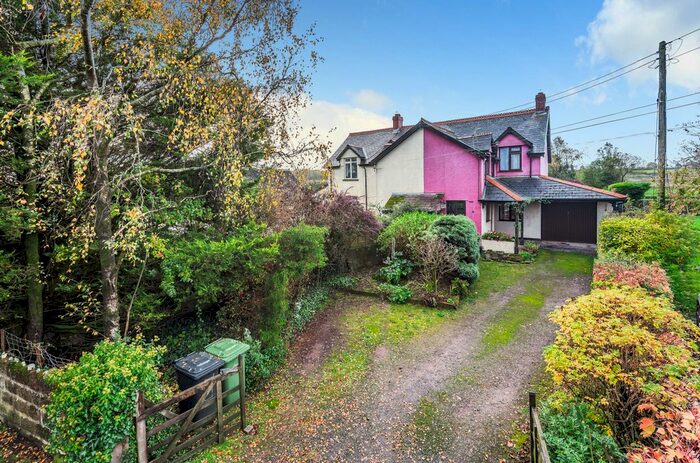
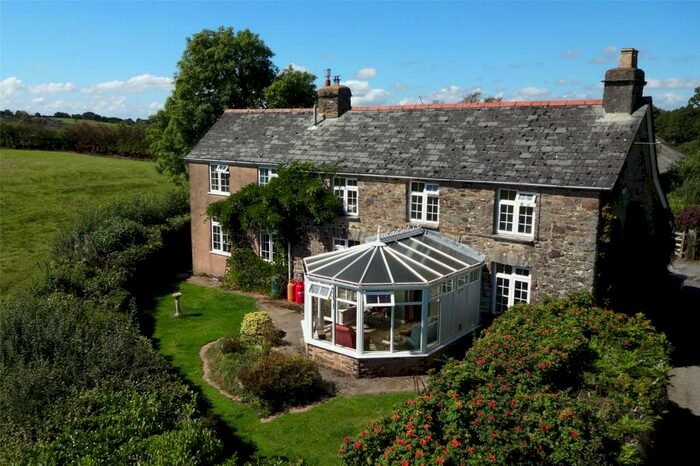
Properties for sale in Bishops Nympton
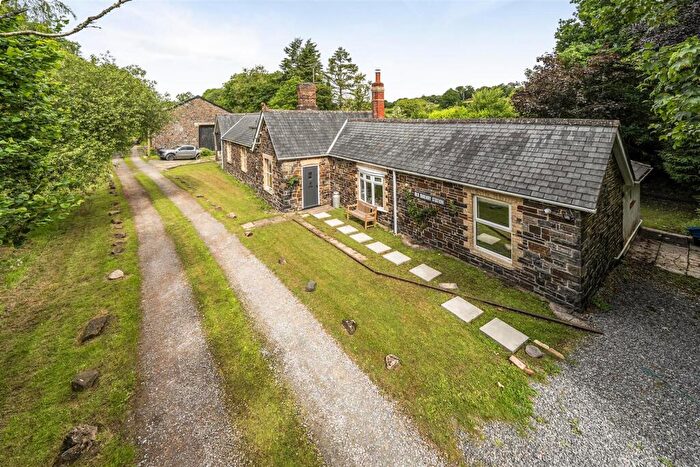
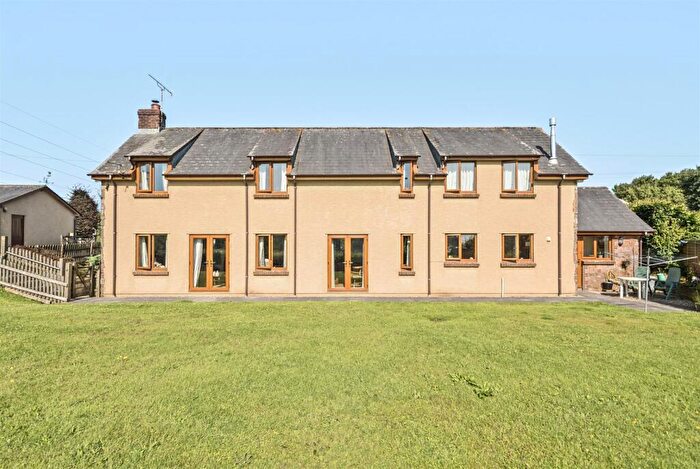
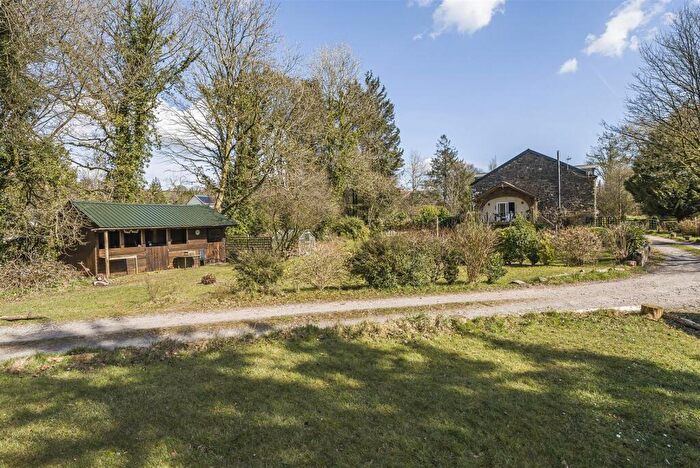
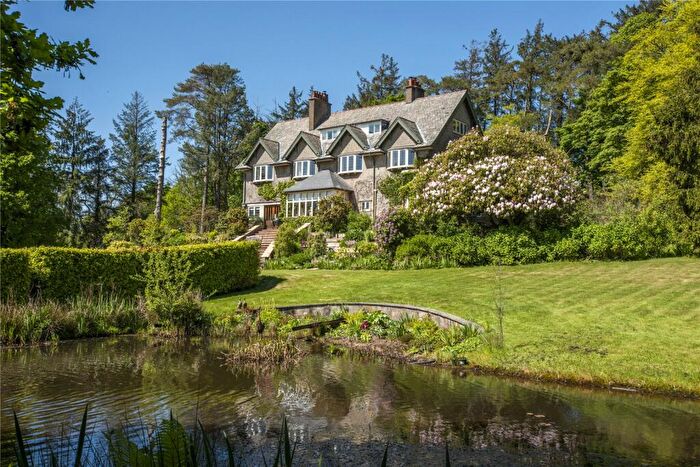
Previously listed properties in Bishops Nympton
![]()
If you are looking to sell your house, let it out, or receive a property valuation, an expert can help you.
Click the button below to get started.
Roads and Postcodes in Bishops Nympton
Navigate through our locations to find the location of your next house in Bishops Nympton, Tiverton for sale or to rent.
| Streets | Postcodes |
|---|---|
| EX16 9JF EX16 9JJ EX16 9JL EX16 9JN EX16 9JP EX16 9JS EX16 9JT EX16 8EJ EX16 9HA EX16 9JR EX16 9JX |
Property price trends in Bishops Nympton
According to the latest Land Registry data, the average home in Bishops Nympton sold for £367,000 in 2026. That figure comes from 73 sales logged over the past 31 years.
Prices have continued to climb over the last three years. Compared with 2023, when the typical sale came in around £312,000, that's a rise of roughly 17.6%.
Looking back five years, average prices are up about 17.8% since 2021, a gain of around £55,333 in cash terms.
Zoom out to the past decade for the fuller picture. Back in 2016, homes here averaged £265,142, so the typical sold price has climbed about 38.4% since then, roughly 3.3% a year. Stretch the view to fifteen years and that annual pace eases back to about -4.8%.
Frequently asked questions about Bishops Nympton
What is the average price for a property for sale in Bishops Nympton?
The average price for a property for sale in Bishops Nympton is £398,000. This amount is 22% higher than the average price in Tiverton. There are 13 property listings for sale in Bishops Nympton.
Which train stations are available in or near Bishops Nympton?
Some of the train stations available in or near Bishops Nympton are Tiverton Parkway, King's Nympton and Lapford.
Property Price Paid in Bishops Nympton by Year
The average sold property price by year was:
| Year | Average Sold Price | Price Change |
Sold Properties
|
|---|---|---|---|
| 2019 | £442,500 | 37% |
2 Properties |
| 2026 | £367,000 | 3% |
1 Property |
| 2025 | £355,000 | -23% |
1 Property |
| 2024 | £438,000 | 29% |
4 Properties |
| 2023 | £312,000 | -11% |
1 Property |
| 2022 | £345,000 | 10% |
1 Property |
| 2021 | £311,666.67 | -31% |
6 Properties |
| 2020 | £407,500 | -9% |
2 Properties |
| 2018 | £276,666 | -31% |
3 Properties |
| 2017 | £363,750 | 27% |
2 Properties |
Property Price per Property Type in Bishops Nympton
Here you can find historic sold price data in order to help with your property search.
The average Property Paid Price for specific property types in the last three years are:
| Property Type | Average Sold Price | Sold Properties |
|---|---|---|
| Semi Detached House | £387,000.00 | 1 Semi Detached House |
| Terraced House | £361,000.00 | 2 Terraced Houses |
| Detached House | £419,250.00 | 4 Detached Houses |
