
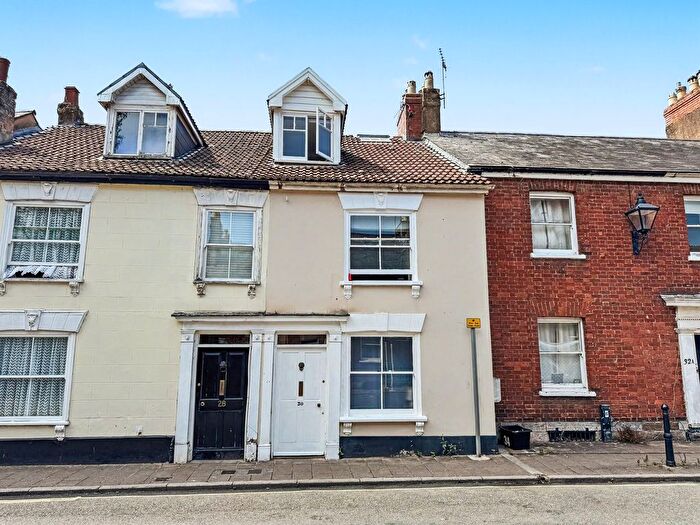
Houses for sale in Tiverton, Devon
House Prices in Tiverton
Properties in Tiverton have an average house price of £327k and had 1,261 Property Transactions within the last 3 years.¹
Tiverton is an area in Devon with 14,610 households², where the most expensive property was sold for £3.15M.
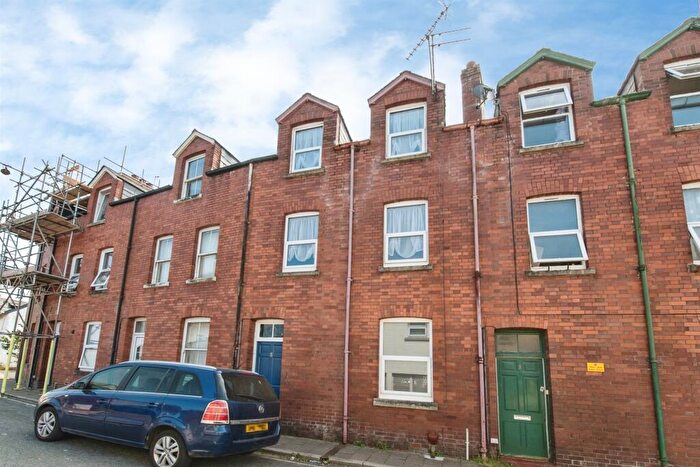
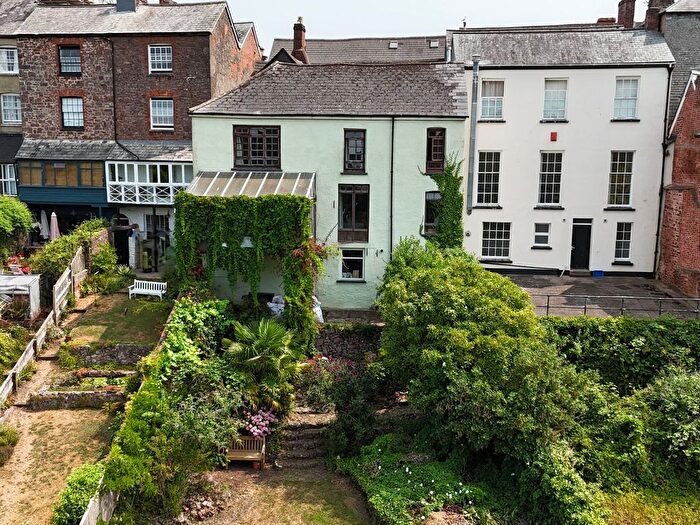
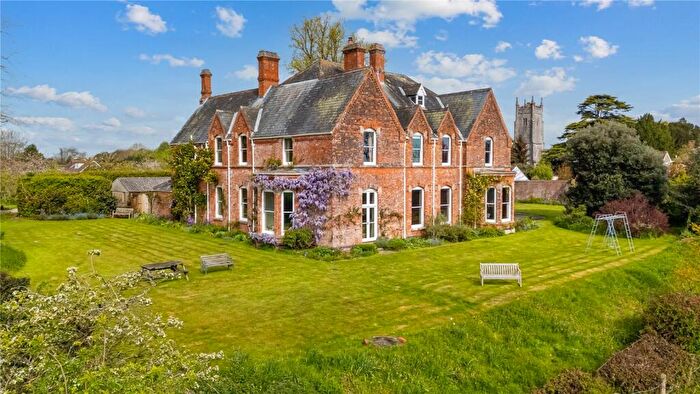
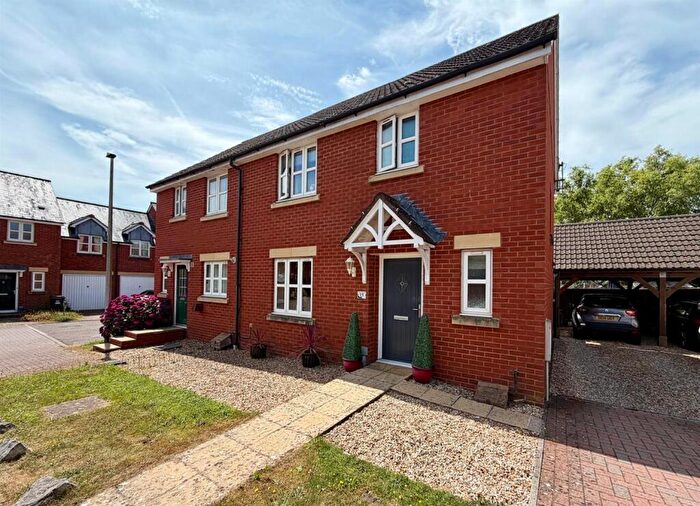
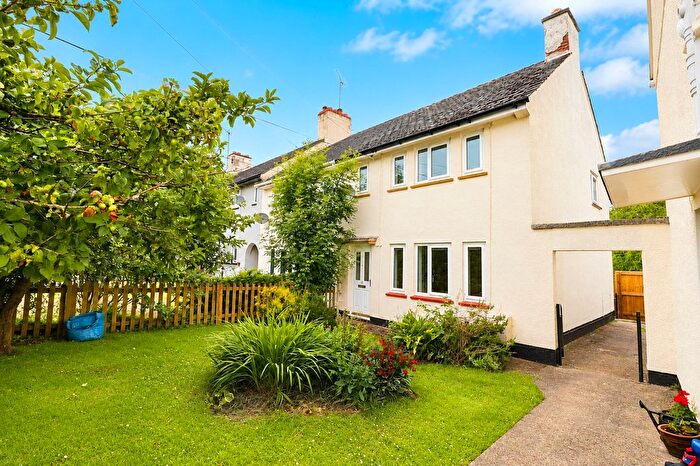
Properties for sale in Tiverton
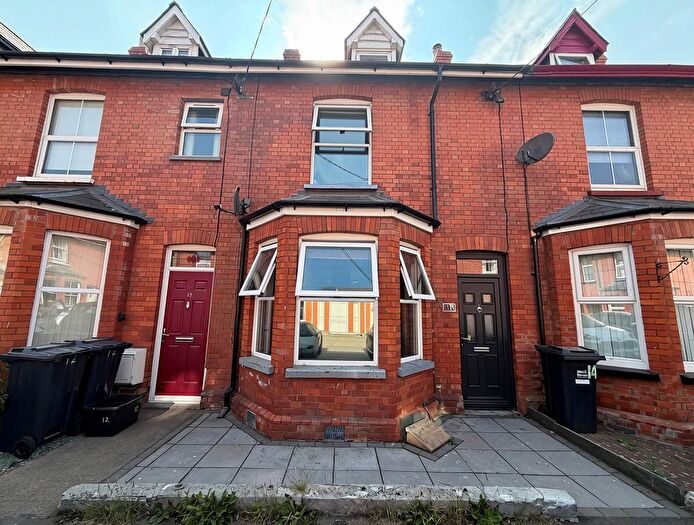
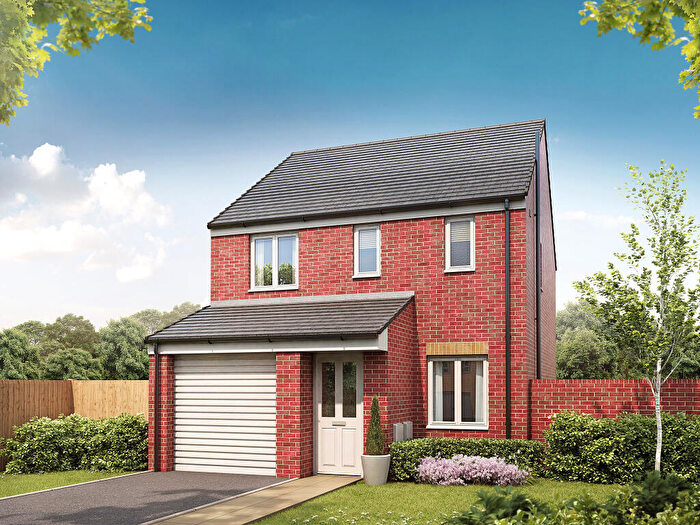
![]()
If you are looking to sell your house, let it out, or receive a property valuation, an expert can help you.
Click the button below to get started.


Neighbourhoods in Tiverton
Navigate through our locations to find the location of your next house in Tiverton, Devon for sale or to rent.
Property price trends in Tiverton
According to the latest Land Registry data, the average home in Tiverton sold for £314,854 in 2026. That figure comes from a substantial record of 17,434 sales logged over the past 31 years.
Prices have softened over the last three years. Compared with 2023, when the typical sale came in around £329,727, that's a fall of roughly 4.5%.
Looking back five years, average prices are down about 3.2% since 2021, a drop of around £10,345 in cash terms.
Zoom out to the past decade for the fuller picture. Back in 2016, homes here averaged £227,035, so the typical sold price has climbed about 38.7% since then, roughly 3.3% a year. Stretch the view to fifteen years and that annual pace eases back to about 2.5%.
Frequently asked questions about Tiverton
What is the average price for a property for sale in Tiverton?
The average price for a property for sale in Tiverton is £327,213. This amount is 9% lower than the average price in Devon. There are more than 10,000 property listings for sale in Tiverton.
What locations have the most expensive properties for sale in Tiverton?
The locations with the most expensive properties for sale in Tiverton are Cadbury at an average of £868,000, Way at an average of £625,769 and Upper Culm at an average of £562,295.
What locations have the most affordable properties for sale in Tiverton?
The locations with the most affordable properties for sale in Tiverton are Castle at an average of £253,435, Lowman at an average of £278,923 and Cranmore at an average of £283,768.
Which train stations are available in or near Tiverton?
Some of the train stations available in or near Tiverton are Tiverton Parkway, Newton St.Cyres and Crediton.
Property Price Paid in Tiverton by Year
The average sold property price by year was:
| Year | Average Sold Price | Price Change |
Sold Properties
|
|---|---|---|---|
| 2026 | £314,854 | -2% |
37 Properties |
| 2025 | £320,375 | -4% |
407 Properties |
| 2024 | £332,538 | 1% |
422 Properties |
| 2023 | £329,727 | -0,4% |
395 Properties |
| 2022 | £330,930 | 2% |
513 Properties |
| 2021 | £325,199 | 9% |
695 Properties |
| 2020 | £296,944 | 16% |
552 Properties |
| 2019 | £249,962 | 3% |
512 Properties |
| 2018 | £243,255 | -0,2% |
566 Properties |
| 2017 | £243,802 | 7% |
605 Properties |
Property Price per Property Type in Tiverton
Here you can find historic sold price data in order to help with your property search.
The average Property Paid Price for specific property types in the last three years are:
| Property Type | Average Sold Price | Sold Properties |
|---|---|---|
| Semi Detached House | £289,705.00 | 295 Semi Detached Houses |
| Terraced House | £235,659.00 | 425 Terraced Houses |
| Detached House | £474,522.00 | 453 Detached Houses |
| Flat | £136,806.00 | 88 Flats |
Transport in Tiverton
Please see below transportation links in this area:
