
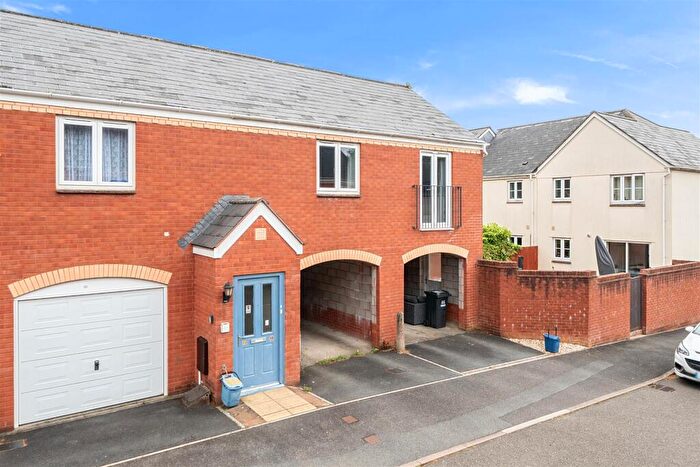
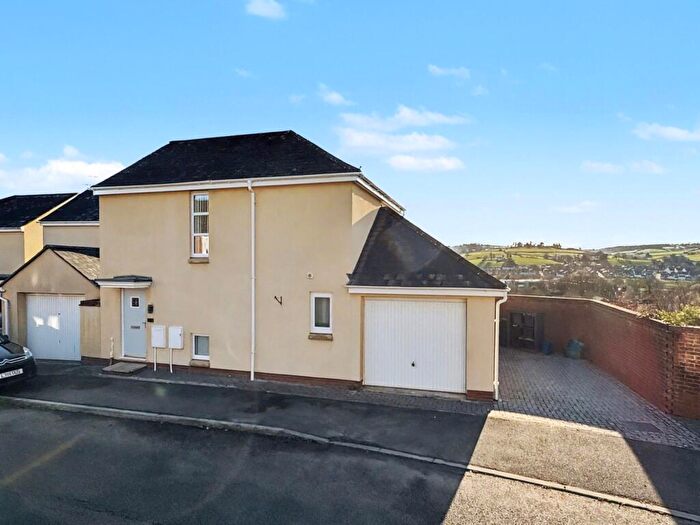
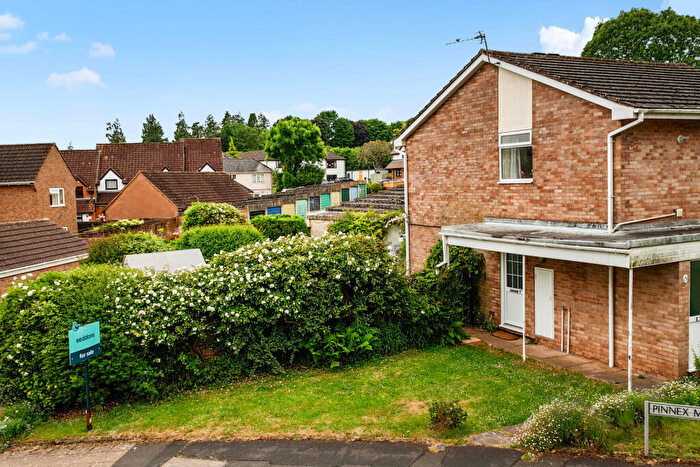
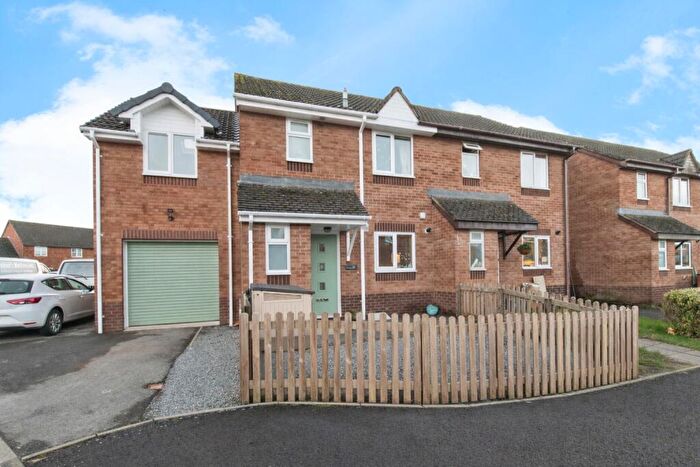
Houses for sale in EX16 9RD, Clare And Shuttern, Tiverton
House Prices in EX16 9RD, Clare And Shuttern
Properties in EX16 9RD have an average house price of £500k and had 1 Property Transaction within the last 3 years.¹ EX16 9RD is a postcode in Clare And Shuttern, an area in Tiverton, Devon, with 4 households², where the most expensive property was sold for £500k.
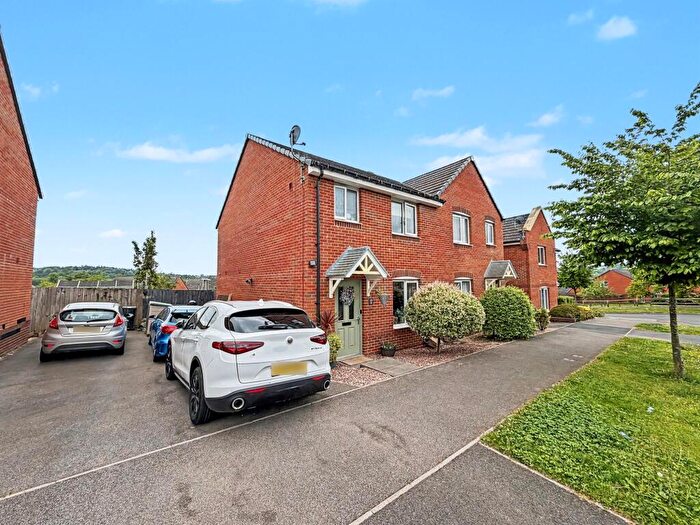
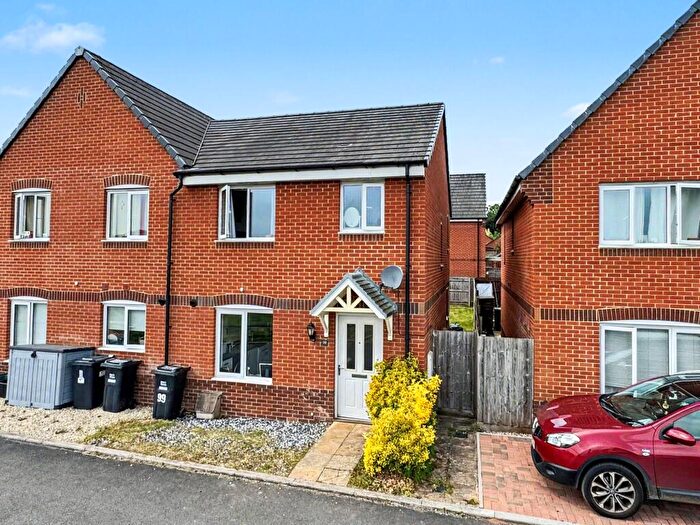
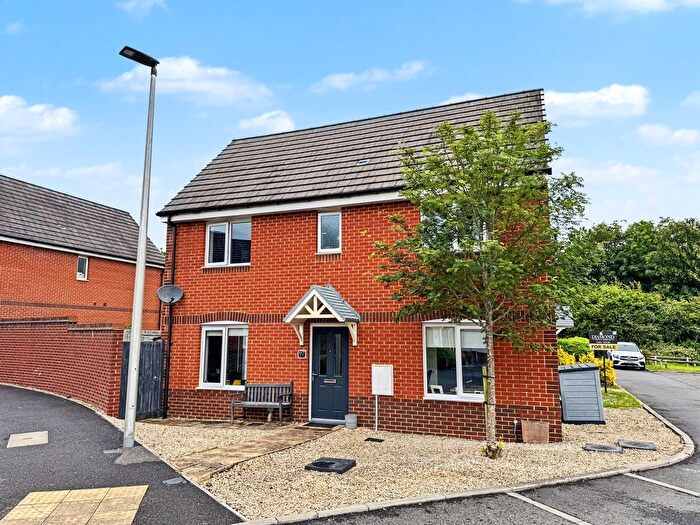
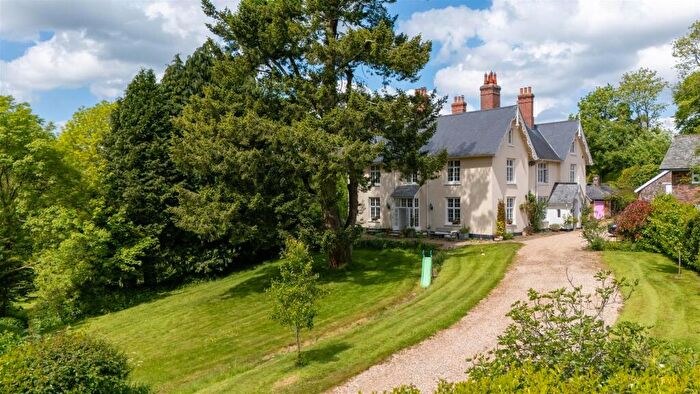
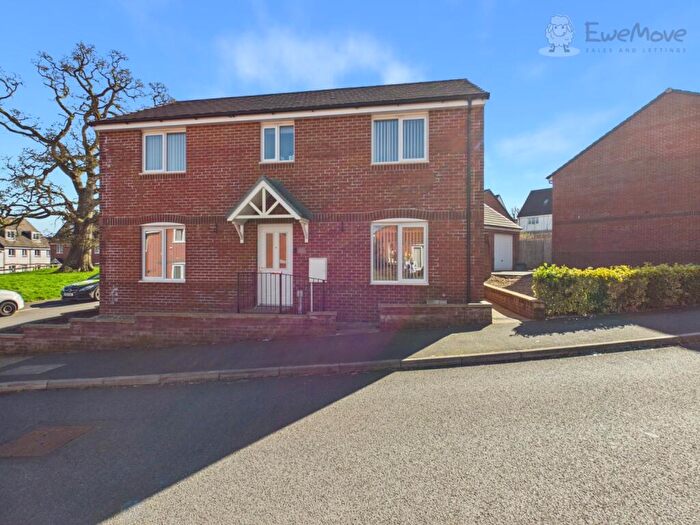
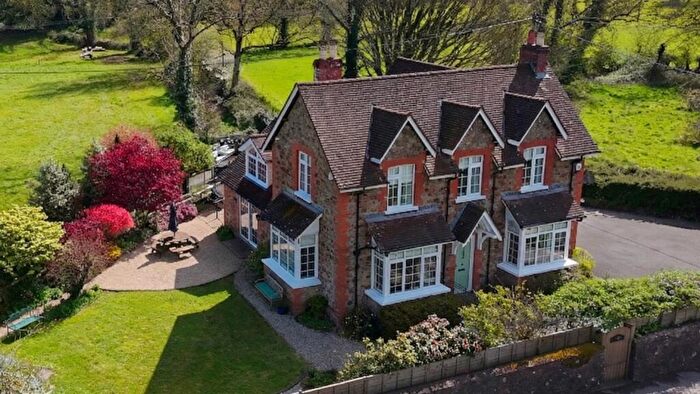
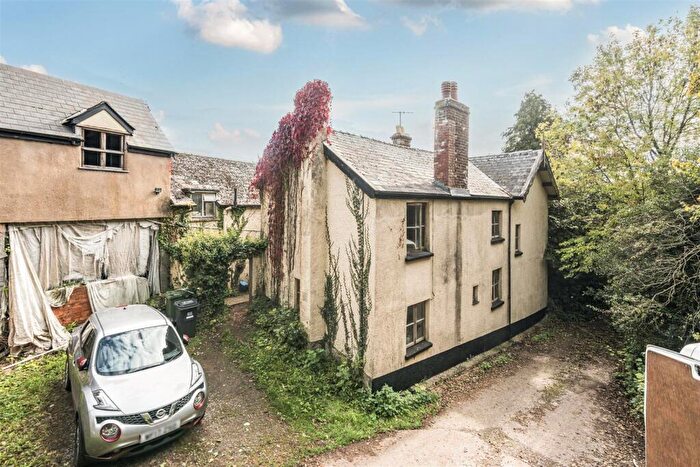
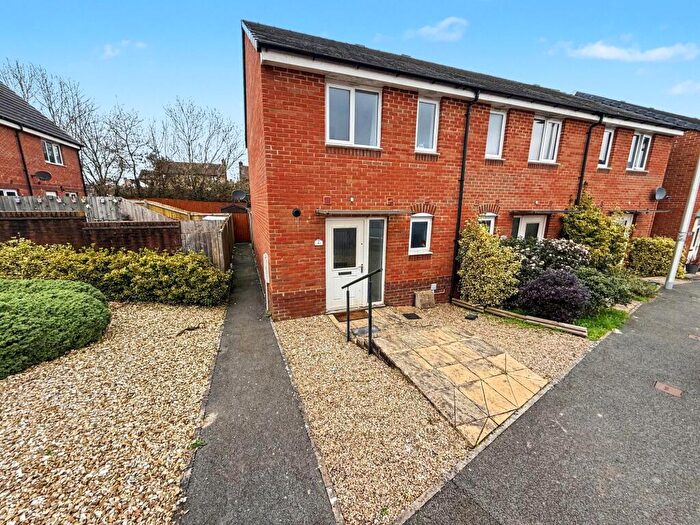
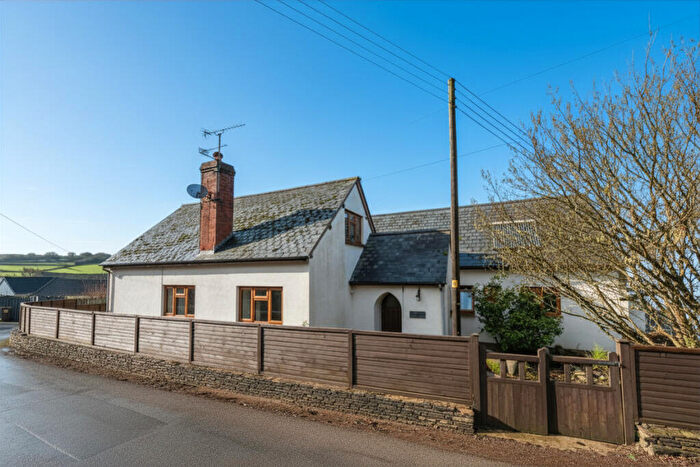
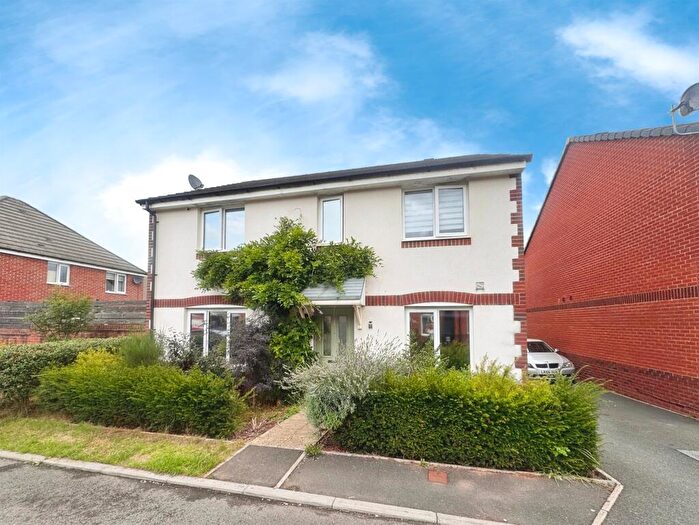
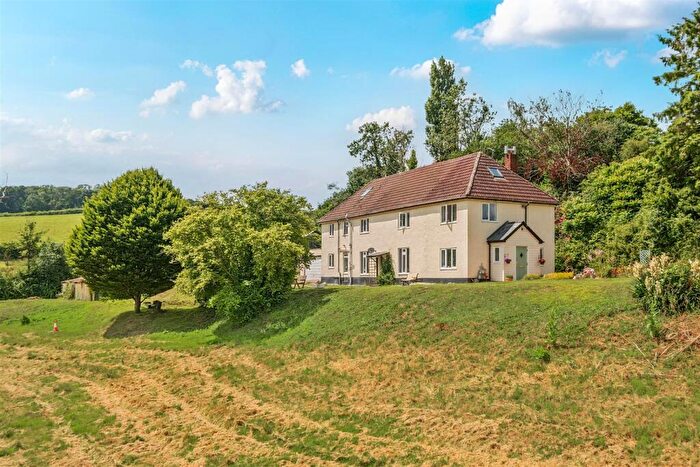
Properties for sale near EX16 9RD
![]()
If you are looking to sell your house, let it out, or receive a property valuation, an expert can help you.
Click the button below to get started.
Price Paid in EX16 9RD, Clare And Shuttern
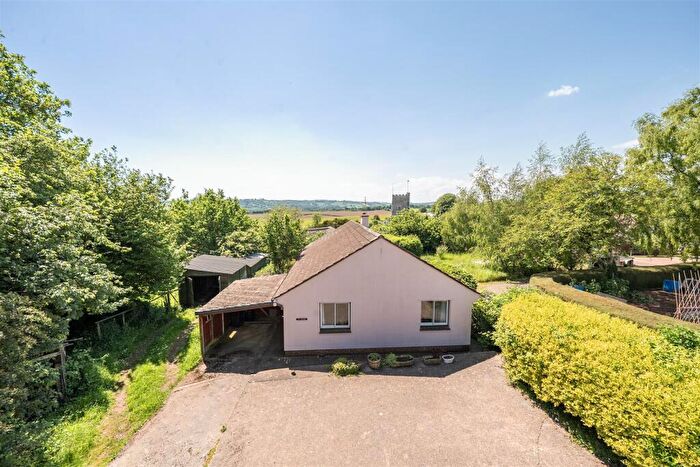
LOWER WYNERFREDS EX16 9RD, Clare And Shuttern Tiverton
Property LOWER WYNERFREDS has been sold 3 times. The last time it was sold was in 15/08/2024 and the sold price was £500,000.00.
This is a Semi Detached House which was sold as a freehold in 15/08/2024
| Date | Price | Property Type | Tenure | Classification |
|---|---|---|---|---|
| 15/08/2024 | £500,000.00 | Semi Detached House | freehold | Established Building |
| 09/01/2015 | £347,500.00 | Semi Detached House | freehold | Established Building |
| 28/10/2011 | £365,000.00 | Semi Detached House | freehold | Established Building |
WYNEFREDS EX16 9RD, Clare And Shuttern Tiverton
Property WYNEFREDS has been sold 2 times. The last time it was sold was in 31/03/2006 and the sold price was £147,000.00.
This detached house, sold as a freehold on 31/03/2006, is a 109 sqm semi-detached house with an EPC rating of E.
| Date | Price | Property Type | Tenure | Classification |
|---|---|---|---|---|
| 31/03/2006 | £147,000.00 | Detached House | freehold | Established Building |
| 17/07/1997 | £100,000.00 | Detached House | freehold | Established Building |
Property price trends in EX16 9RD
According to the latest Land Registry data, the average home in EX16 9RD sold for £500,000 in 2024. That figure comes from 5 sales logged over the past 27 years.
Zoom out to the past decade for the fuller picture. Back in 2015, homes here averaged £347,500, so the typical sold price has climbed about 43.9% since then, roughly 4.1% a year. Stretch the view to fifteen years and that annual pace eases back to about 2.5%.
Property Price Paid in EX16 9RD by Year
The average sold property price by year was:
| Year | Average Sold Price | Price Change |
Sold Properties
|
|---|---|---|---|
| 2024 | £500,000 | 31% |
1 Property |
| 2015 | £347,500 | -5% |
1 Property |
| 2011 | £365,000 | 60% |
1 Property |
| 2006 | £147,000 | 32% |
1 Property |
| 1997 | £100,000 | - |
1 Property |
Property Price per Property Type in EX16 9RD
Here you can find historic sold price data in order to help with your property search.
The average Property Paid Price for specific property types in the last three years are:
| Property Type | Average Sold Price | Sold Properties |
|---|---|---|
| Semi Detached House | £500,000.00 | 1 Semi Detached House |
