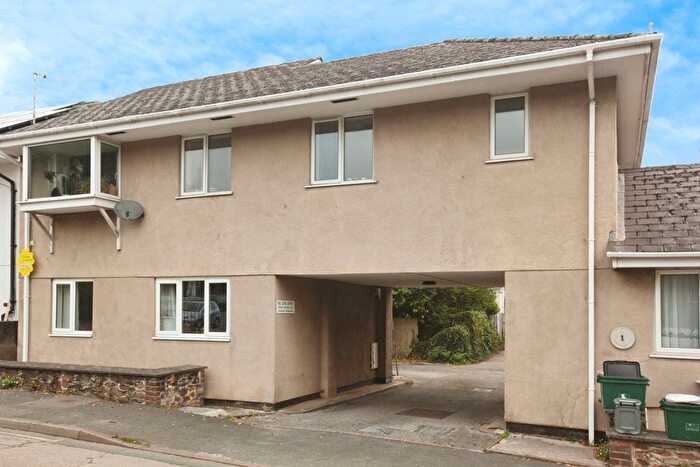
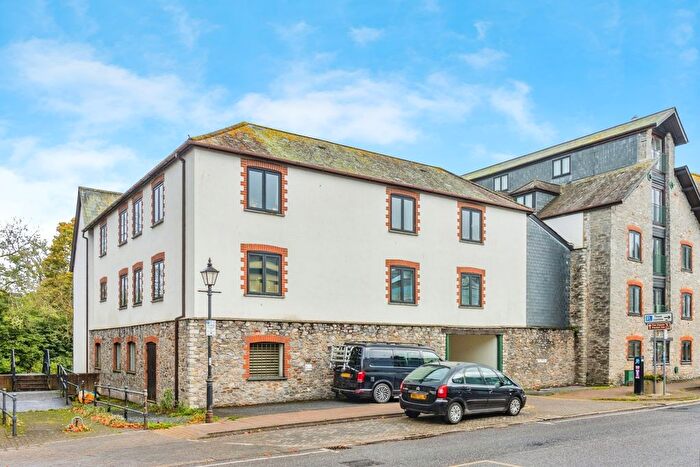
Houses for sale & to rent in Totnes Bridgetown, Totnes
House Prices in Totnes Bridgetown
Properties in Totnes Bridgetown have an average house price of £480,153.00 and had 124 Property Transactions within the last 3 years¹.
Totnes Bridgetown is an area in Totnes, Devon with 1,518 households², where the most expensive property was sold for £1,750,000.00.
Properties for sale in Totnes Bridgetown
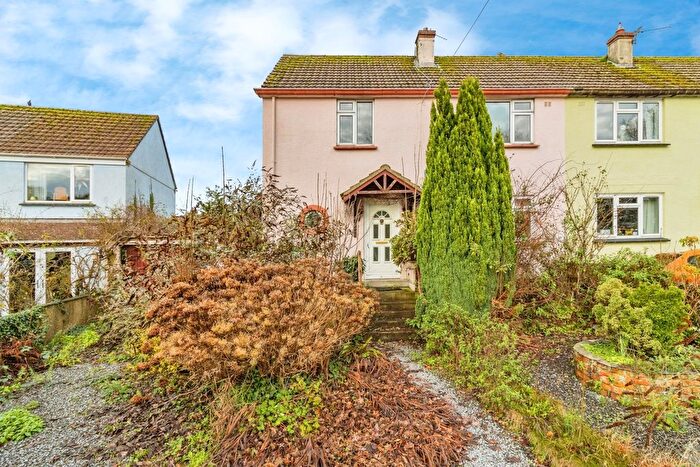
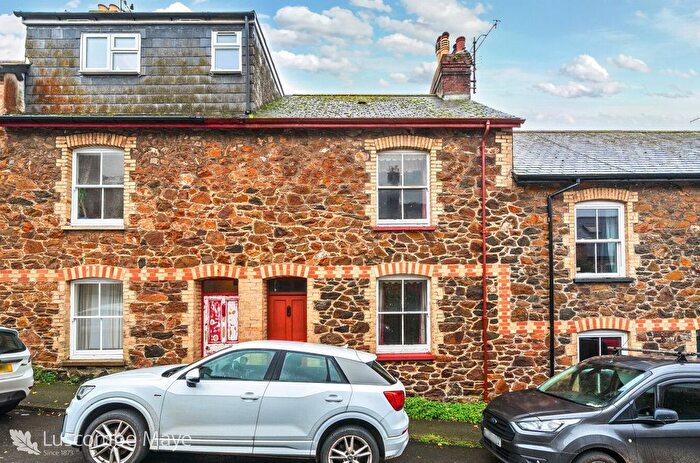
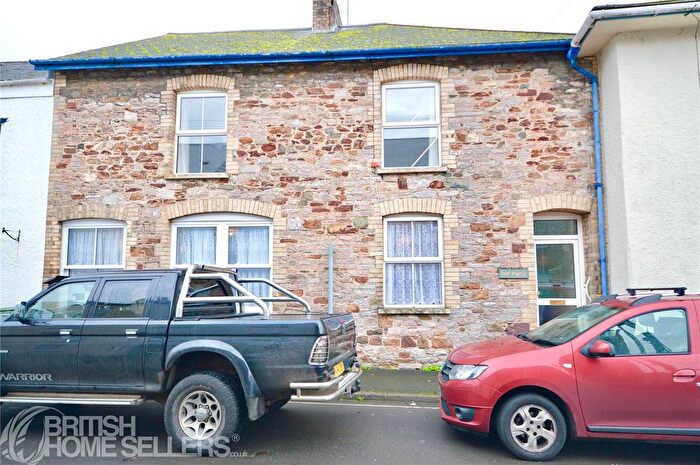
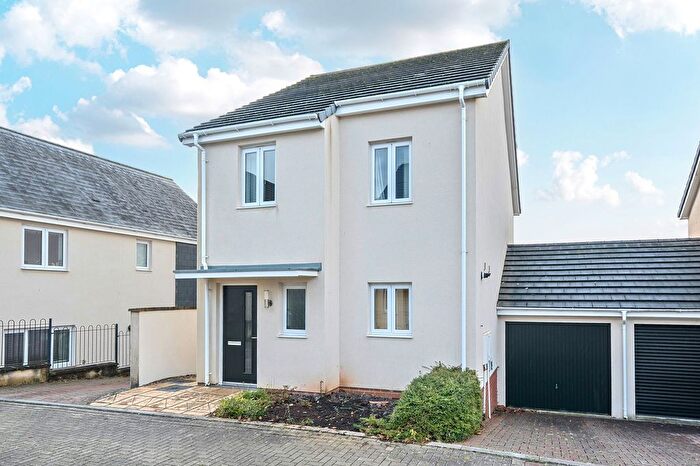
Previously listed properties in Totnes Bridgetown
Roads and Postcodes in Totnes Bridgetown
Navigate through our locations to find the location of your next house in Totnes Bridgetown, Totnes for sale or to rent.
| Streets | Postcodes |
|---|---|
| Argyle Terrace | TQ9 5JJ |
| Ashburton Road | TQ9 5JU TQ9 5JY |
| Barn Close | TQ9 5GS |
| Blackpost Lane | TQ9 5RF |
| Borough Park Road | TQ9 5XW |
| Bourton Lane | TQ9 5JF |
| Bourton Road | TQ9 5BG |
| Bridgetown | TQ9 5AD TQ9 5BS |
| Bridgetown Hill | TQ9 5BH TQ9 5BN |
| Bridgewater Gardens | TQ9 5RN |
| Broad Oak Crescent | TQ9 5QS |
| Brooklands | TQ9 5AR |
| Burke Road | TQ9 5XL |
| Chapel Lane | TQ9 5AF |
| Christina Parade | TQ9 5UU |
| Christina Park | TQ9 5UR TQ9 5UT |
| Coldharbour | TQ9 5BJ |
| Courtfield | TQ9 5RG TQ9 5RQ |
| Crosspark | TQ9 5BQ |
| Culverdale | TQ9 5UE |
| Dartside | TQ9 5HL |
| Devon Place | TQ9 5AE |
| Devon Terrace | TQ9 5AZ |
| Dukes Road | TQ9 5YA |
| Elizabeth Court | TQ9 5YG |
| Elm Walk | TQ9 5YQ |
| Elmhirst Drive | TQ9 5UX |
| Fairseat Close | TQ9 5AN |
| Ford Road | TQ9 5LQ |
| Furze Road | TQ9 5YE |
| Hayes Close | TQ9 5YB |
| Higher Westonfields | TQ9 5QY TQ9 5QZ TQ9 5RA TQ9 5RB |
| Hillbrook Rise | TQ9 5AU |
| Hillbrook Road | TQ9 5AT |
| Hilldown | TQ9 5RE |
| Hope Close | TQ9 5YD |
| Hope Walk | TQ9 5YL |
| Jubilee Road | TQ9 5BP TQ9 5BW |
| Kings Orchard | TQ9 5BX |
| Lansdowne Park | TQ9 5UP TQ9 5UW |
| Mansbridge Road | TQ9 5RH |
| Meadow Close | TQ9 5YF |
| Newton Road | TQ9 5BB |
| Old Coach House Mews | TQ9 5GU |
| Parkers Close | TQ9 5UH TQ9 5UQ |
| Parkers Way | TQ9 5UF TQ9 5UG |
| Parkfield Close | TQ9 5YJ |
| Parklands | TQ9 5HZ |
| Pathfields | TQ9 5TX TQ9 5TY TQ9 5TZ |
| Pomeroy Villas | TQ9 5BE |
| Radnor Terrace | TQ9 5JW |
| Redworth Court | TQ9 5EQ |
| Redworth Terrace | TQ9 5JN |
| Rhine Villas | TQ9 5BD |
| Riverside | TQ9 5JB |
| Rowsells Lane | TQ9 5AG |
| Rush Way | TQ9 5YH |
| Seymour Place | TQ9 5AY |
| Seymour Road | TQ9 5QP |
| Seymour Terrace | TQ9 5AQ |
| Seymour Villas | TQ9 5QR |
| Somerset Place | TQ9 5AX |
| Southcote Orchard | TQ9 5PA |
| Springhill Road | TQ9 5RD |
| St Johns Terrace | TQ9 5JH |
| Station Road | TQ9 5JG TQ9 5LF |
| Steamer Quay Road | TQ9 5AL TQ9 5BY |
| Swallowfields | TQ9 5LA TQ9 5LB |
| The Cedars | TQ9 5YR |
| The Paddocks | TQ9 5XT |
| Walnut Close | TQ9 5GF |
| Weirfields | TQ9 5JS |
| Weston Lane | TQ9 5AP TQ9 5LS TQ9 5UN |
| Weston Road | TQ9 5AH TQ9 5AW |
| Westonfields | TQ9 5QT TQ9 5QU TQ9 5QX TQ9 5UA |
| Woodbrook Road | TQ9 5AS |
| TQ9 5AA TQ9 5AB TQ9 5BA TQ9 5BU |
Transport near Totnes Bridgetown
- FAQ
- Price Paid By Year
- Property Type Price
Frequently asked questions about Totnes Bridgetown
What is the average price for a property for sale in Totnes Bridgetown?
The average price for a property for sale in Totnes Bridgetown is £480,153. This amount is 1% lower than the average price in Totnes. There are 299 property listings for sale in Totnes Bridgetown.
What streets have the most expensive properties for sale in Totnes Bridgetown?
The streets with the most expensive properties for sale in Totnes Bridgetown are Jubilee Road at an average of £933,750, Dartside at an average of £830,000 and Devon Terrace at an average of £783,500.
What streets have the most affordable properties for sale in Totnes Bridgetown?
The streets with the most affordable properties for sale in Totnes Bridgetown are Woodbrook Road at an average of £185,000, St Johns Terrace at an average of £202,000 and The Cedars at an average of £205,000.
Which train stations are available in or near Totnes Bridgetown?
Some of the train stations available in or near Totnes Bridgetown are Totnes, Paignton and Torquay.
Property Price Paid in Totnes Bridgetown by Year
The average sold property price by year was:
| Year | Average Sold Price | Price Change |
Sold Properties
|
|---|---|---|---|
| 2025 | £426,351 | -27% |
33 Properties |
| 2024 | £541,507 | 16% |
47 Properties |
| 2023 | £454,966 | -3% |
44 Properties |
| 2022 | £470,489 | 27% |
49 Properties |
| 2021 | £342,872 | -15% |
55 Properties |
| 2020 | £395,785 | 2% |
43 Properties |
| 2019 | £386,671 | 13% |
46 Properties |
| 2018 | £334,720 | -5% |
60 Properties |
| 2017 | £351,622 | 22% |
45 Properties |
| 2016 | £274,156 | 1% |
68 Properties |
| 2015 | £271,219 | -2% |
49 Properties |
| 2014 | £276,712 | -1% |
61 Properties |
| 2013 | £280,382 | 5% |
44 Properties |
| 2012 | £265,897 | 5% |
38 Properties |
| 2011 | £252,723 | -16% |
59 Properties |
| 2010 | £292,905 | 17% |
55 Properties |
| 2009 | £243,791 | -1% |
50 Properties |
| 2008 | £246,120 | -11% |
30 Properties |
| 2007 | £273,821 | 8% |
57 Properties |
| 2006 | £251,242 | 3% |
71 Properties |
| 2005 | £243,855 | 16% |
60 Properties |
| 2004 | £203,699 | 5% |
63 Properties |
| 2003 | £193,424 | 15% |
64 Properties |
| 2002 | £163,695 | 24% |
75 Properties |
| 2001 | £124,232 | 7% |
66 Properties |
| 2000 | £115,656 | 28% |
72 Properties |
| 1999 | £83,123 | 1% |
52 Properties |
| 1998 | £82,233 | -3% |
68 Properties |
| 1997 | £85,029 | 15% |
71 Properties |
| 1996 | £72,504 | -1% |
70 Properties |
| 1995 | £73,267 | - |
46 Properties |
Property Price per Property Type in Totnes Bridgetown
Here you can find historic sold price data in order to help with your property search.
The average Property Paid Price for specific property types in the last three years are:
| Property Type | Average Sold Price | Sold Properties |
|---|---|---|
| Semi Detached House | £401,794.00 | 39 Semi Detached Houses |
| Detached House | £623,530.00 | 37 Detached Houses |
| Terraced House | £417,617.00 | 33 Terraced Houses |
| Flat | £467,800.00 | 15 Flats |

