
Houses for sale in Totnes, Devon
House Prices in Totnes
Properties in Totnes have an average house price of £484k and had 855 Property Transactions within the last 3 years.¹
Totnes is an area in Devon with 8,924 households², where the most expensive property was sold for £2.3M.
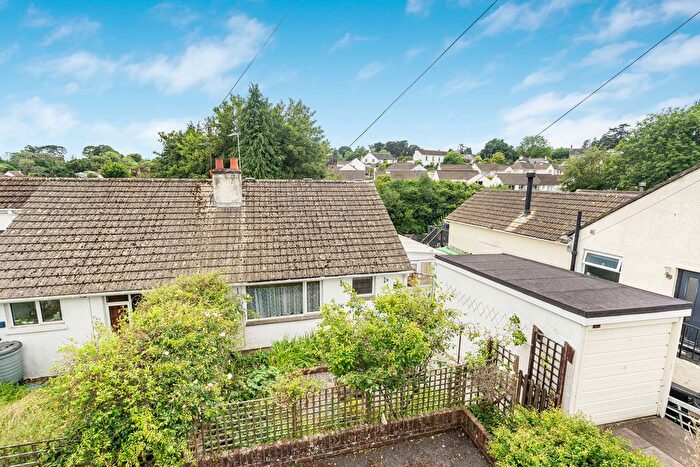
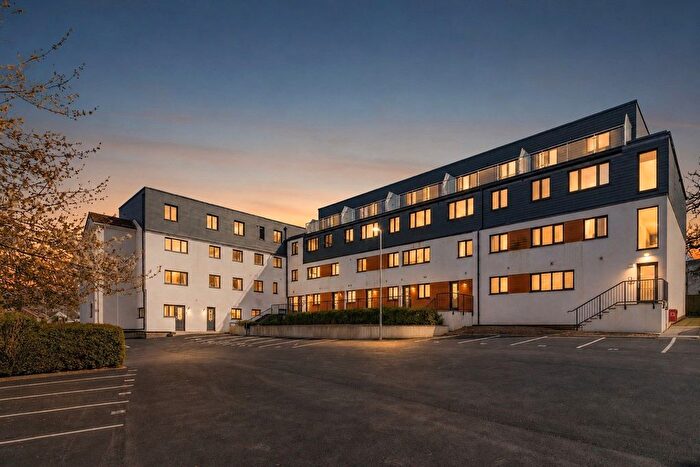
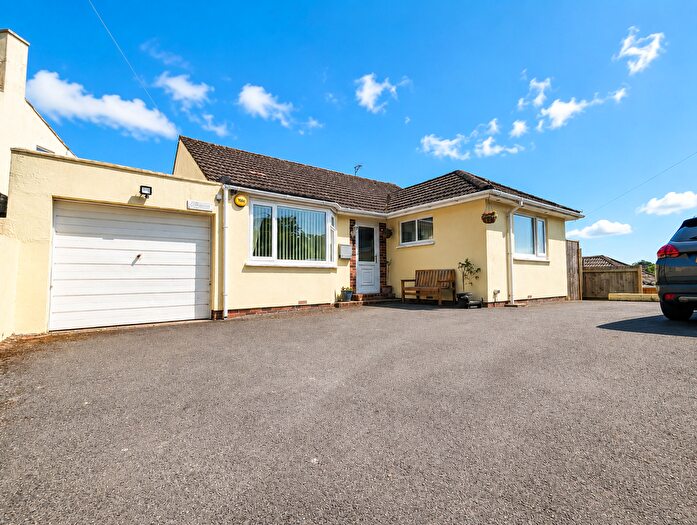
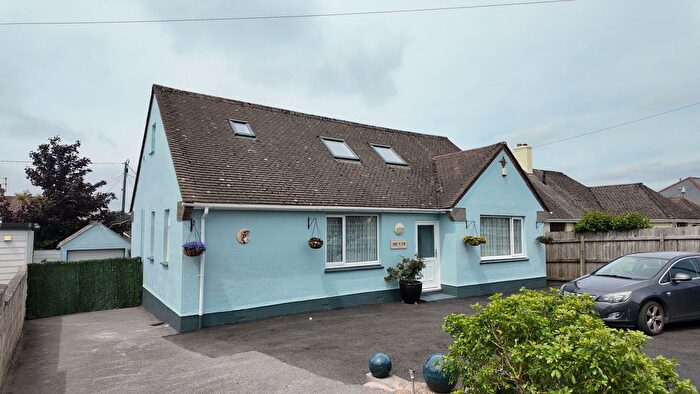
Properties for sale in Totnes
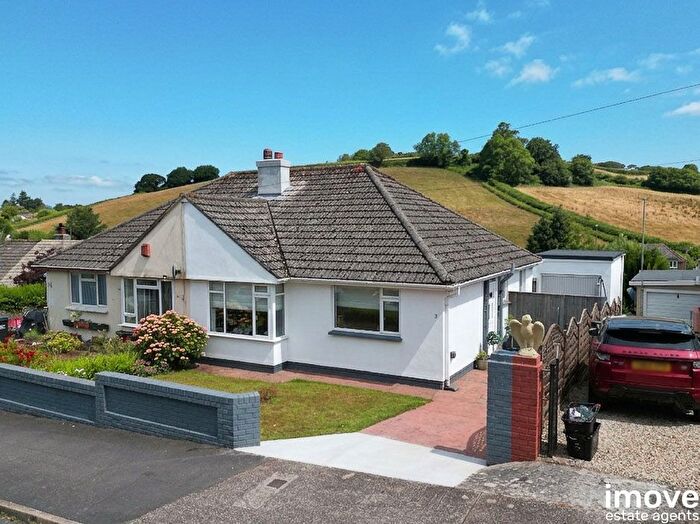
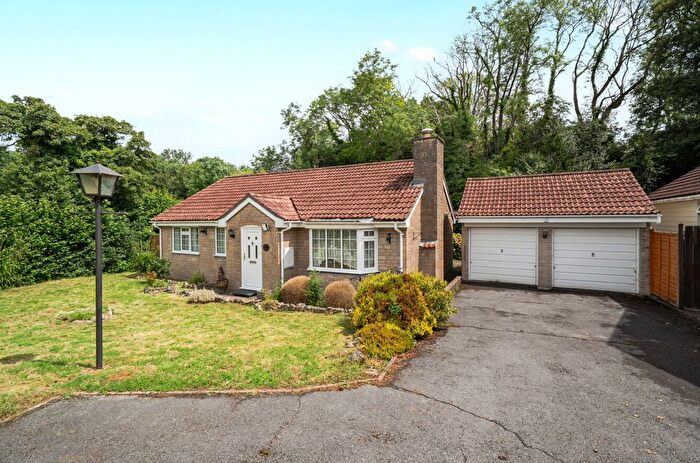
![]()
If you are looking to sell your house, let it out, or receive a property valuation, an expert can help you.
Click the button below to get started.
Neighbourhoods in Totnes
Navigate through our locations to find the location of your next house in Totnes, Devon for sale or to rent.
- Allington And Loddiswell
- Ambrook
- Avon And Harbourne
- Dartington
- East Dart
- Eastmoor
- Ipplepen
- Skerries
- South Brent
- Thurlestone
- Totnes Bridgetown
- Totnes Town
- West Dart
- Totnes
- Dartington & Staverton
- Dartmouth & East Dart
- Marldon & Littlehempston
- Blackawton & Stoke Fleming
- Allington & Strete
- Loddiswell & Aveton Gifford
Property price trends in Totnes
According to the latest Land Registry data, the average home in Totnes sold for £421,500 in 2026. That figure comes from a substantial record of 10,895 sales logged over the past 31 years.
Prices have fallen back over the last three years. Compared with 2023, when the typical sale came in around £505,510, that's a fall of roughly 16.6%.
Looking back five years, average prices are up about 4.4% since 2021, a gain of around £17,865 in cash terms.
Zoom out to the past decade for the fuller picture. Back in 2016, homes here averaged £307,495, so the typical sold price has climbed about 37.1% since then, roughly 3.2% a year. Stretch the view to fifteen years and that annual pace eases back to about 2.8%.
Frequently asked questions about Totnes
What is the average price for a property for sale in Totnes?
The average price for a property for sale in Totnes is £483,742. This amount is 34% higher than the average price in Devon. There are more than 10,000 property listings for sale in Totnes.
What locations have the most expensive properties for sale in Totnes?
The locations with the most expensive properties for sale in Totnes are South Brent at an average of £868,333, Ambrook at an average of £797,803 and Eastmoor at an average of £654,024.
What locations have the most affordable properties for sale in Totnes?
The locations with the most affordable properties for sale in Totnes are Blackawton & Stoke Fleming at an average of £335,340, Totnes Town at an average of £372,382 and Dartington & Staverton at an average of £416,338.
Which train stations are available in or near Totnes?
Some of the train stations available in or near Totnes are Totnes, Paignton and Torquay.
Property Price Paid in Totnes by Year
The average sold property price by year was:
| Year | Average Sold Price | Price Change |
Sold Properties
|
|---|---|---|---|
| 2026 | £421,500 | -8% |
15 Properties |
| 2025 | £456,755 | -7% |
262 Properties |
| 2024 | £490,303 | -3% |
301 Properties |
| 2023 | £505,510 | 3% |
277 Properties |
| 2022 | £489,167 | 17% |
352 Properties |
| 2021 | £403,635 | 3% |
465 Properties |
| 2020 | £390,718 | 6% |
330 Properties |
| 2019 | £368,401 | 0,3% |
352 Properties |
| 2018 | £367,129 | 5% |
431 Properties |
| 2017 | £349,168 | 12% |
384 Properties |
Property Price per Property Type in Totnes
Here you can find historic sold price data in order to help with your property search.
The average Property Paid Price for specific property types in the last three years are:
| Property Type | Average Sold Price | Sold Properties |
|---|---|---|
| Semi Detached House | £438,323.00 | 199 Semi Detached Houses |
| Detached House | £669,318.00 | 292 Detached Houses |
| Terraced House | £389,066.00 | 253 Terraced Houses |
| Flat | £292,780.00 | 111 Flats |
Transport in Totnes
Please see below transportation links in this area:
