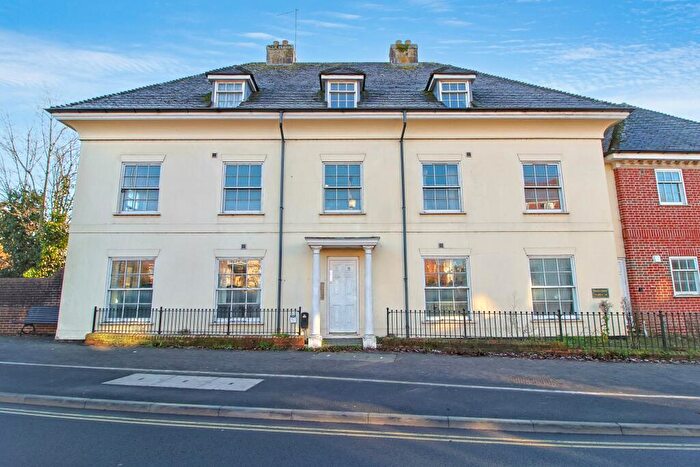
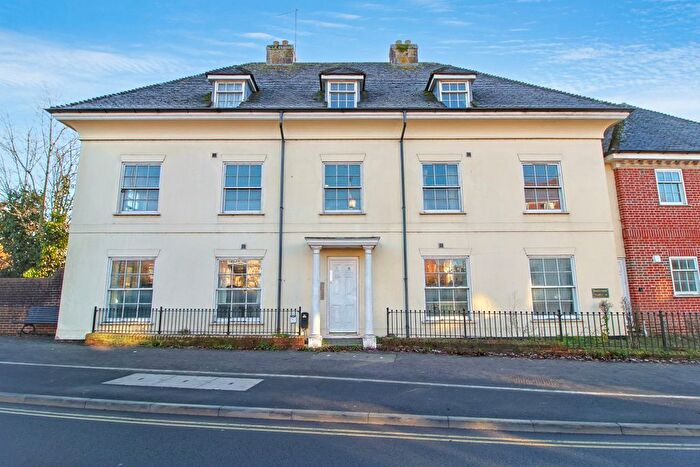
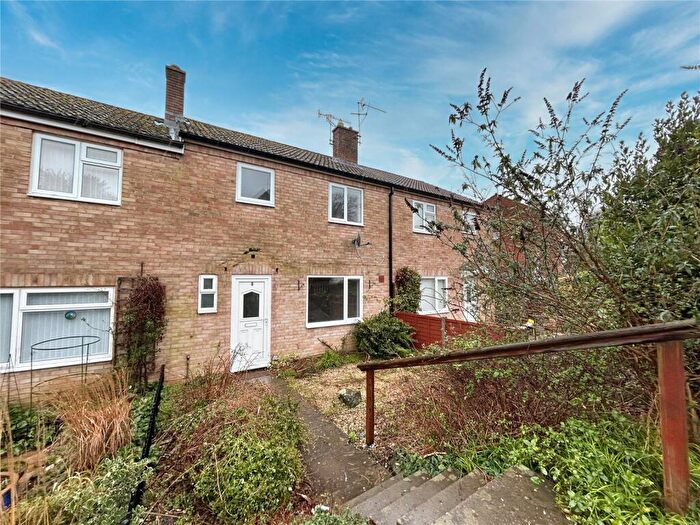
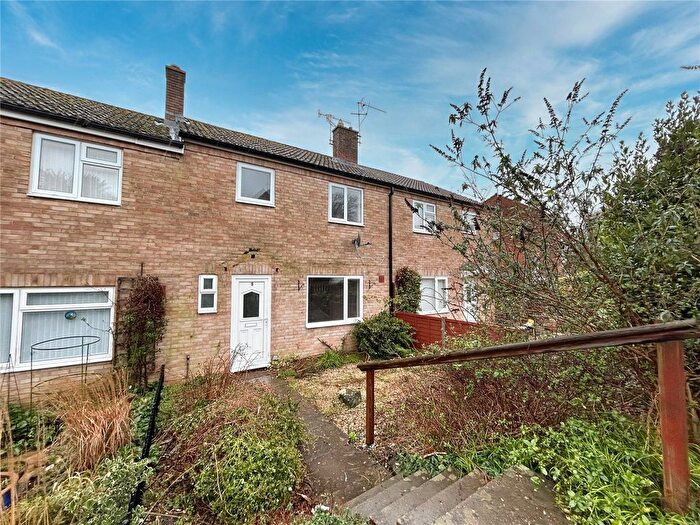
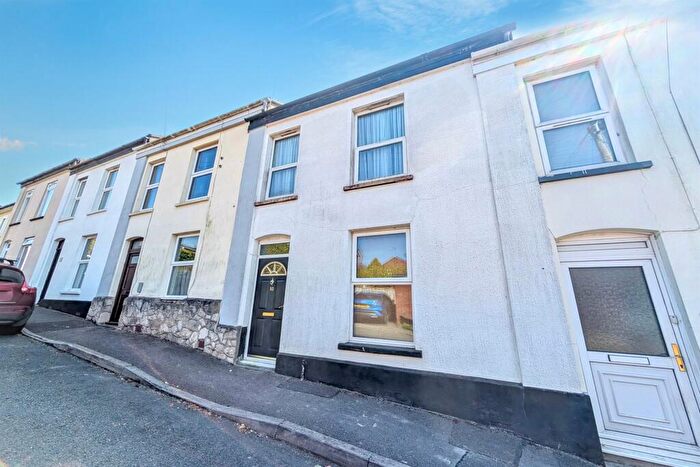
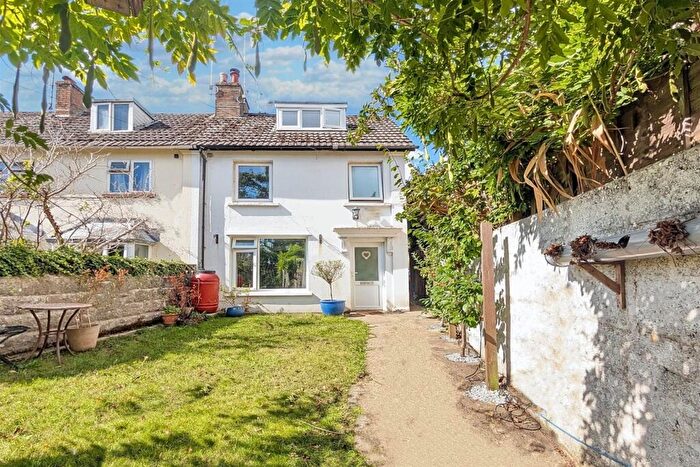
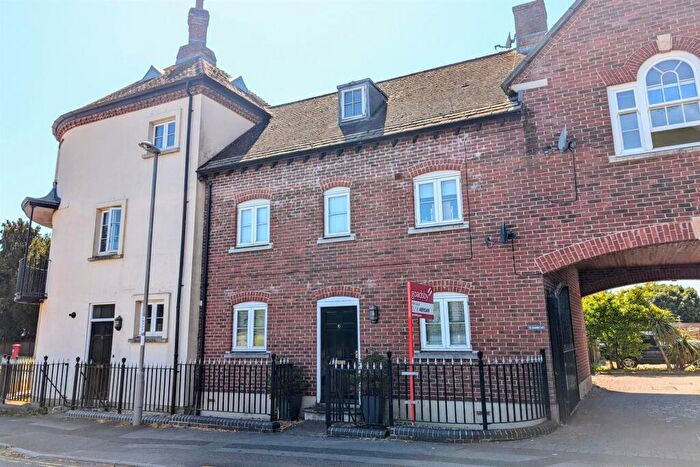
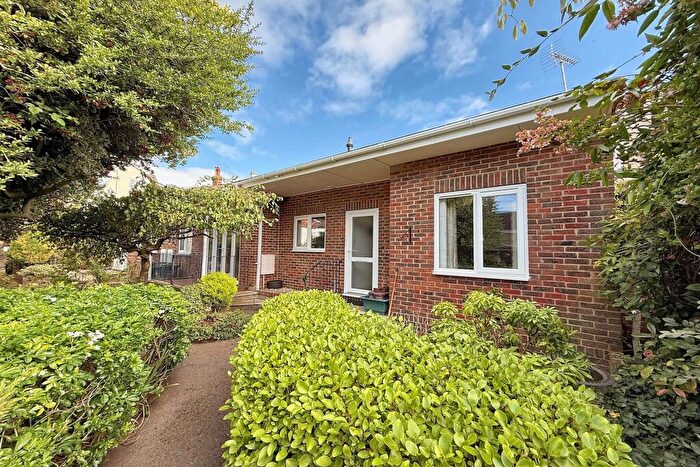
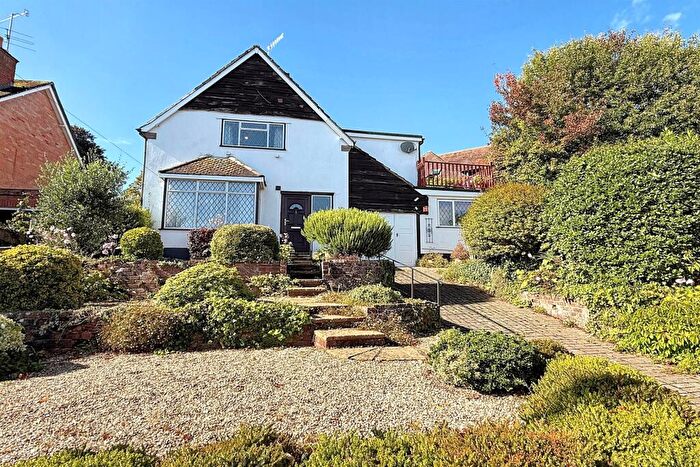
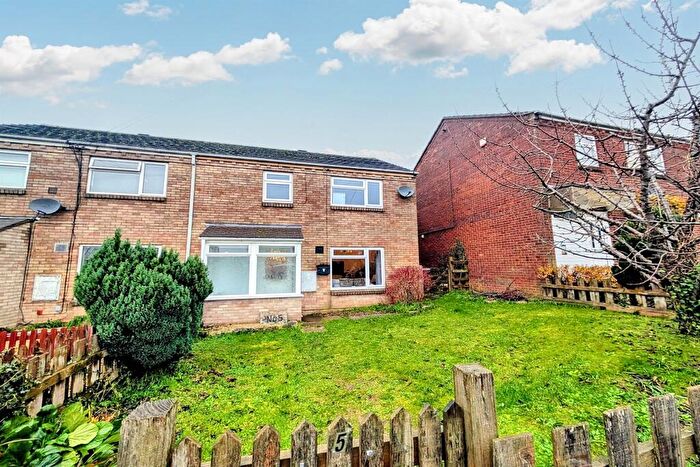
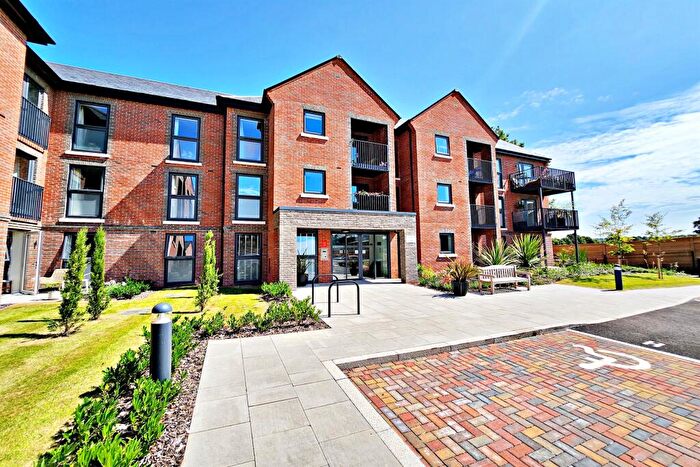
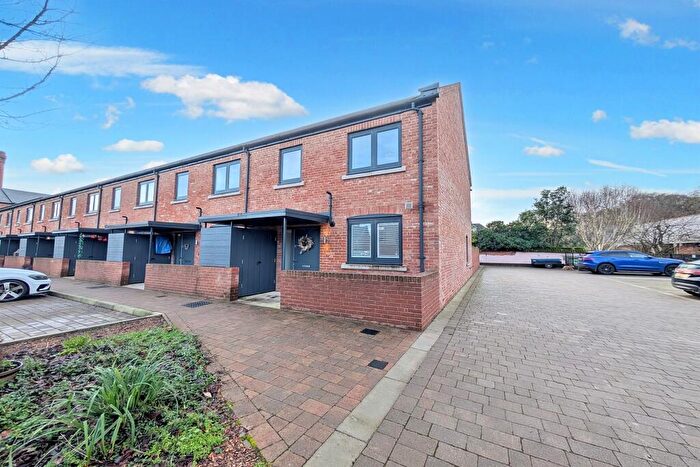
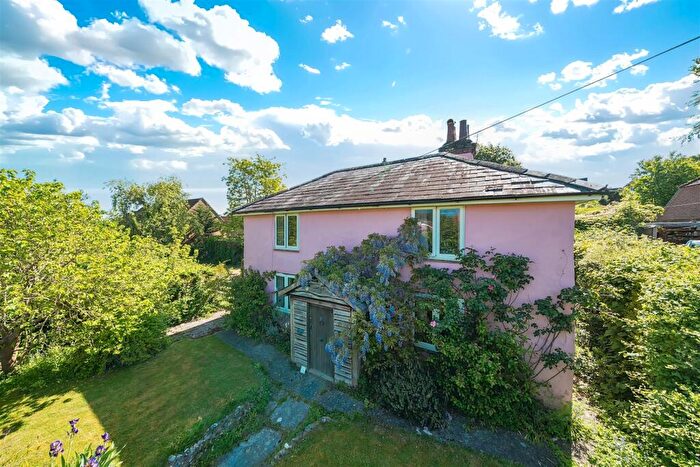
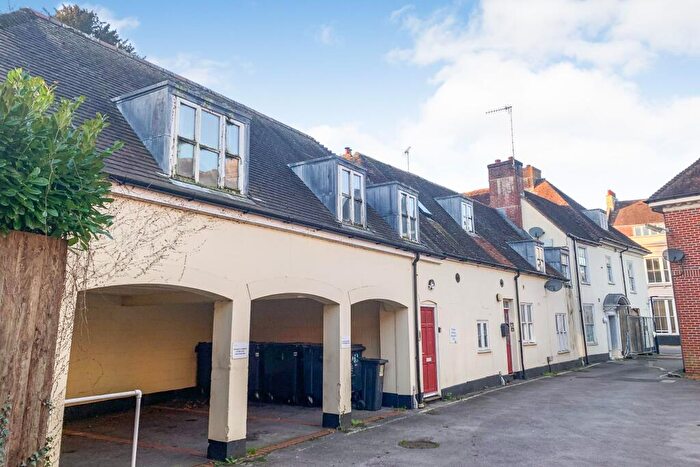
Houses for sale & to rent in Blandford Old Town, Blandford Forum
House Prices in Blandford Old Town
Properties in Blandford Old Town have an average house price of £234,921.00 and had 162 Property Transactions within the last 3 years¹.
Blandford Old Town is an area in Blandford Forum, Dorset with 984 households², where the most expensive property was sold for £1,300,000.00.
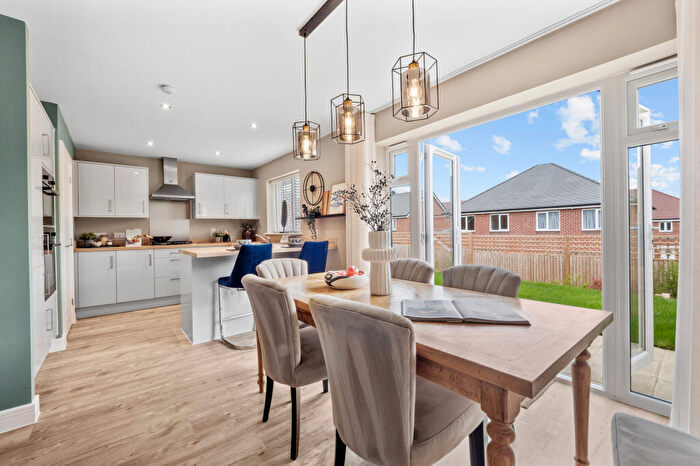
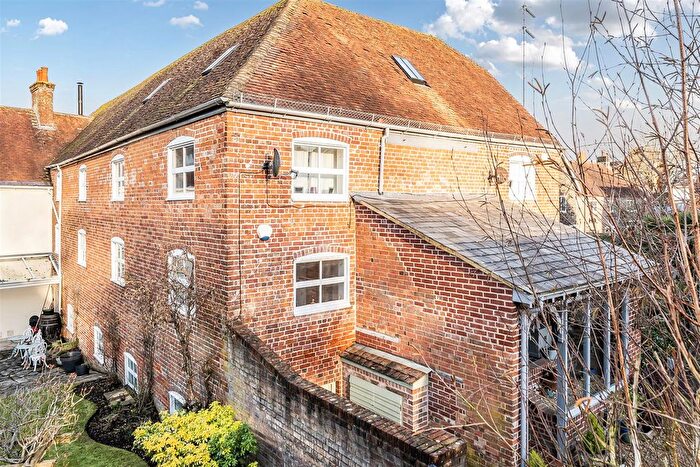
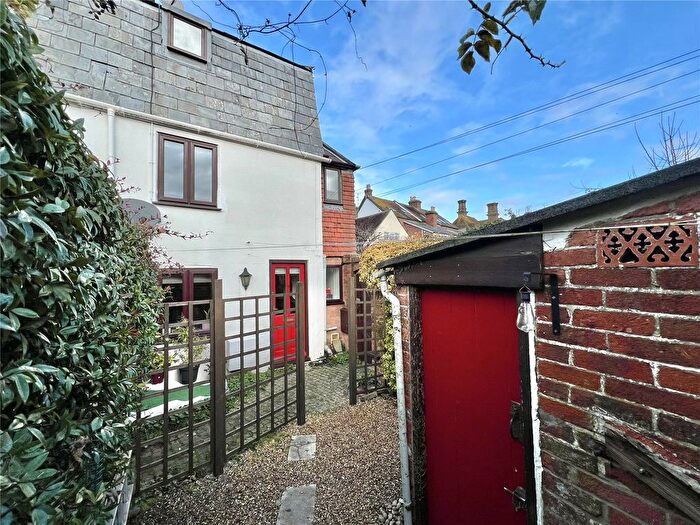
Properties for sale in Blandford Old Town
Roads and Postcodes in Blandford Old Town
Navigate through our locations to find the location of your next house in Blandford Old Town, Blandford Forum for sale or to rent.
| Streets | Postcodes |
|---|---|
| Bedlam Yard | DT11 7PU |
| Bell Inn Yard | DT11 7AU |
| Bryanston Mews | DT11 7FE |
| Bryanston Street | DT11 7AZ DT11 7FH DT11 7XE |
| Damory Street | DT11 7ET |
| Dorset Place | DT11 7RQ |
| Dorset Street | DT11 7RF DT11 7RG |
| Dunch Mead Cottages | DT11 7DZ |
| Eagle House Gardens | DT11 7BS DT11 7BT |
| East Street | DT11 7DR DT11 7DU DT11 7DX DT11 7DY |
| Fields Oak | DT11 7PP |
| Forum Mews | DT11 7BD |
| Hornbeam Way | DT11 7FW |
| Limerick Cottages | DT11 7EA |
| Luton Mews | DT11 7GE |
| Market House Mews | DT11 7AH |
| Market Place | DT11 7EB DT11 7EH |
| Milldown Road | DT11 7DB DT11 7DD |
| Nightingale Court | DT11 7ED |
| North Place | DT11 7PW DT11 7RE |
| Orchard Street | DT11 7QZ DT11 7RA DT11 7RD |
| Park Lands | DT11 7BA |
| Park Road | DT11 7BX |
| Parkers Mews | DT11 7PR |
| Portman Place | DT11 7DG |
| River Mews | DT11 7AX |
| Rookery Corner | DT11 7GA DT11 7GD |
| Salisbury Street | DT11 7AR DT11 7AY DT11 7PS DT11 7PX DT11 7PY DT11 7QE |
| Sheep Market Hill | DT11 7DP |
| Tabernacle Walk | DT11 7DL |
| The Close | DT11 7HA DT11 7HB |
| The Milldown | DT11 7SH |
| The Orchard | DT11 7DE |
| The Plocks | DT11 7AA |
| The Tabernacle | DT11 7DW |
| Wessex Court | DT11 7RH |
| West Street | DT11 7AJ DT11 7AW |
| White Cliff Gardens | DT11 7BU |
| Whitecliff Mill Street | DT11 7BE DT11 7BN DT11 7BP DT11 7BQ DT11 7BW DT11 7DQ |
Transport near Blandford Old Town
-
Holton Heath Station
-
Hamworthy Station
-
Wareham Station
-
Wool Station
-
Poole Station
-
Moreton (Dorset) Station
-
Gillingham (Dorset) Station
-
Parkstone Station
-
Branksome Station
-
Tisbury Station
- FAQ
- Price Paid By Year
- Property Type Price
Frequently asked questions about Blandford Old Town
What is the average price for a property for sale in Blandford Old Town?
The average price for a property for sale in Blandford Old Town is £234,921. This amount is 40% lower than the average price in Blandford Forum. There are 912 property listings for sale in Blandford Old Town.
What streets have the most expensive properties for sale in Blandford Old Town?
The streets with the most expensive properties for sale in Blandford Old Town are The Orchard at an average of £673,642, Hornbeam Way at an average of £372,000 and Park Lands at an average of £359,666.
What streets have the most affordable properties for sale in Blandford Old Town?
The streets with the most affordable properties for sale in Blandford Old Town are East Street at an average of £104,656, West Street at an average of £107,888 and Eagle House Gardens at an average of £125,000.
Which train stations are available in or near Blandford Old Town?
Some of the train stations available in or near Blandford Old Town are Holton Heath, Hamworthy and Wareham.
Property Price Paid in Blandford Old Town by Year
The average sold property price by year was:
| Year | Average Sold Price | Price Change |
Sold Properties
|
|---|---|---|---|
| 2025 | £178,712 | -32% |
28 Properties |
| 2024 | £236,496 | -12% |
41 Properties |
| 2023 | £265,010 | 11% |
50 Properties |
| 2022 | £235,033 | 2% |
43 Properties |
| 2021 | £231,180 | 36% |
78 Properties |
| 2020 | £148,694 | -47% |
27 Properties |
| 2019 | £218,319 | 6% |
51 Properties |
| 2018 | £204,283 | -12% |
51 Properties |
| 2017 | £228,921 | 16% |
53 Properties |
| 2016 | £191,257 | 15% |
52 Properties |
| 2015 | £161,904 | 6% |
56 Properties |
| 2014 | £152,223 | -24% |
48 Properties |
| 2013 | £188,516 | 17% |
33 Properties |
| 2012 | £156,464 | -34% |
42 Properties |
| 2011 | £209,548 | 17% |
30 Properties |
| 2010 | £173,578 | 7% |
41 Properties |
| 2009 | £162,200 | 7% |
39 Properties |
| 2008 | £150,869 | 3% |
31 Properties |
| 2007 | £145,742 | 0,1% |
102 Properties |
| 2006 | £145,649 | 8% |
108 Properties |
| 2005 | £133,573 | -10% |
76 Properties |
| 2004 | £146,537 | 18% |
79 Properties |
| 2003 | £120,387 | -2% |
66 Properties |
| 2002 | £122,210 | 21% |
88 Properties |
| 2001 | £96,796 | 14% |
83 Properties |
| 2000 | £83,366 | 29% |
73 Properties |
| 1999 | £58,927 | 16% |
72 Properties |
| 1998 | £49,474 | -12% |
62 Properties |
| 1997 | £55,319 | -17% |
65 Properties |
| 1996 | £64,759 | 23% |
56 Properties |
| 1995 | £49,896 | - |
45 Properties |
Property Price per Property Type in Blandford Old Town
Here you can find historic sold price data in order to help with your property search.
The average Property Paid Price for specific property types in the last three years are:
| Property Type | Average Sold Price | Sold Properties |
|---|---|---|
| Semi Detached House | £294,615.00 | 13 Semi Detached Houses |
| Detached House | £602,909.00 | 22 Detached Houses |
| Terraced House | £265,876.00 | 40 Terraced Houses |
| Flat | £118,714.00 | 87 Flats |

