
Houses for sale in Dorset, England
House Prices in Dorset
Properties in Dorset have
an average house price of
£393k
and had 21,163 Property Transactions
within the last 3 years.¹
Dorset is a location in
England with
193,489 households², where the most expensive property was sold for £7.6M.
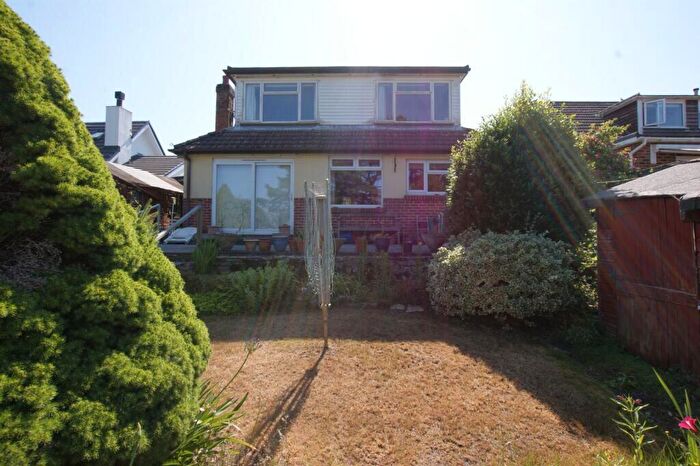
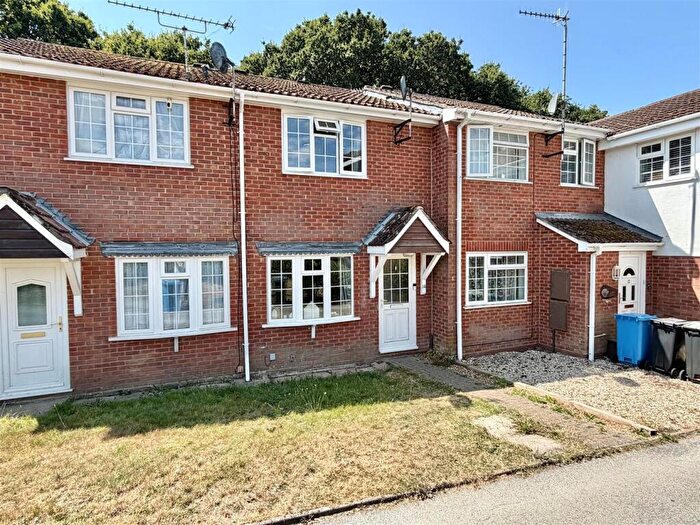
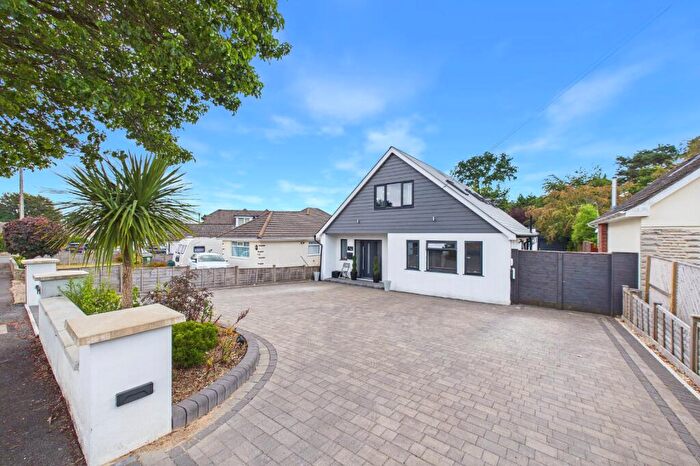
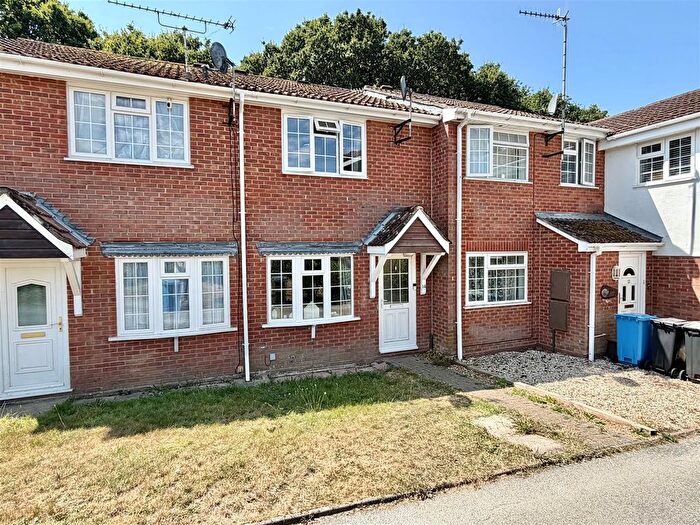
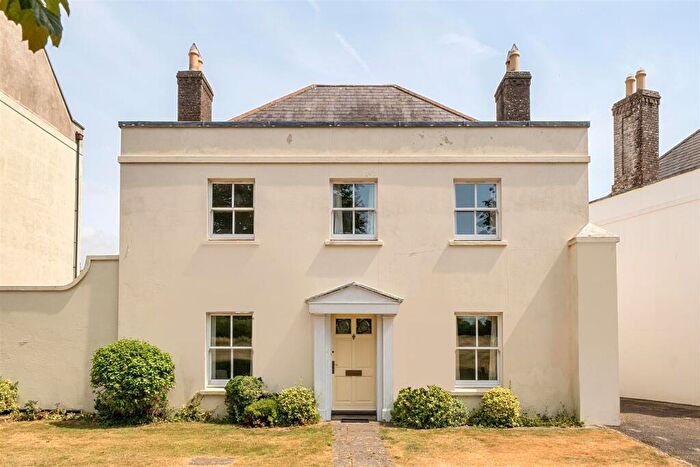
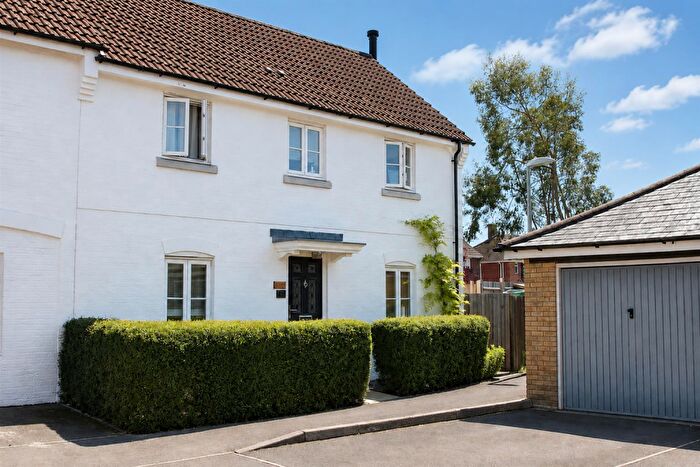
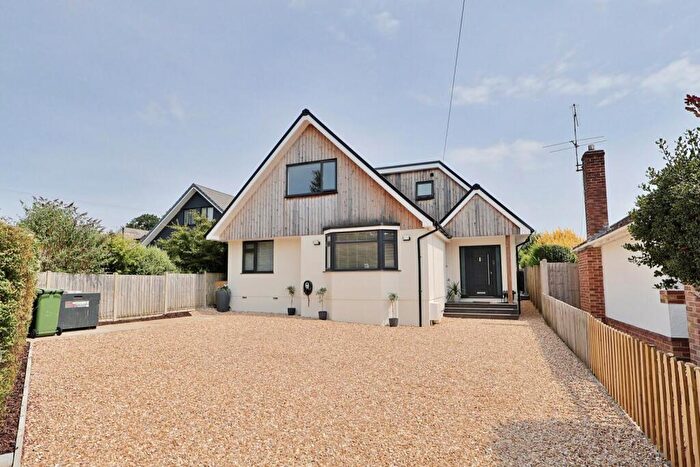
Properties for sale in Dorset
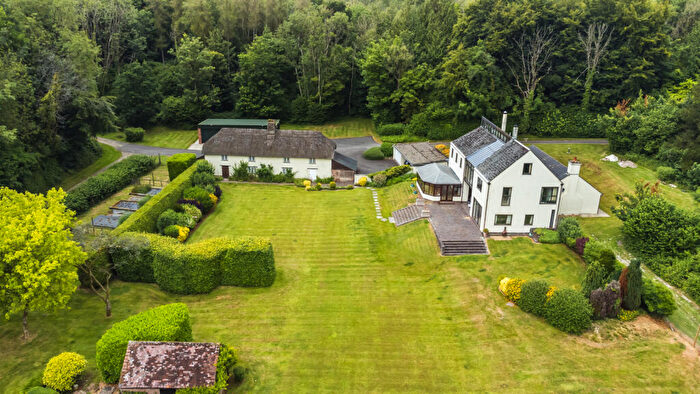


![]()
If you are looking to sell your house, let it out, or receive a property valuation, an expert can help you.
Click the button below to get started.


Towns in Dorset
Navigate through our locations to find the location of your next house in Dorset, England for sale or to rent.
Property price trends in Dorset
According to the latest Land Registry data, the average home in Dorset sold for £375,897 in 2026. That figure comes from a substantial record of 269,404 sales logged over the past 31 years.
Prices have fallen back over the last three years. Compared with 2023, when the typical sale came in around £402,904, that's a fall of roughly 6.7%.
Looking back five years, average prices are down about 1.1% since 2021, a drop of around £4,310 in cash terms.
Zoom out to the past decade for the fuller picture. Back in 2016, homes here averaged £303,708, so the typical sold price has climbed about 23.8% since then, roughly 2.2% a year. Stretch the view to fifteen years and that annual pace edges up closer to 2.5%.
Frequently asked questions about Dorset
What is the average price for a property for sale in Dorset?
The average price for a property for sale in Dorset is £393,065. This amount is 9% higher than the average price in England. There are more than 10,000 property listings for sale in Dorset.
What locations have the most expensive properties for sale in Dorset?
The locations with the most expensive properties for sale in Dorset are Ringwood at an average of £700,369, Broadstone at an average of £659,894 and Chard at an average of £564,237.
What locations have the most affordable properties for sale in Dorset?
The locations with the most affordable properties for sale in Dorset are Axminster at an average of £147,500, Portland at an average of £237,523 and Weymouth at an average of £306,624.
Which train stations are available in or near Dorset?
Some of the train stations available in or near Dorset are Moreton (Dorset), Wool and Wareham.
Property Price Paid in Dorset by Year
The average sold property price by year was:
| Year | Average Sold Price | Price Change |
Sold Properties
|
|---|---|---|---|
| 2026 | £375,897 | -3% |
1,365 Properties |
| 2025 | £387,582 | -1% |
6,957 Properties |
| 2024 | £393,096 | -2% |
6,603 Properties |
| 2023 | £402,904 | -2% |
6,238 Properties |
| 2022 | £412,786 | 8% |
7,687 Properties |
| 2021 | £380,207 | 8% |
10,128 Properties |
| 2020 | £350,828 | 6% |
7,288 Properties |
| 2019 | £328,467 | 0,5% |
7,707 Properties |
| 2018 | £326,892 | 1% |
8,267 Properties |
| 2017 | £324,149 | 6% |
8,742 Properties |
Property Price per Property Type in Dorset
Here you can find historic sold price data in order to help with your property search.
The average Property Paid Price for specific property types in the last three years are:
| Property Type | Average Sold Price | Sold Properties |
|---|---|---|
| Semi Detached House | £351,659.00 | 4,144 Semi Detached Houses |
| Terraced House | £295,500.00 | 5,097 Terraced Houses |
| Detached House | £556,417.00 | 8,201 Detached Houses |
| Flat | £212,798.00 | 3,721 Flats |
Transport in Dorset
Please see below transportation links in this area:
