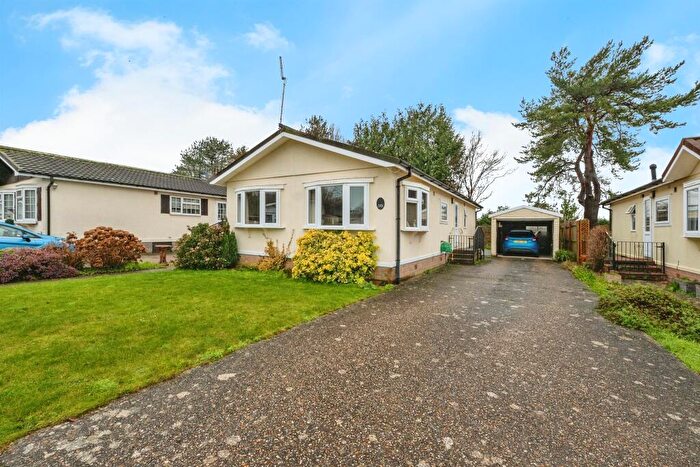
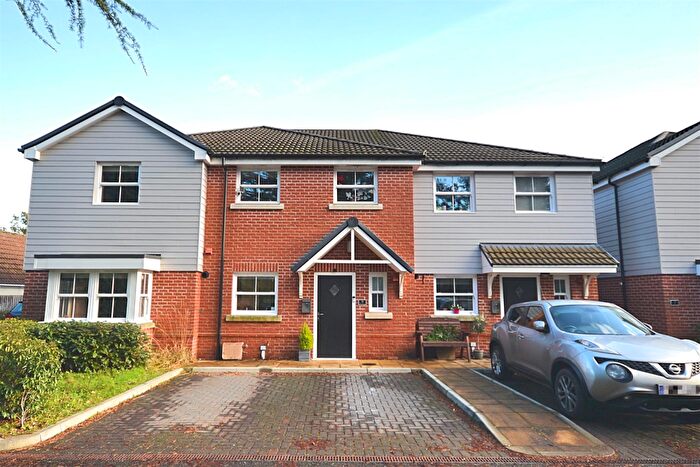
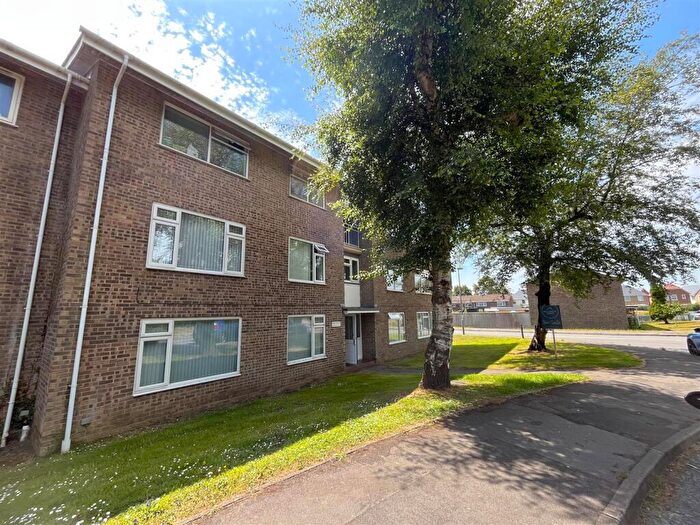
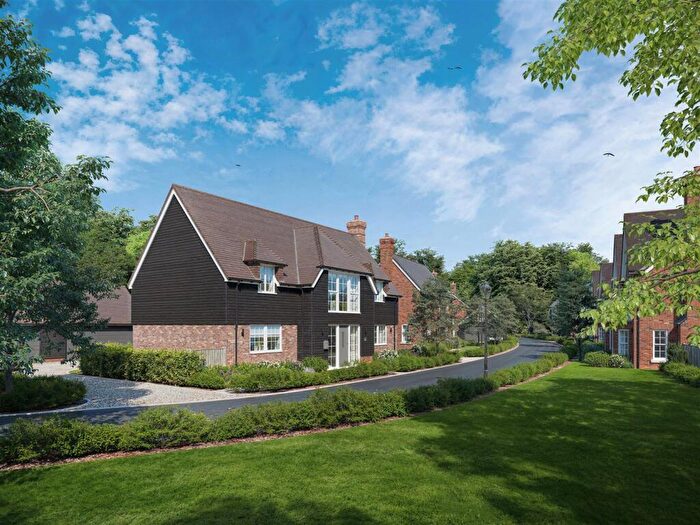
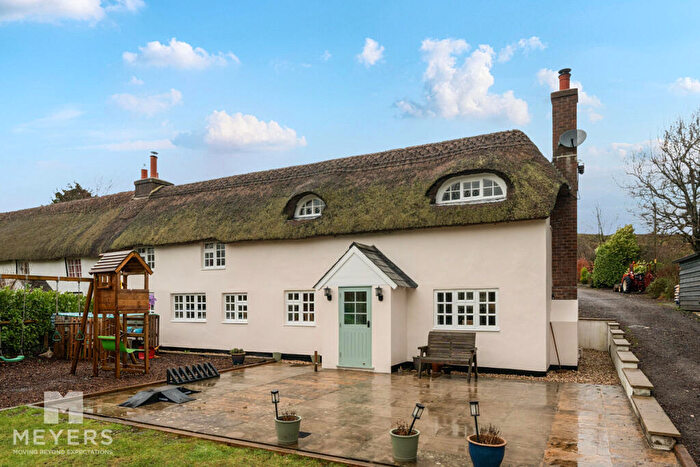
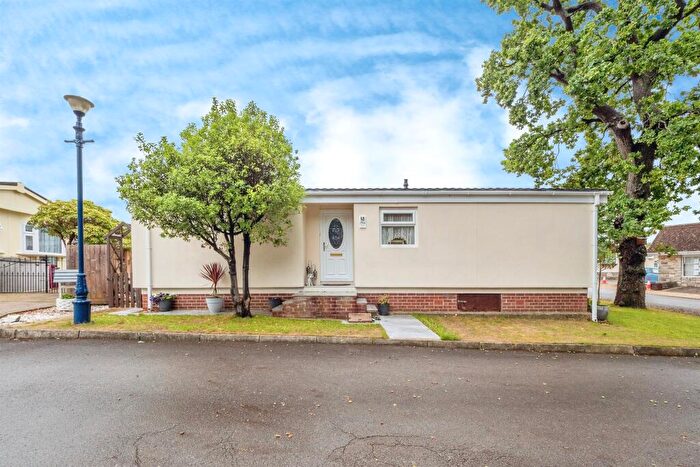
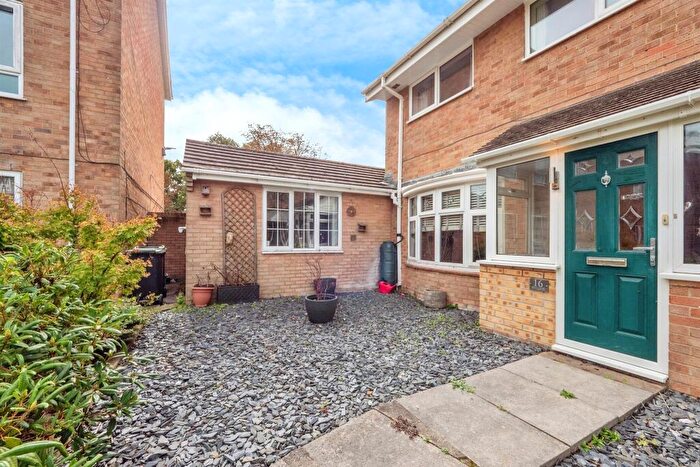
Houses for sale & to rent in Owermoigne, Dorchester
House Prices in Owermoigne
Properties in Owermoigne have an average house price of £383,740.00 and had 119 Property Transactions within the last 3 years¹.
Owermoigne is an area in Dorchester, Dorset with 1,284 households², where the most expensive property was sold for £1,462,220.00.
Properties for sale in Owermoigne
Roads and Postcodes in Owermoigne
Navigate through our locations to find the location of your next house in Owermoigne, Dorchester for sale or to rent.
| Streets | Postcodes |
|---|---|
| Airfield Close | DT2 8TN |
| Arabia Walk | DT2 8WT |
| Besent Walk | DT2 8WW |
| Binghams Road | DT2 8BW |
| Blackwell Walk | DT2 8WS |
| Brewer Walk | DT2 8WN |
| Briars End | DT2 8UD |
| Brough Lane | DT2 8WU |
| Bulbarrow View | DT2 8FL |
| Chilbury Gardens | DT2 8HR |
| Church Lane | DT2 8HS |
| Clouds Hill | DT2 8WJ |
| Clyffe View | DT2 8UT |
| Combe Way | DT2 8BN |
| Dick O Th Banks Road | DT2 8BH DT2 8BJ |
| East Farm Lane | DT2 8XP |
| Egdon Glen | DT2 8BQ |
| Empool Close | DT2 8BX |
| Forest View | DT2 8UR |
| Frome Valley Road | DT2 8WP DT2 8XU |
| Glebeford Close | DT2 8JJ |
| Green Lane | DT2 8BP |
| Greystones Close | DT2 8FB |
| Heathlands Close | DT2 8TS |
| Hollands Mead Avenue | DT2 8HX |
| Hope Close | DT2 8TT |
| Hurricane Close | DT2 8TY |
| Kit Lane | DT2 8HP |
| Lawrence Crescent | DT2 8WL |
| Lington Close | DT2 8XQ |
| Moreton Road | DT2 8DX DT2 8HT DT2 8HY DT2 8HZ |
| Mount Skippet Way | DT2 8BU DT2 8TP |
| Moynton Close | DT2 8TX |
| Oaklands Park | DT2 8JQ |
| Old Farm Way | DT2 8TU |
| Old School Lane | DT2 8FQ |
| Pauls Way | DT2 8UP DT2 8UW |
| Pollards Lane | DT2 8XD |
| Pollys Close | DT2 8FH |
| Poxwell Cottages | DT2 8NA |
| Rectory Cottages | DT2 8HF |
| Redbridge Lane | DT2 8DU |
| Redbridge Road | DT2 8BG |
| Roman Hill | DT2 8LY |
| School Drive | DT2 8WR |
| Spitfire Close | DT2 8TZ |
| Squadron Place | DT2 8ZG DT2 8ZH DT2 8ZJ |
| Upton | DT2 8NE |
| Vyse Barn Cottages | DT2 8HH |
| Wareham Road | DT2 8BY DT2 8HL DT2 8HN |
| Warmwell Road | DT2 8BS |
| Woodbury Drove | DT2 8XT |
| Woodsford Close | DT2 8XS |
| Woodsford Road | DT2 8UU |
| Yalbury Lane | DT2 8XR |
| DT2 8AT DT2 8BL DT2 8BT DT2 8BZ DT2 8HQ DT2 8JF DT2 8LZ DT2 8NB DT2 8ND DT2 8NF DT2 8NG DT2 8NJ DT2 8NQ DT2 8QP DT2 8QR |
Transport near Owermoigne
- FAQ
- Price Paid By Year
- Property Type Price
Frequently asked questions about Owermoigne
What is the average price for a property for sale in Owermoigne?
The average price for a property for sale in Owermoigne is £383,740. This amount is 1% higher than the average price in Dorchester. There are 986 property listings for sale in Owermoigne.
What streets have the most expensive properties for sale in Owermoigne?
The streets with the most expensive properties for sale in Owermoigne are Pollards Lane at an average of £725,000, Bulbarrow View at an average of £603,500 and Moreton Road at an average of £495,000.
What streets have the most affordable properties for sale in Owermoigne?
The streets with the most affordable properties for sale in Owermoigne are Mount Skippet Way at an average of £202,333, Pauls Way at an average of £252,500 and Brewer Walk at an average of £274,750.
Which train stations are available in or near Owermoigne?
Some of the train stations available in or near Owermoigne are Moreton (Dorset), Dorchester South and Wool.
Property Price Paid in Owermoigne by Year
The average sold property price by year was:
| Year | Average Sold Price | Price Change |
Sold Properties
|
|---|---|---|---|
| 2025 | £380,192 | 3% |
39 Properties |
| 2024 | £369,409 | -9% |
42 Properties |
| 2023 | £403,222 | 11% |
38 Properties |
| 2022 | £359,459 | -6% |
55 Properties |
| 2021 | £382,389 | 15% |
59 Properties |
| 2020 | £324,137 | 5% |
51 Properties |
| 2019 | £306,715 | -4% |
61 Properties |
| 2018 | £319,916 | 9% |
48 Properties |
| 2017 | £290,830 | 0,1% |
50 Properties |
| 2016 | £290,630 | 9% |
57 Properties |
| 2015 | £265,383 | 12% |
44 Properties |
| 2014 | £232,848 | 1% |
79 Properties |
| 2013 | £229,519 | -3% |
73 Properties |
| 2012 | £236,609 | -7% |
56 Properties |
| 2011 | £253,961 | 9% |
51 Properties |
| 2010 | £231,320 | -5% |
44 Properties |
| 2009 | £242,375 | 1% |
49 Properties |
| 2008 | £239,784 | 6% |
33 Properties |
| 2007 | £225,360 | -13% |
81 Properties |
| 2006 | £253,852 | 7% |
85 Properties |
| 2005 | £234,907 | 4% |
63 Properties |
| 2004 | £226,369 | 10% |
44 Properties |
| 2003 | £204,357 | 19% |
46 Properties |
| 2002 | £166,491 | 21% |
51 Properties |
| 2001 | £131,496 | -9% |
55 Properties |
| 2000 | £143,500 | 28% |
49 Properties |
| 1999 | £102,987 | -26% |
81 Properties |
| 1998 | £130,262 | 35% |
52 Properties |
| 1997 | £85,075 | 5% |
82 Properties |
| 1996 | £81,149 | 15% |
67 Properties |
| 1995 | £68,812 | - |
45 Properties |
Property Price per Property Type in Owermoigne
Here you can find historic sold price data in order to help with your property search.
The average Property Paid Price for specific property types in the last three years are:
| Property Type | Average Sold Price | Sold Properties |
|---|---|---|
| Semi Detached House | £337,450.00 | 25 Semi Detached Houses |
| Detached House | £417,319.00 | 68 Detached Houses |
| Terraced House | £307,863.00 | 22 Terraced Houses |
| Flat | £519,542.00 | 4 Flats |

