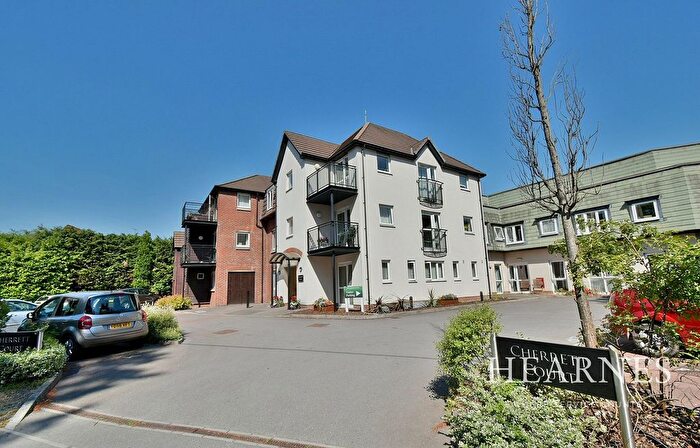
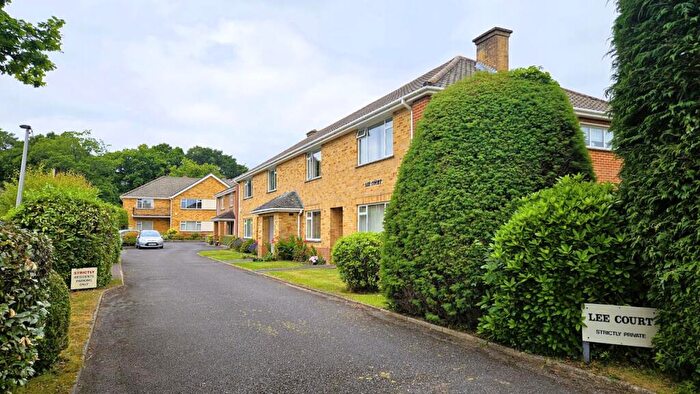
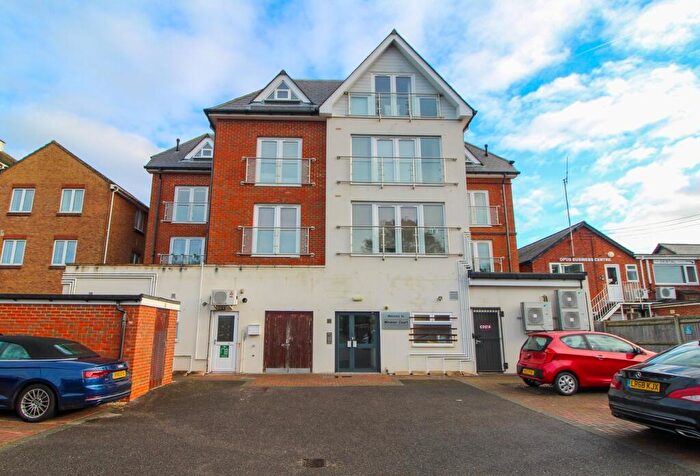
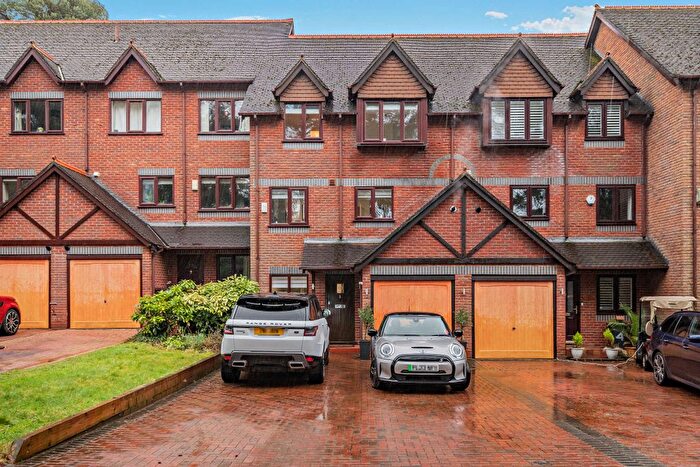
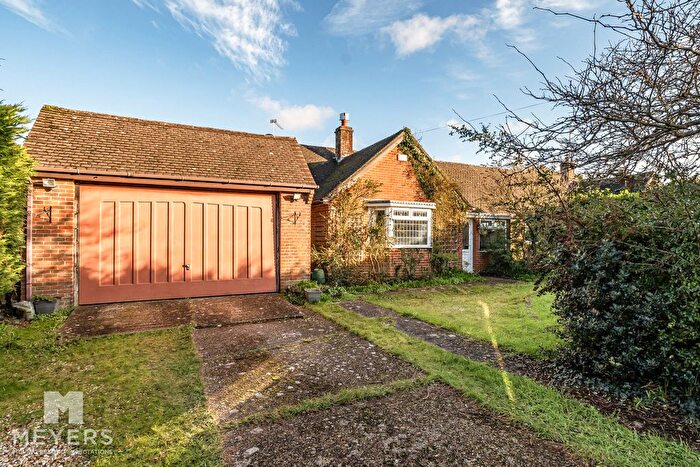
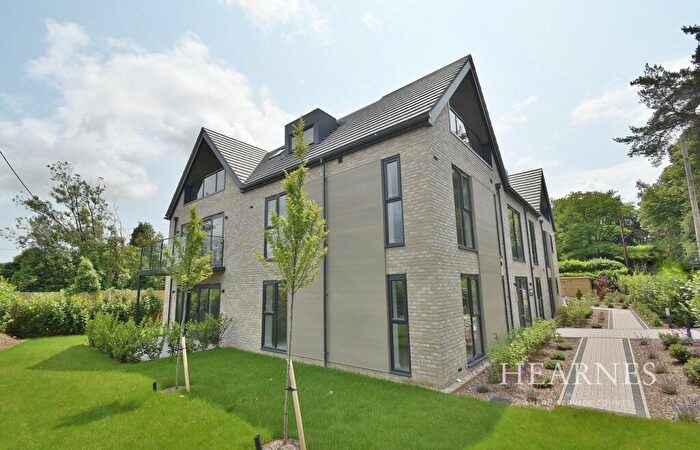
Houses for sale & to rent in Ferndown Links, Ferndown
House Prices in Ferndown Links
Properties in Ferndown Links have an average house price of £397,471.00 and had 256 Property Transactions within the last 3 years¹.
Ferndown Links is an area in Ferndown, Dorset with 2,224 households², where the most expensive property was sold for £1,630,000.00.
Properties for sale in Ferndown Links
Roads and Postcodes in Ferndown Links
Navigate through our locations to find the location of your next house in Ferndown Links, Ferndown for sale or to rent.
| Streets | Postcodes |
|---|---|
| Ameys Lane | BH22 8AY |
| Apple Tree Grove | BH22 9LA |
| Barns Road | BH22 8AF BH22 8AG BH22 8XG BH22 8XH BH22 8XQ |
| Bolton Crescent | BH22 8AQ |
| Carroll Avenue | BH22 8BP BH22 8BW |
| Chander Close | BH22 8DW |
| Corbin Avenue | BH22 8AE BH22 8AZ |
| Craigwood Drive | BH22 8DP |
| Derwent Close | BH22 8UY |
| Dorset Avenue | BH22 8HJ BH22 8HL BH22 8HN BH22 8HW |
| Dudsbury Avenue | BH22 8DQ BH22 8DS BH22 8DT BH22 8DU BH22 8DX BH22 8DY BH22 8EY |
| Dudsbury Crescent | BH22 8JD BH22 8JF BH22 8JG |
| Dugdell Close | BH22 8BH BH22 8BJ BH22 8BQ |
| Emberly Close | BH22 8AH |
| Fairways | BH22 8BA BH22 8BB |
| Fernlea Avenue | BH22 8HE BH22 8HF BH22 8HG |
| Fernlea Close | BH22 8HH |
| Fernlea Gardens | BH22 8HQ |
| Ford Close | BH22 8AA |
| Ford Lane | BH22 8AB BH22 8AD |
| Gleneagles Close | BH22 8DE |
| Glenmoor Road | BH22 8JL |
| Golf Links Road | BH22 8BT BH22 8BU BH22 8BY BH22 8BZ BH22 8EZ |
| Greensome Drive | BH22 8BE |
| Humber Road | BH22 8XN |
| Lockyers Drive | BH22 8AJ BH22 8AL BH22 8AN |
| Medway Road | BH22 8UR BH22 8US BH22 8UT BH22 8UU BH22 8UX |
| Melbury Close | BH22 8HR |
| Morden Avenue | BH22 8HS BH22 8HT |
| New Road | BH22 8EG BH22 8EH BH22 8EJ BH22 8EQ BH22 8EU BH22 8EX |
| Old Pines Close | BH22 8DR |
| Orchard Close | BH22 8BS |
| Petwyn Close | BH22 8BG |
| Pickard Road | BH22 8AX |
| Pringles Close | BH22 8DD |
| Pringles Drive | BH22 8BN |
| Ringwood Road | BH22 9AS BH22 9AT BH22 9AU BH22 9AX BH22 9AY BH22 9AZ BH22 9BS |
| Severn Road | BH22 8XB BH22 8XD |
| Sherborne Drive | BH22 8HU |
| Stalbridge Drive | BH22 8HY |
| Stapleford Avenue | BH22 8BD |
| Tamar Close | BH22 8XE BH22 8XF |
| Thames Close | BH22 8XA |
| Trent Way | BH22 8UZ |
| Tricketts Lane | BH22 8AT BH22 8AU |
| Turbary Road | BH22 8AP BH22 8AR BH22 8AS BH22 8AW |
| Wincombe Close | BH22 8HZ |
| Wincombe Drive | BH22 8HX |
| Woodacre Gardens | BH22 8LD |
Transport near Ferndown Links
-
Bournemouth Station
-
Branksome Station
-
Pokesdown Station
-
Christchurch Station
-
Parkstone Station
-
Poole Station
-
Hamworthy Station
-
Hinton Admiral Station
- FAQ
- Price Paid By Year
- Property Type Price
Frequently asked questions about Ferndown Links
What is the average price for a property for sale in Ferndown Links?
The average price for a property for sale in Ferndown Links is £397,471. This amount is 9% lower than the average price in Ferndown. There are 1,062 property listings for sale in Ferndown Links.
What streets have the most expensive properties for sale in Ferndown Links?
The streets with the most expensive properties for sale in Ferndown Links are Orchard Close at an average of £1,107,500, Golf Links Road at an average of £861,500 and Sherborne Drive at an average of £712,500.
What streets have the most affordable properties for sale in Ferndown Links?
The streets with the most affordable properties for sale in Ferndown Links are Thames Close at an average of £202,000, Trent Way at an average of £225,083 and Ringwood Road at an average of £226,872.
Which train stations are available in or near Ferndown Links?
Some of the train stations available in or near Ferndown Links are Bournemouth, Branksome and Pokesdown.
Property Price Paid in Ferndown Links by Year
The average sold property price by year was:
| Year | Average Sold Price | Price Change |
Sold Properties
|
|---|---|---|---|
| 2025 | £416,208 | 10% |
84 Properties |
| 2024 | £375,064 | -7% |
89 Properties |
| 2023 | £402,536 | -17% |
83 Properties |
| 2022 | £468,971 | 14% |
106 Properties |
| 2021 | £403,955 | 5% |
134 Properties |
| 2020 | £383,246 | 7% |
90 Properties |
| 2019 | £356,477 | -2% |
87 Properties |
| 2018 | £364,375 | 4% |
81 Properties |
| 2017 | £350,688 | -1% |
131 Properties |
| 2016 | £353,776 | 20% |
131 Properties |
| 2015 | £281,642 | 2% |
122 Properties |
| 2014 | £276,268 | -2% |
138 Properties |
| 2013 | £282,276 | 3% |
104 Properties |
| 2012 | £274,582 | 3% |
97 Properties |
| 2011 | £265,318 | -1% |
90 Properties |
| 2010 | £267,088 | 4% |
101 Properties |
| 2009 | £256,117 | -10% |
92 Properties |
| 2008 | £282,375 | 6% |
56 Properties |
| 2007 | £265,616 | 2% |
159 Properties |
| 2006 | £260,776 | 20% |
176 Properties |
| 2005 | £209,781 | -12% |
114 Properties |
| 2004 | £235,778 | 17% |
144 Properties |
| 2003 | £194,574 | 3% |
135 Properties |
| 2002 | £189,599 | 17% |
191 Properties |
| 2001 | £156,567 | 16% |
148 Properties |
| 2000 | £132,229 | 18% |
137 Properties |
| 1999 | £108,883 | 1% |
140 Properties |
| 1998 | £107,681 | 9% |
138 Properties |
| 1997 | £98,337 | 16% |
161 Properties |
| 1996 | £82,294 | 2% |
161 Properties |
| 1995 | £80,850 | - |
111 Properties |
Property Price per Property Type in Ferndown Links
Here you can find historic sold price data in order to help with your property search.
The average Property Paid Price for specific property types in the last three years are:
| Property Type | Average Sold Price | Sold Properties |
|---|---|---|
| Semi Detached House | £313,852.00 | 17 Semi Detached Houses |
| Detached House | £577,447.00 | 115 Detached Houses |
| Terraced House | £269,211.00 | 41 Terraced Houses |
| Flat | £228,590.00 | 83 Flats |

