
Houses for sale in Cranborne Chase, Salisbury
House Prices in Cranborne Chase
Properties in Cranborne Chase have an average house price of £543k and had 8 Property Transactions within the last 3 years¹.
Cranborne Chase is an area in Salisbury, Dorset with 150 households², where the most expensive property was sold for £690k.
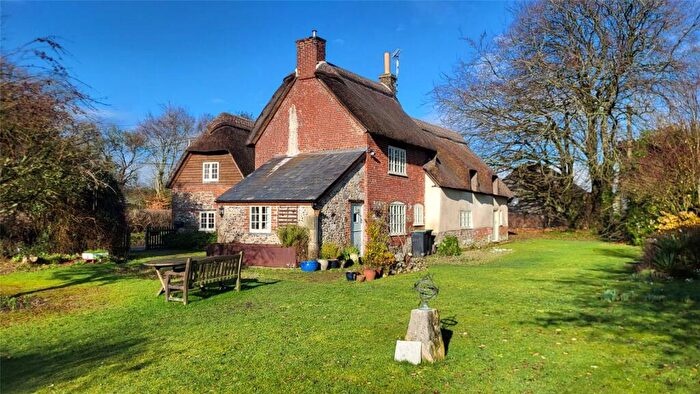
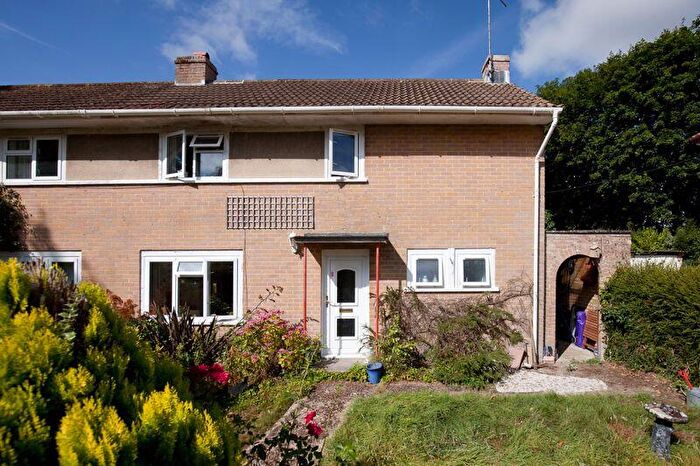
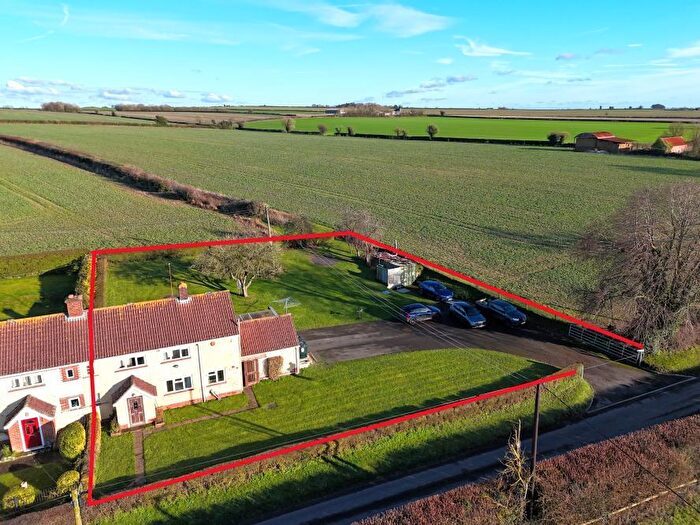
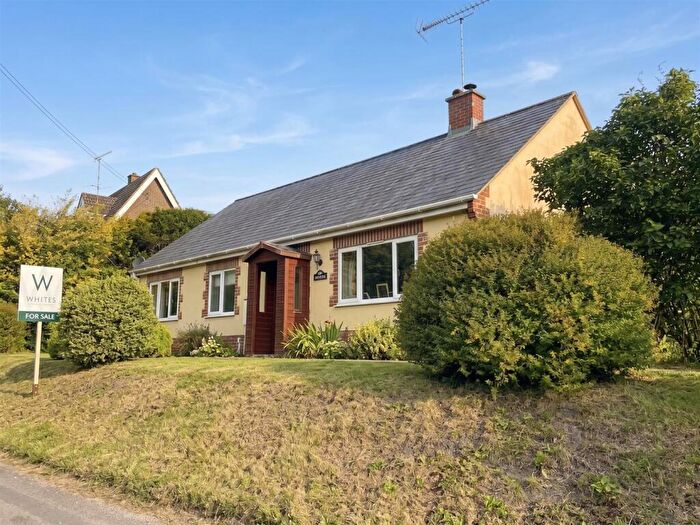
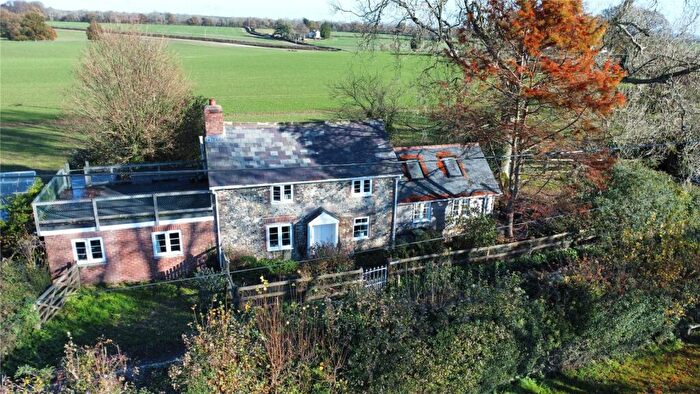
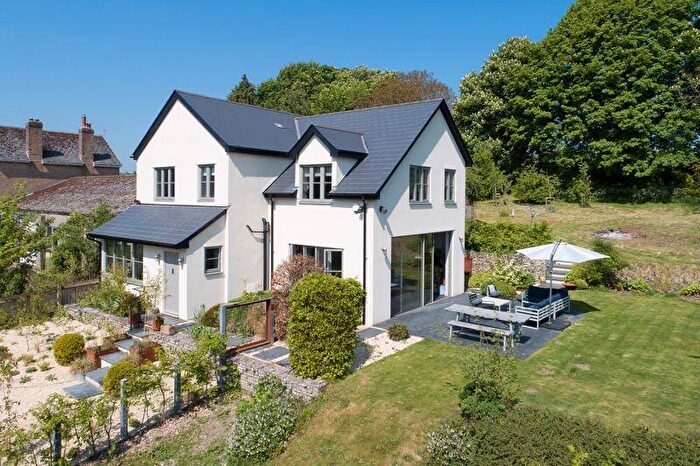
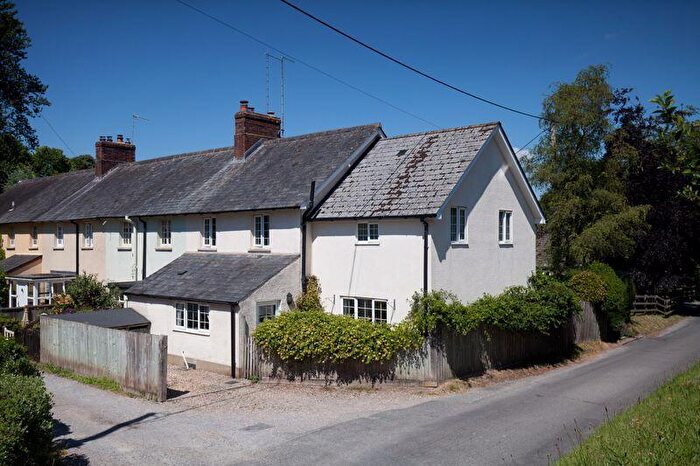
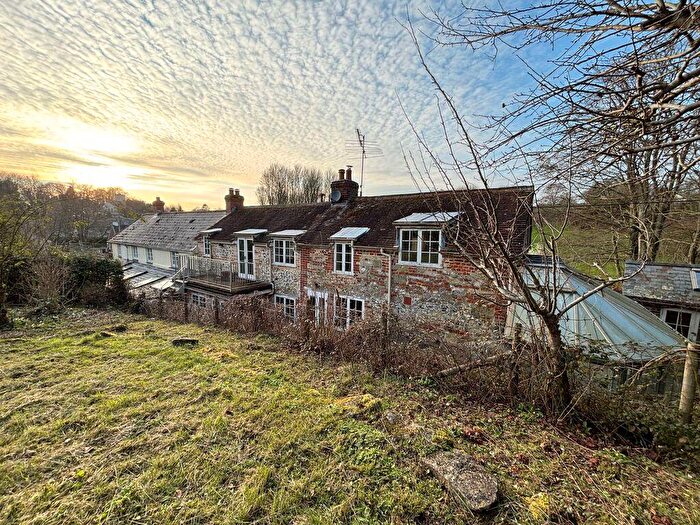
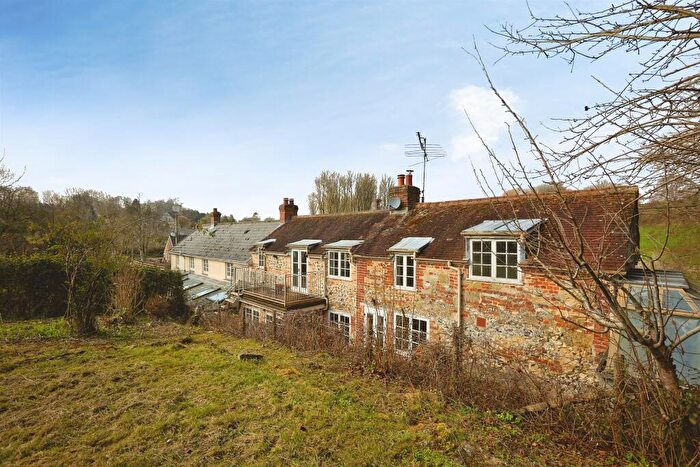
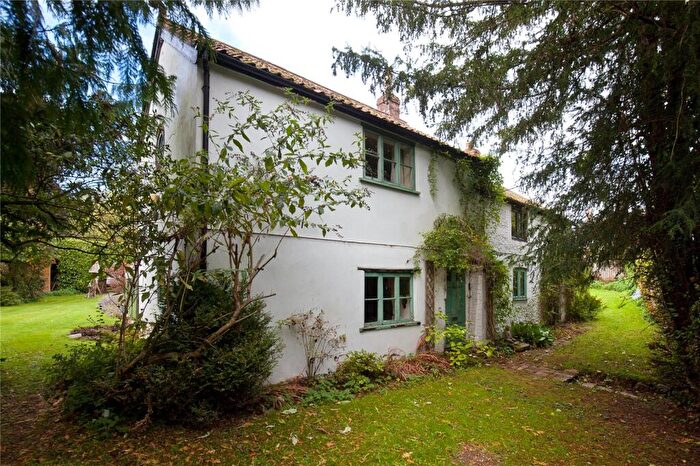
Properties for sale in Cranborne Chase
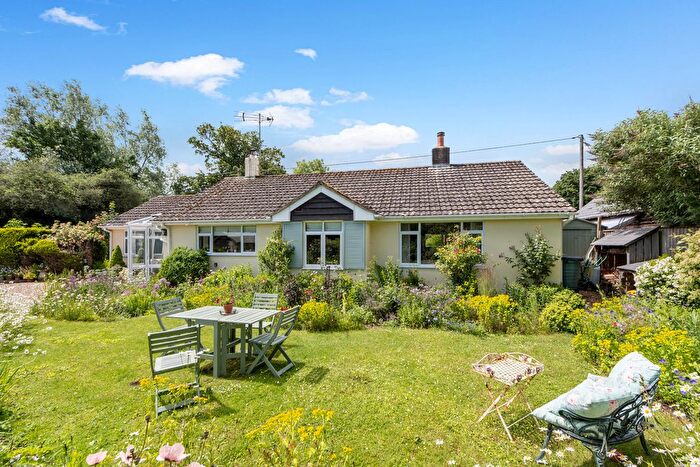
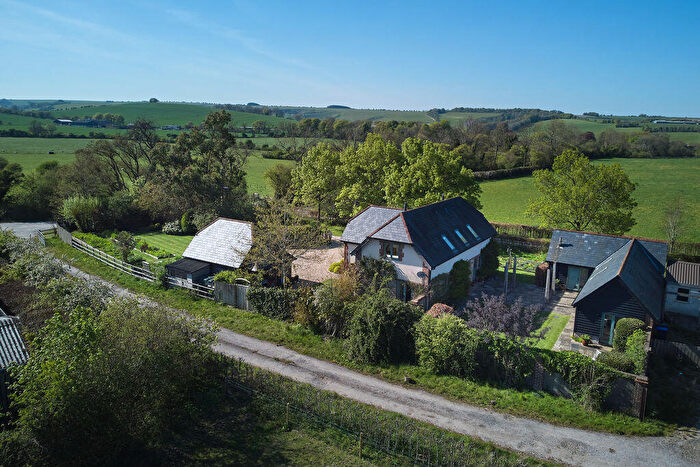
![]()
If you are looking to sell your house, let it out, or receive a property valuation, an expert can help you.
Click the button below to get started.
Roads and Postcodes in Cranborne Chase
Navigate through our locations to find the location of your next house in Cranborne Chase, Salisbury for sale or to rent.
| Streets | Postcodes |
|---|---|
| Brushy Bush Lane | SP5 5PJ |
| Buddens Row | SP5 5AD |
| Church Cottages | SP5 5AF |
| Church Farm Close | SP5 5DF |
| Common Road | SP5 5NL SP5 5NN |
| Green Close | SP5 5NG |
| Green Lane | SP5 5AJ SP5 5AQ |
| Handley Park | SP5 5PL |
| High Street | SP5 5AE |
| Hillview | SP5 5PG |
| Noade Street | SP5 5AA |
| Pentridge | SP5 5QU |
| Sixpenny Handley | SP5 5NT SP5 5PQ SP5 5QP |
| Well Bottom | SP5 5AN |
| SP5 5QS SP5 5RA SP5 5RJ SP5 5RQ SP5 5RU SP5 5RY |
Property price trends in Cranborne Chase
According to the latest Land Registry data, the average home in Cranborne Chase sold for £488,333 in 2025. That figure comes from 111 sales logged over the past 30 years.
Prices have continued to climb over the last three years. Compared with 2022, when the typical sale came in around £217,000, that's a rise of roughly 125%.
Looking back five years, average prices are down about 28.7% since 2020, a drop of around £196,333 in cash terms.
Zoom out to the past decade for the fuller picture. Back in 2015, homes here averaged £486,000, so the typical sold price has climbed about 0.5% since then, roughly 0% a year. Stretch the view to fifteen years and that annual pace edges up closer to 2.3%.
Frequently asked questions about Cranborne Chase
What is the average price for a property for sale in Cranborne Chase?
The average price for a property for sale in Cranborne Chase is £542,500. This amount is 26% higher than the average price in Salisbury. There are 201 property listings for sale in Cranborne Chase.
What streets have the most expensive properties for sale in Cranborne Chase?
The street with the most expensive properties for sale in Cranborne Chase is Green Lane at an average of £635,000.
What streets have the most affordable properties for sale in Cranborne Chase?
The street with the most affordable properties for sale in Cranborne Chase is Noade Street at an average of £540,000.
Which train stations are available in or near Cranborne Chase?
Some of the train stations available in or near Cranborne Chase are Tisbury, Gillingham (Dorset) and Salisbury.
Property Price Paid in Cranborne Chase by Year
The average sold property price by year was:
| Year | Average Sold Price | Price Change |
Sold Properties
|
|---|---|---|---|
| 2025 | £488,333 | -2% |
3 Properties |
| 2024 | £497,500 | -26% |
2 Properties |
| 2023 | £626,666 | 65% |
3 Properties |
| 2022 | £217,000 | -386% |
1 Property |
| 2021 | £1,055,000 | 35% |
5 Properties |
| 2020 | £684,666 | -10% |
3 Properties |
| 2019 | £755,000 | 76% |
3 Properties |
| 2018 | £177,500 | -239% |
1 Property |
| 2016 | £601,750 | 19% |
4 Properties |
| 2015 | £486,000 | -20% |
5 Properties |
Property Price per Property Type in Cranborne Chase
Here you can find historic sold price data in order to help with your property search.
The average Property Paid Price for specific property types in the last three years are:
| Property Type | Average Sold Price | Sold Properties |
|---|---|---|
| Semi Detached House | £473,000.00 | 5 Semi Detached Houses |
| Detached House | £658,333.00 | 3 Detached Houses |
