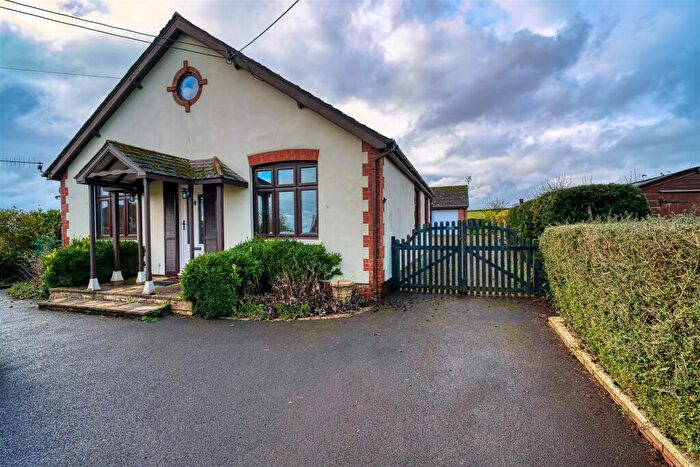
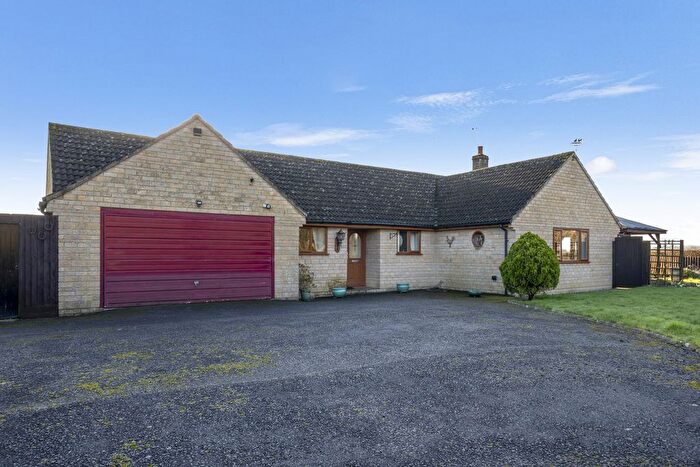
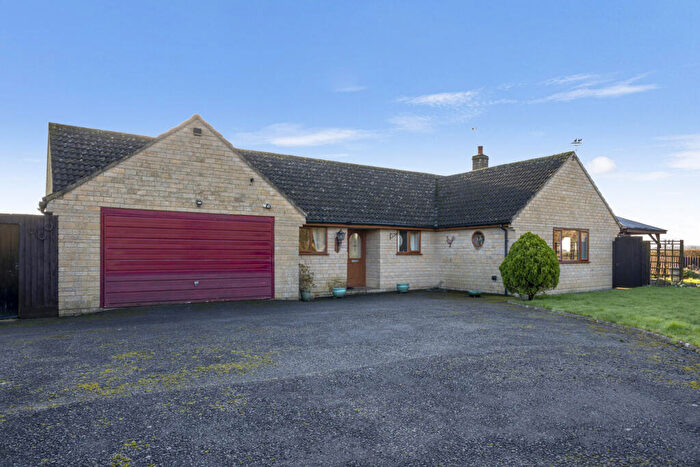
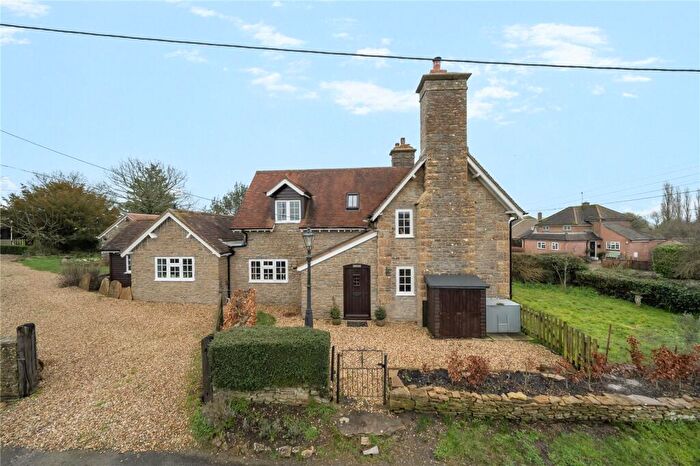
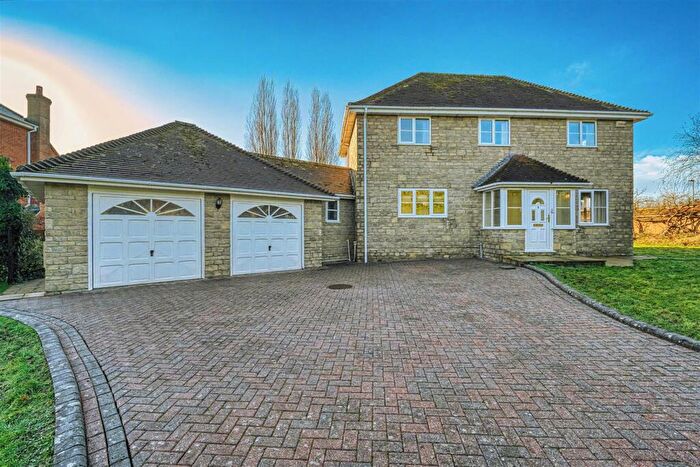
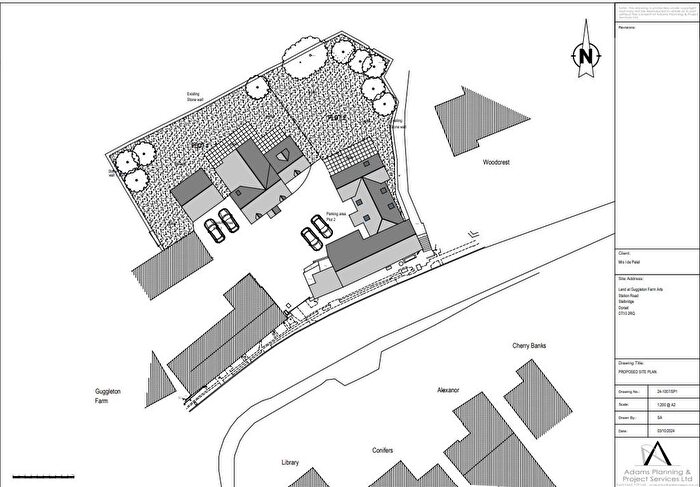
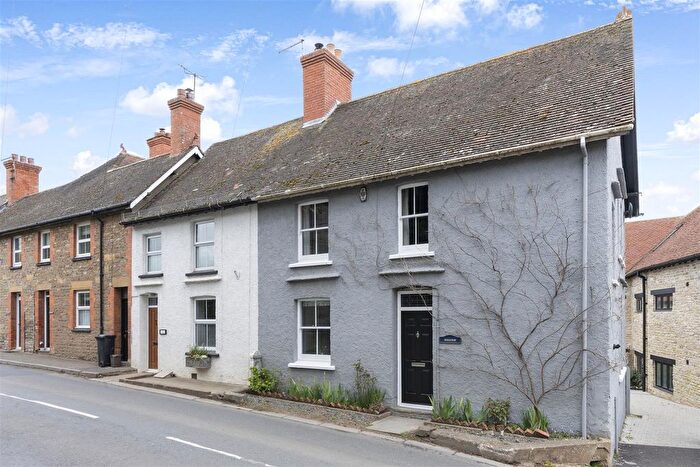
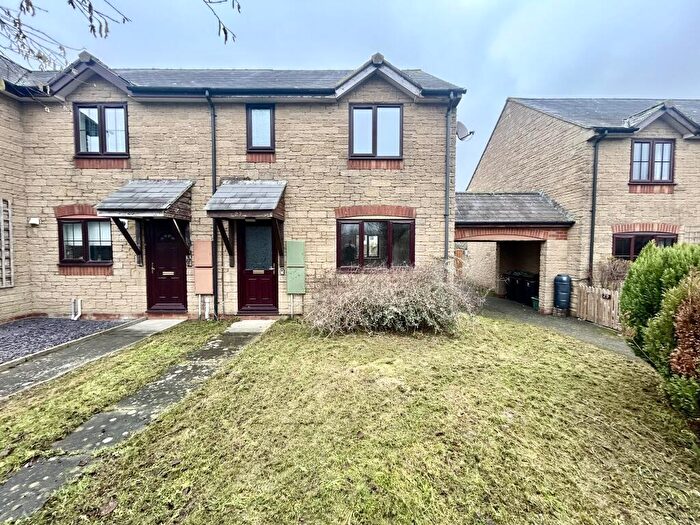
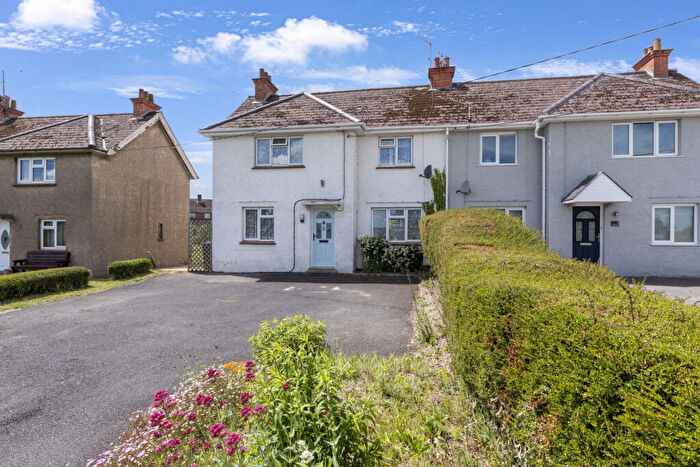
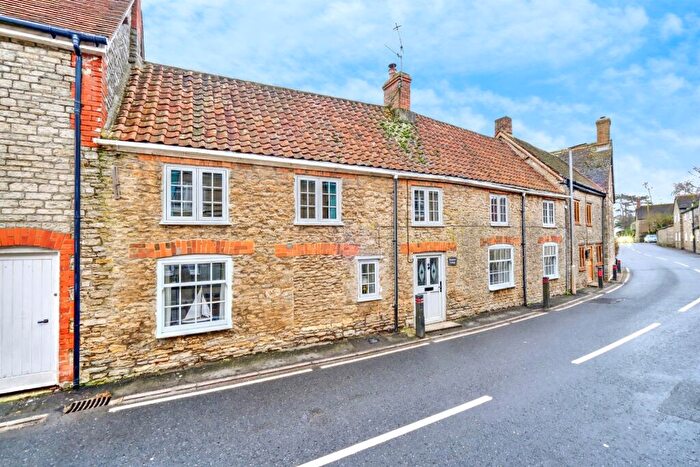
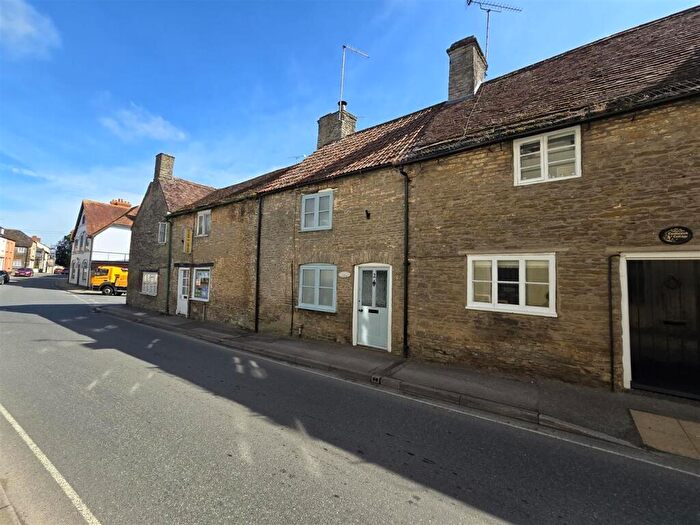
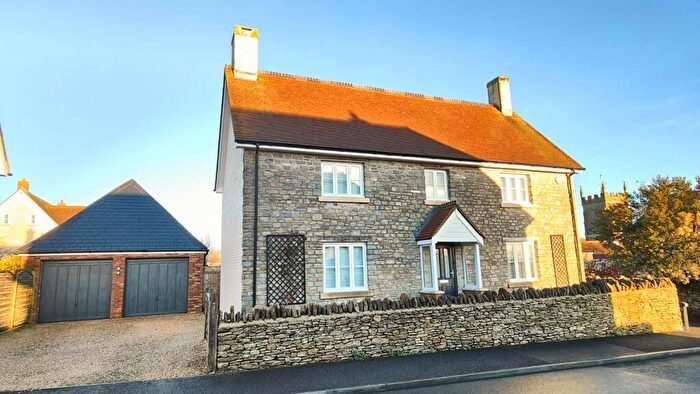
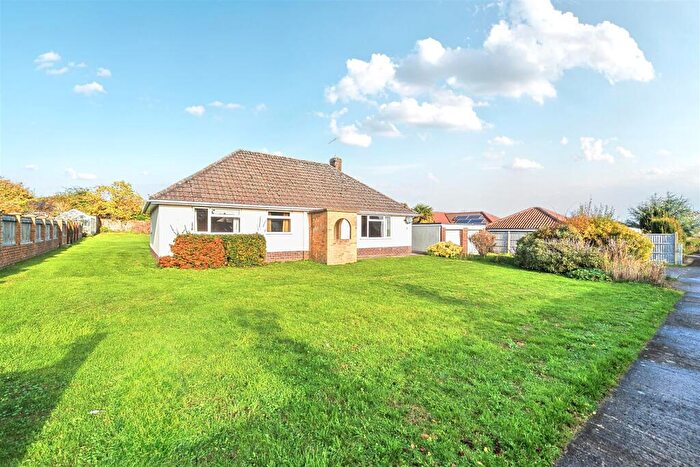
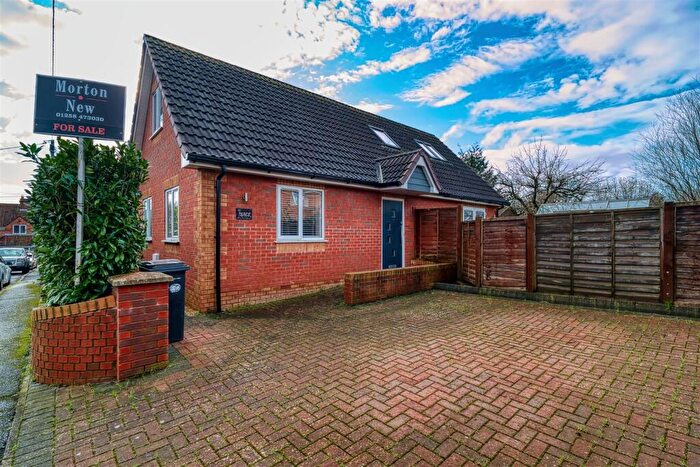
Houses for sale & to rent in Blackmore, Sturminster Newton
House Prices in Blackmore
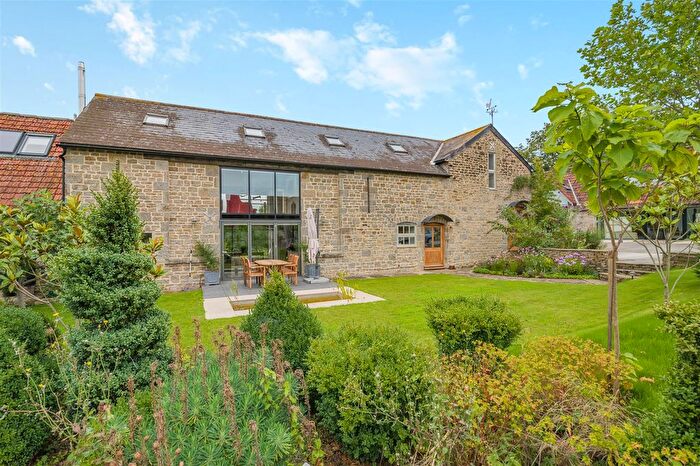
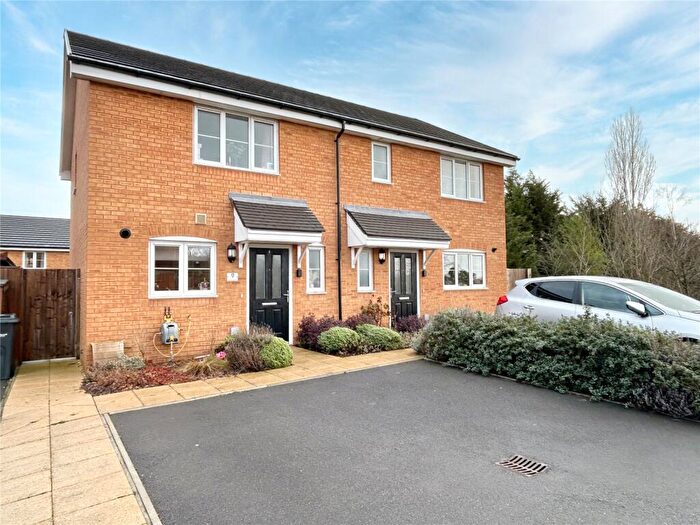
Properties in Blackmore have an average house price of £386,496.00 and had 149 Property Transactions within the last 3 years¹.
Blackmore is an area in Sturminster Newton, Dorset with 1,377 households², where the most expensive property was sold for £1,185,000.00.
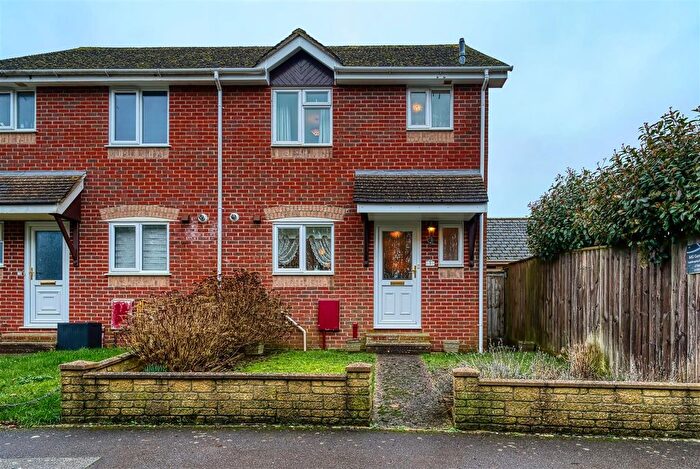
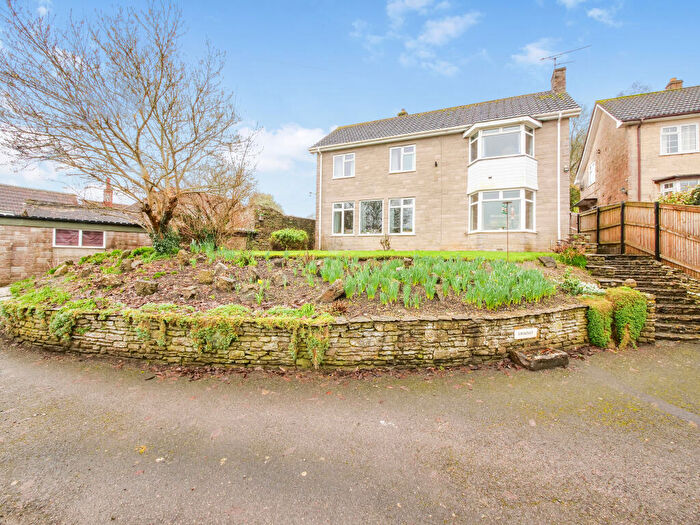
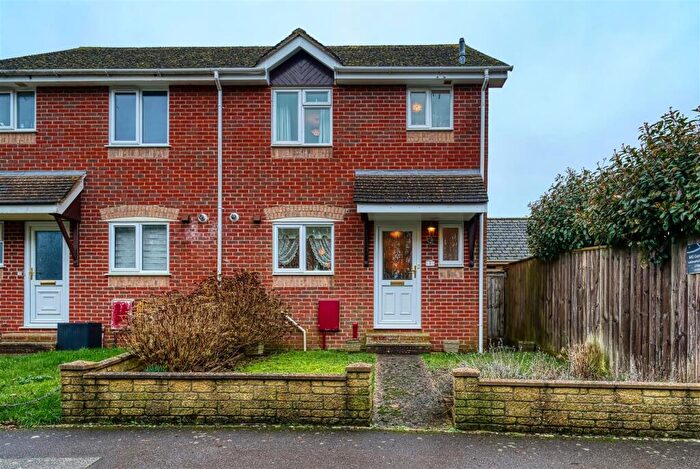
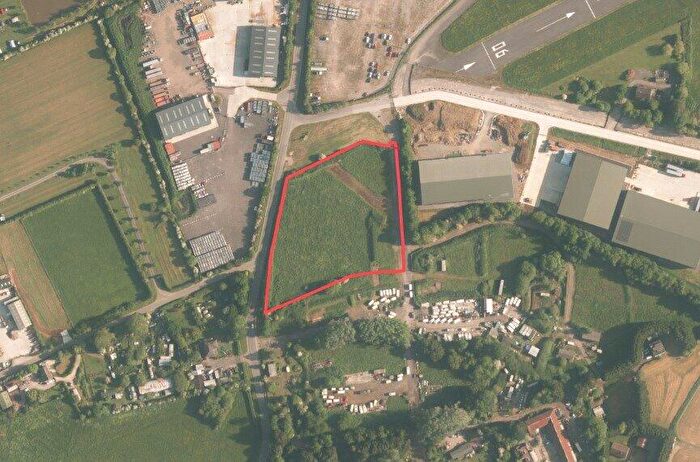
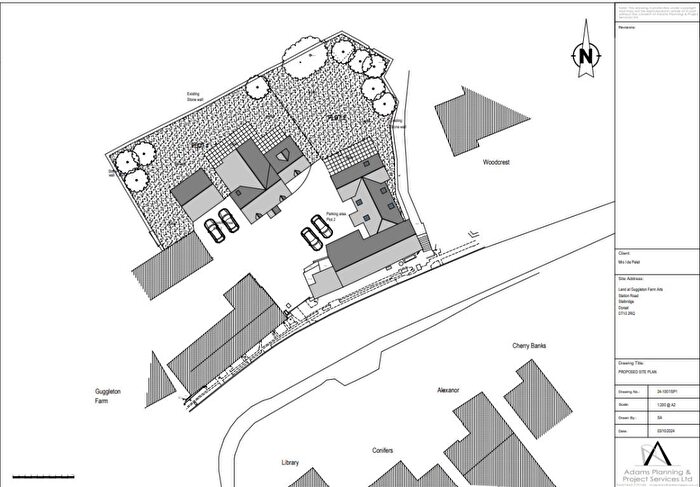
Properties for sale in Blackmore
Roads and Postcodes in Blackmore
Navigate through our locations to find the location of your next house in Blackmore, Sturminster Newton for sale or to rent.
| Streets | Postcodes |
|---|---|
| Anglesea Cottages | DT10 2NE |
| Bakers Field | DT10 2FB |
| Barrow Hill | DT10 2LD DT10 2QT DT10 2QU DT10 2QX |
| Barrowlea | DT10 2QY |
| Bibberne Row | DT10 2QA |
| Blackmore Road | DT10 2NT DT10 2NU |
| Boyle Close | DT10 2PB |
| Brimble Cottages | DT10 2JS |
| Broad Common Cottages | DT10 2BE |
| Cale Close | DT10 2PG |
| Cat Lane | DT10 2JX |
| Caundle Lane | DT10 2JU DT10 2JY |
| Church Hill | DT10 2LR DT10 2LS |
| Church Hill Cottages | DT10 2LT |
| Deer Park Cottages | DT10 2HU |
| Devonshire Houses | DT10 2LN |
| Drews Lane | DT10 2LU |
| Drove Close | DT10 2QH |
| Duck Lane | DT10 2LP |
| Duncliffe Close | DT10 2NX |
| Gold Street | DT10 2LX |
| Grosvenor Road | DT10 2PL DT10 2PN |
| Grove Lane | DT10 2RD |
| Grove Lane Close | DT10 2RF |
| Hardy Crescent | DT10 2PD |
| High Street | DT10 2LH DT10 2LJ DT10 2LL |
| Holwell Road | DT10 2BA DT10 2BB |
| Jarvis Close | DT10 2PQ |
| Jarvis Way | DT10 2NN DT10 2NP DT10 2NR DT10 2NW |
| Kings Mill Lane | DT10 2SN |
| Larks Meadow | DT10 2LF |
| Lower Road | DT10 2NJ DT10 2NL |
| Lydlinch Common | DT10 2JD |
| Meadow Close | DT10 2NZ |
| New Road | DT10 2PE |
| Old Market Mews | DT10 2SU |
| Old Orchard Close | DT10 2HY |
| Park Grove | DT10 2RA |
| Park Road | DT10 2RB |
| Platts | DT10 2HX |
| Pound Close | DT10 2PW |
| Raleigh Road | DT10 2NY |
| Ridge View | DT10 2QJ |
| Ring Street | DT10 2LZ DT10 2NF DT10 2QR |
| Robinson Heights | DT10 2PA |
| Rowden Mill Lane | DT10 2JT |
| Springfields | DT10 2NA |
| Stalbridge | DT10 2RS DT10 2SF DT10 2SW |
| Stalbridge Common | DT10 2SJ |
| Stalbridge Road | DT10 2JG |
| Stapleford Court | DT10 2FD |
| Station Road | DT10 2RG DT10 2RJ DT10 2RQ |
| The Cutting | DT10 2FA |
| The Hawthorns | DT10 2PU |
| The Paddocks | DT10 2PZ |
| The Ring | DT10 2NG |
| Thornhill | DT10 2SG DT10 2SH DT10 2SQ |
| Thornhill Road | DT10 2PR DT10 2PS |
| Thrift Close | DT10 2LE |
| Vale Road | DT10 2NS |
| Verandas | DT10 2LY |
| Warrbridge | DT10 2JE |
| Waterlake | DT10 2PT |
| Waterloo Lane | DT10 2JF |
| Wessex Road | DT10 2PF |
| West End Mews | DT10 2NQ |
| West Mill Lane | DT10 2RU |
| West Pound Cottages | DT10 2JZ |
| Westminster Buildings | DT10 2PP |
| Westminster Cottages | DT10 2PH DT10 2PJ |
| White Hart Close | DT10 2AX |
| Wood Lane | DT10 2QZ |
| Woodmill Close | DT10 2ST |
| DT10 2AG DT10 2AY DT10 2AZ DT10 2HZ DT10 2JA DT10 2JB DT10 2JH DT10 2JJ DT10 2JN DT10 2JP DT10 2JR DT10 2JW DT10 2LA DT10 2LB |
Transport near Blackmore
-
Templecombe Station
-
Sherborne Station
-
Gillingham (Dorset) Station
-
Thornford Station
-
Yetminster Station
- FAQ
- Price Paid By Year
- Property Type Price
Frequently asked questions about Blackmore
What is the average price for a property for sale in Blackmore?
The average price for a property for sale in Blackmore is £386,496. This amount is 0.07% lower than the average price in Sturminster Newton. There are 1,638 property listings for sale in Blackmore.
What streets have the most expensive properties for sale in Blackmore?
The streets with the most expensive properties for sale in Blackmore are Rowden Mill Lane at an average of £750,000, Stalbridge Common at an average of £675,000 and Duck Lane at an average of £672,500.
What streets have the most affordable properties for sale in Blackmore?
The streets with the most affordable properties for sale in Blackmore are Ridge View at an average of £215,000, Ring Street at an average of £225,000 and Thrift Close at an average of £243,000.
Which train stations are available in or near Blackmore?
Some of the train stations available in or near Blackmore are Templecombe, Sherborne and Gillingham (Dorset).
Property Price Paid in Blackmore by Year
The average sold property price by year was:
| Year | Average Sold Price | Price Change |
Sold Properties
|
|---|---|---|---|
| 2025 | £374,150 | -7% |
40 Properties |
| 2024 | £401,233 | 5% |
49 Properties |
| 2023 | £382,691 | -18% |
60 Properties |
| 2022 | £452,661 | 25% |
59 Properties |
| 2021 | £340,516 | 1% |
80 Properties |
| 2020 | £338,324 | 16% |
58 Properties |
| 2019 | £283,058 | -3% |
43 Properties |
| 2018 | £292,954 | -2% |
51 Properties |
| 2017 | £300,243 | 2% |
50 Properties |
| 2016 | £293,559 | 16% |
62 Properties |
| 2015 | £247,259 | -20% |
48 Properties |
| 2014 | £296,113 | 15% |
61 Properties |
| 2013 | £253,012 | -4% |
53 Properties |
| 2012 | £261,933 | 8% |
50 Properties |
| 2011 | £240,445 | -17% |
52 Properties |
| 2010 | £281,899 | 15% |
72 Properties |
| 2009 | £240,810 | -12% |
54 Properties |
| 2008 | £268,613 | -2% |
22 Properties |
| 2007 | £273,332 | 9% |
73 Properties |
| 2006 | £248,105 | 13% |
64 Properties |
| 2005 | £214,716 | -7% |
59 Properties |
| 2004 | £230,271 | 11% |
70 Properties |
| 2003 | £206,044 | 15% |
64 Properties |
| 2002 | £174,318 | 16% |
77 Properties |
| 2001 | £145,937 | 18% |
107 Properties |
| 2000 | £119,879 | 13% |
89 Properties |
| 1999 | £103,756 | 11% |
84 Properties |
| 1998 | £92,439 | 12% |
71 Properties |
| 1997 | £81,322 | 14% |
66 Properties |
| 1996 | £69,946 | -28% |
55 Properties |
| 1995 | £89,476 | - |
50 Properties |
Property Price per Property Type in Blackmore
Here you can find historic sold price data in order to help with your property search.
The average Property Paid Price for specific property types in the last three years are:
| Property Type | Average Sold Price | Sold Properties |
|---|---|---|
| Semi Detached House | £335,593.00 | 72 Semi Detached Houses |
| Detached House | £492,147.00 | 52 Detached Houses |
| Terraced House | £318,895.00 | 24 Terraced Houses |
| Flat | £180,000.00 | 1 Flat |

