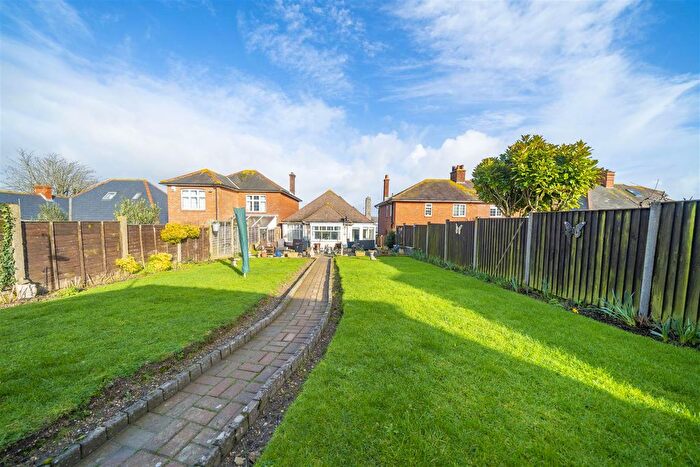
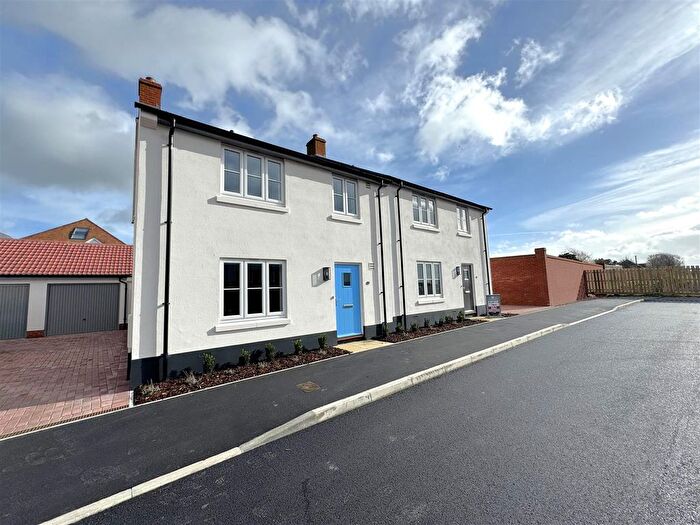
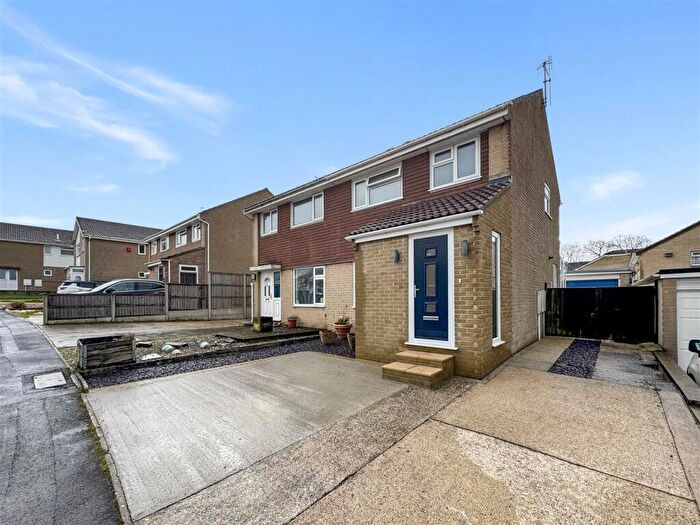
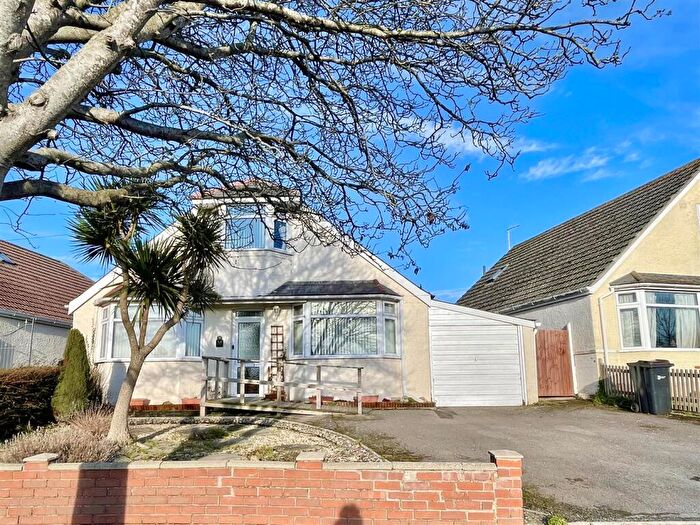
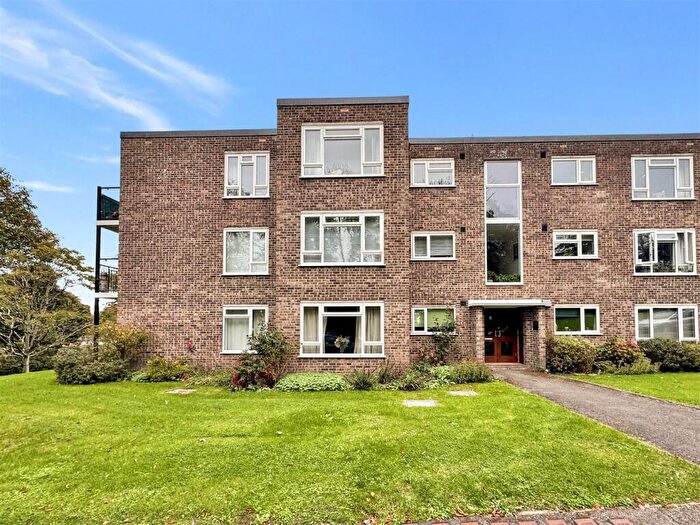
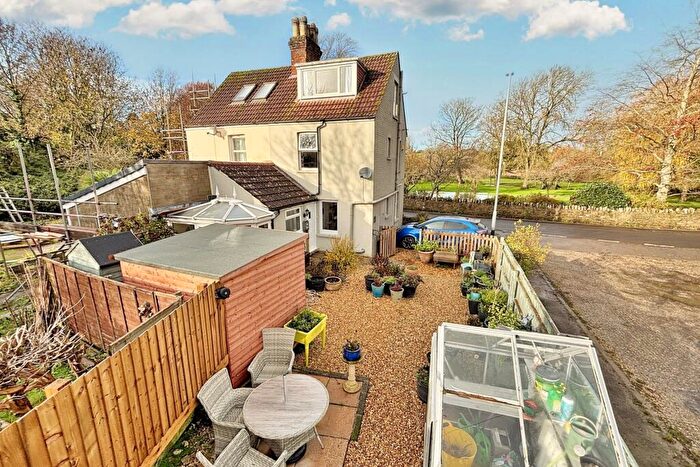
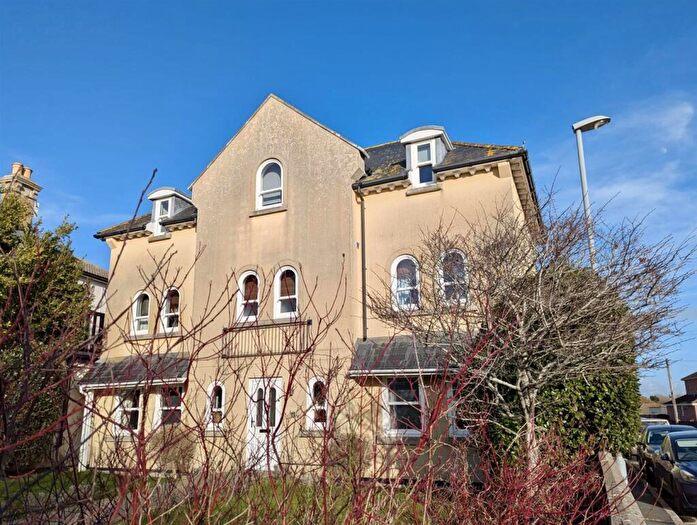
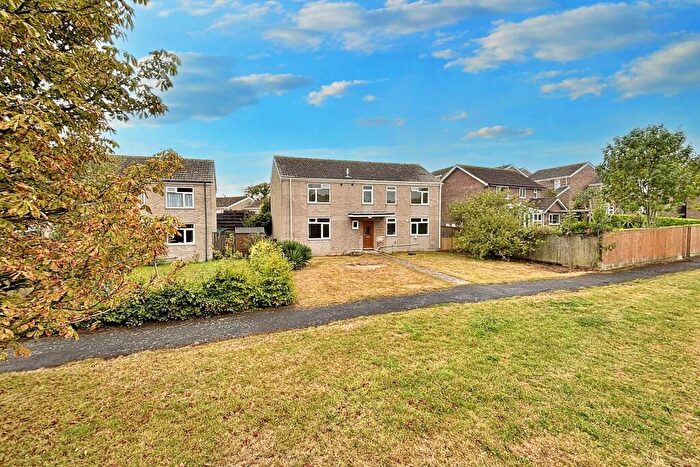
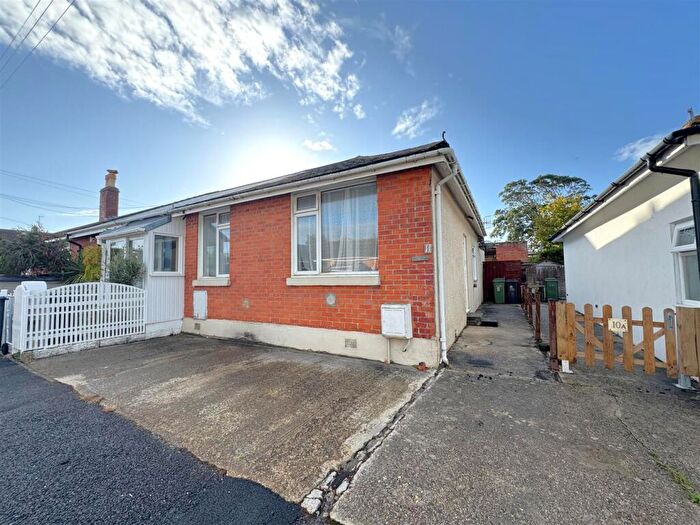
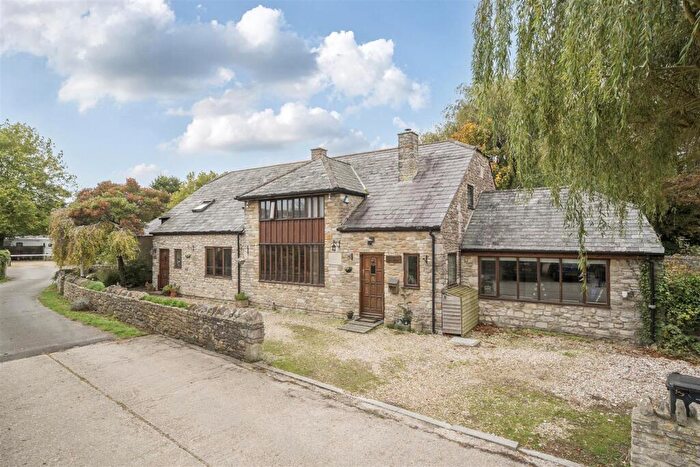
Houses for sale & to rent in Wey Valley, Weymouth
House Prices in Wey Valley
Properties in Wey Valley have an average house price of £387,234.00 and had 177 Property Transactions within the last 3 years¹.
Wey Valley is an area in Weymouth, Dorset with 1,416 households², where the most expensive property was sold for £1,075,500.00.
Properties for sale in Wey Valley
Roads and Postcodes in Wey Valley
Navigate through our locations to find the location of your next house in Wey Valley, Weymouth for sale or to rent.
| Streets | Postcodes |
|---|---|
| Ambleside | DT3 5HH |
| Appletree Close | DT3 5JY |
| Blenheim Road | DT3 5AZ DT3 5BA |
| Brentmere Close | DT3 5FE |
| Broadlands Road | DT3 5DG |
| Causeway | DT4 9RX DT4 9RY |
| Chestnut Place | DT3 5HP |
| Clarendon Avenue | DT3 5BG |
| Coniston Crescent | DT3 5HA |
| Corfe Road | DT3 5RH |
| Coronation Crescent | DT3 5EU |
| Coronation Road | DT3 5ET |
| Court Road | DT3 5DQ |
| Dorchester Road | DT3 5AJ DT3 5AR DT3 5AT DT3 5AU DT3 5AW DT3 5AX DT3 5BL DT3 5BN DT3 5BP DT3 5BS DT3 5BW DT3 5JA DT3 5JB DT3 5JD |
| Frampton Cottages | DT3 4BW |
| Grasmere Close | DT3 5HD |
| Grasmere Road | DT3 5HB |
| Greenway Close | DT3 5BQ |
| Greenway Road | DT3 5BD DT3 5BE |
| Holme Close | DT3 5RW |
| Icen Road | DT3 5JJ DT3 5JL |
| Kimmeridge Close | DT3 5RL |
| Kings Road | DT3 5ES |
| Kite Drive | DT3 5FB |
| Lakeside Gardens | DT3 5HQ |
| Lancaster Road | DT3 5BB |
| Lorton Lane | DT3 5DJ |
| Manor Road | DT3 5HR |
| Mount Pleasant Avenue North | DT3 5HW |
| Mount Pleasant Avenue South | DT3 5JF |
| Nottington Court | DT3 4BL |
| Nottington Lane | DT3 5DF |
| Queens Road | DT3 5EX |
| Radipole Lane | DT3 5HS DT4 9RN DT4 9RP |
| Radipole Park Drive | DT3 5EZ |
| Rocky Knapp | DT3 5JE |
| Roman Close | DT3 5JG |
| Roman Road | DT3 5JH DT3 5JQ |
| Spa Road | DT3 5DA DT3 5EL DT3 5EN DT3 5EP DT3 5ER DT3 5EW DT3 5EY |
| Steeple Close | DT3 5RG |
| Stirling Road | DT3 5AY |
| Stoborough Close | DT3 5RF |
| Studland Way | DT3 5RJ |
| The Grove | DT3 5DH |
| Tyneham Close | DT3 5RQ |
| Ullswater Crescent | DT3 5HE DT3 5HF DT3 5HX |
| Westmacott Road | DT3 5FD |
| Willerby Close | DT3 5FG |
| Windermere Crescent | DT3 5HG |
| DT3 4BH DT3 4BJ DT3 4BN |
Transport near Wey Valley
-
Upwey Station
-
Weymouth Station
-
Dorchester South Station
-
Dorchester West Station
-
Moreton (Dorset) Station
- FAQ
- Price Paid By Year
- Property Type Price
Frequently asked questions about Wey Valley
What is the average price for a property for sale in Wey Valley?
The average price for a property for sale in Wey Valley is £387,234. This amount is 26% higher than the average price in Weymouth. There are 776 property listings for sale in Wey Valley.
What streets have the most expensive properties for sale in Wey Valley?
The streets with the most expensive properties for sale in Wey Valley are Mount Pleasant Avenue South at an average of £632,700, Icen Road at an average of £542,863 and Manor Road at an average of £538,333.
What streets have the most affordable properties for sale in Wey Valley?
The streets with the most affordable properties for sale in Wey Valley are Nottington Court at an average of £223,333, Causeway at an average of £230,000 and Ullswater Crescent at an average of £265,062.
Which train stations are available in or near Wey Valley?
Some of the train stations available in or near Wey Valley are Upwey, Weymouth and Dorchester South.
Property Price Paid in Wey Valley by Year
The average sold property price by year was:
| Year | Average Sold Price | Price Change |
Sold Properties
|
|---|---|---|---|
| 2025 | £404,147 | 8% |
61 Properties |
| 2024 | £372,178 | -4% |
73 Properties |
| 2023 | £388,802 | -2% |
43 Properties |
| 2022 | £396,599 | 9% |
66 Properties |
| 2021 | £359,037 | 0,1% |
67 Properties |
| 2020 | £358,718 | 9% |
55 Properties |
| 2019 | £327,986 | 1% |
68 Properties |
| 2018 | £324,651 | -5% |
69 Properties |
| 2017 | £339,373 | 20% |
69 Properties |
| 2016 | £272,147 | -13% |
70 Properties |
| 2015 | £307,071 | 18% |
60 Properties |
| 2014 | £251,771 | -4% |
88 Properties |
| 2013 | £262,006 | 3% |
46 Properties |
| 2012 | £254,450 | 7% |
54 Properties |
| 2011 | £236,045 | -4% |
55 Properties |
| 2010 | £245,898 | 14% |
44 Properties |
| 2009 | £210,582 | -35% |
62 Properties |
| 2008 | £284,423 | 1% |
43 Properties |
| 2007 | £282,945 | 9% |
62 Properties |
| 2006 | £257,565 | 17% |
85 Properties |
| 2005 | £212,856 | -4% |
62 Properties |
| 2004 | £220,599 | 14% |
58 Properties |
| 2003 | £188,920 | 11% |
86 Properties |
| 2002 | £167,429 | 13% |
77 Properties |
| 2001 | £145,382 | 24% |
74 Properties |
| 2000 | £110,962 | 10% |
58 Properties |
| 1999 | £99,949 | 6% |
79 Properties |
| 1998 | £94,335 | 17% |
82 Properties |
| 1997 | £78,716 | 15% |
71 Properties |
| 1996 | £67,065 | -14% |
56 Properties |
| 1995 | £76,343 | - |
52 Properties |
Property Price per Property Type in Wey Valley
Here you can find historic sold price data in order to help with your property search.
The average Property Paid Price for specific property types in the last three years are:
| Property Type | Average Sold Price | Sold Properties |
|---|---|---|
| Semi Detached House | £361,010.00 | 50 Semi Detached Houses |
| Detached House | £474,872.00 | 86 Detached Houses |
| Terraced House | £293,833.00 | 18 Terraced Houses |
| Flat | £189,652.00 | 23 Flats |

