
Houses for sale & to rent in Brockmoor And Pensnett, Dudley
House Prices in Brockmoor And Pensnett
Properties in Brockmoor And Pensnett have an average house price of £256,000.00 and had 4 Property Transactions within the last 3 years¹.
Brockmoor And Pensnett is an area in Dudley, Dudley with 23 households², where the most expensive property was sold for £325,000.00.
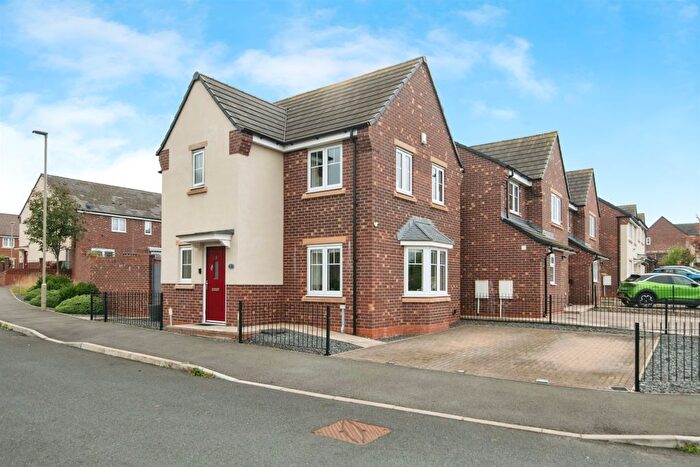
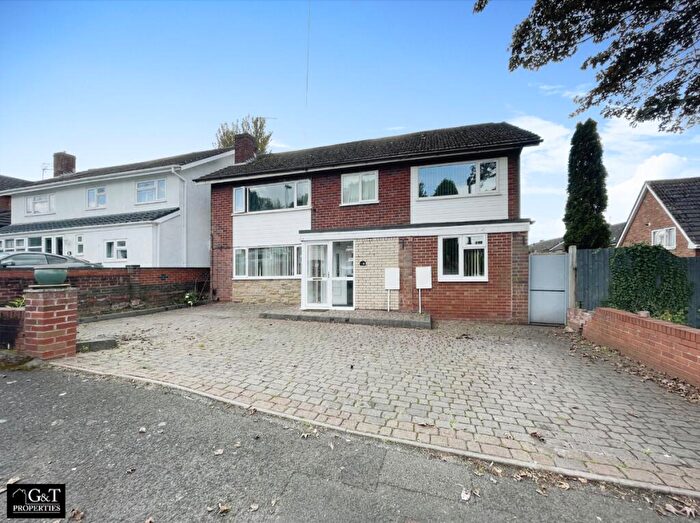
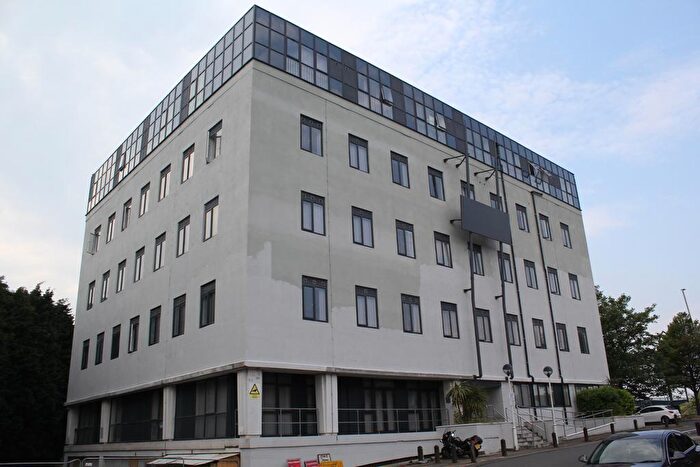
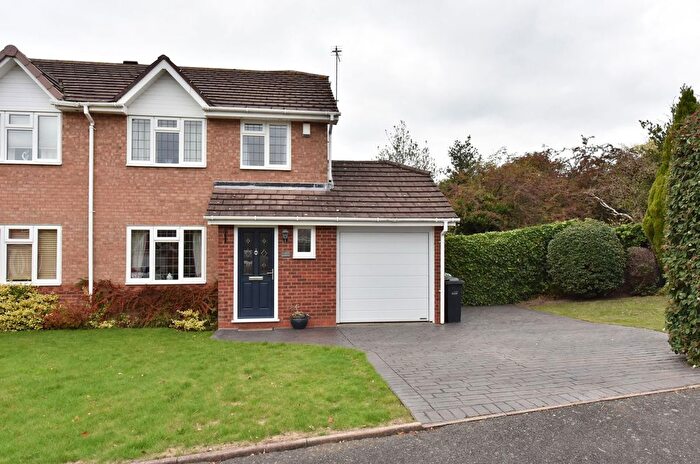
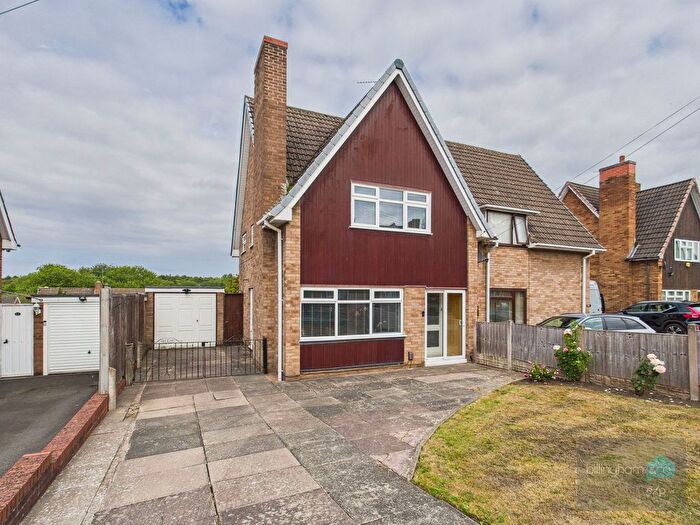
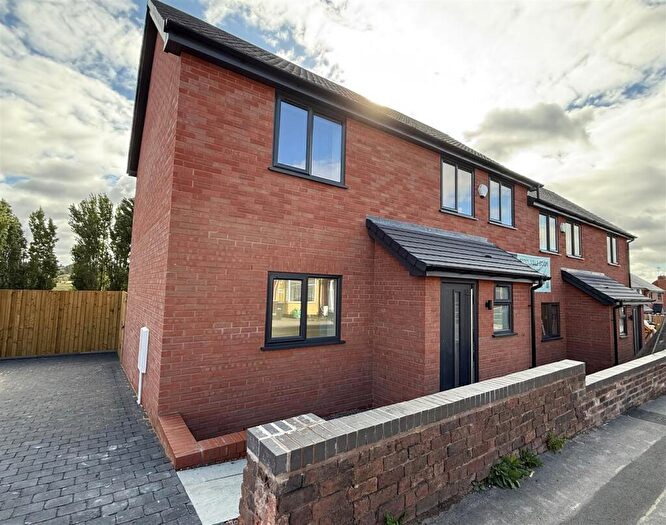
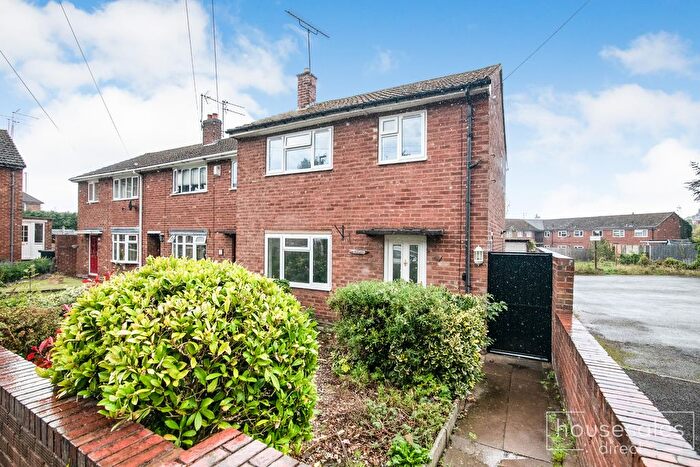
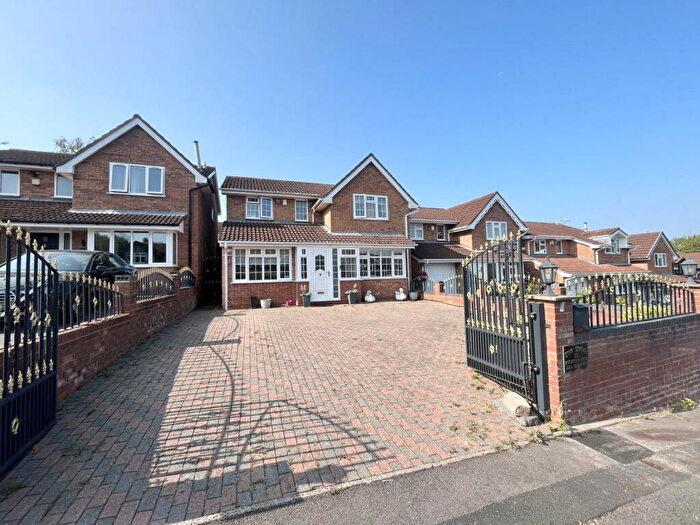
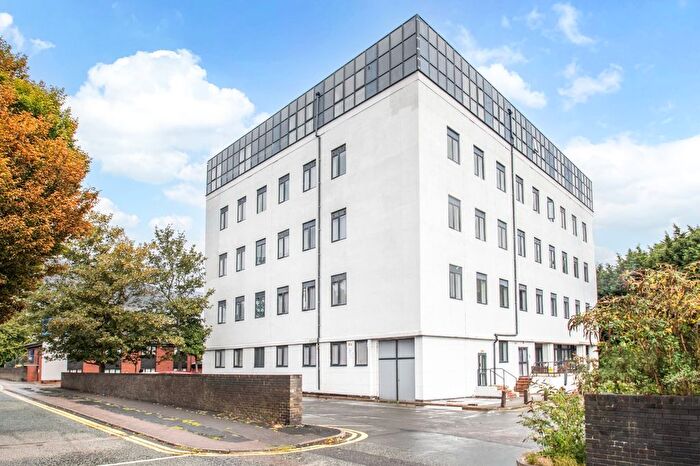
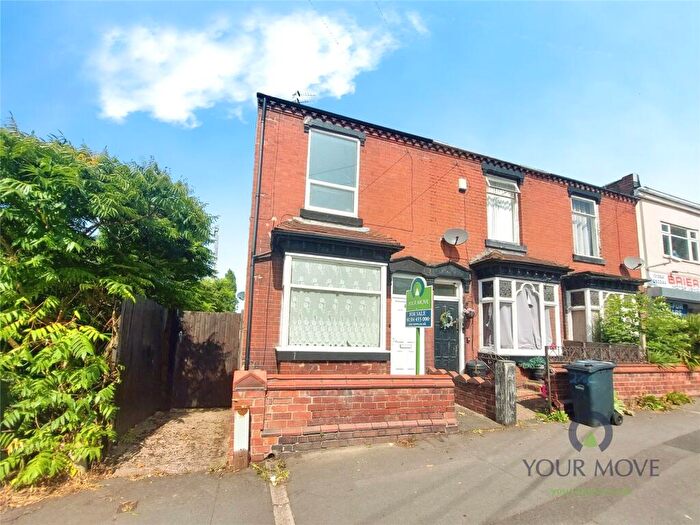
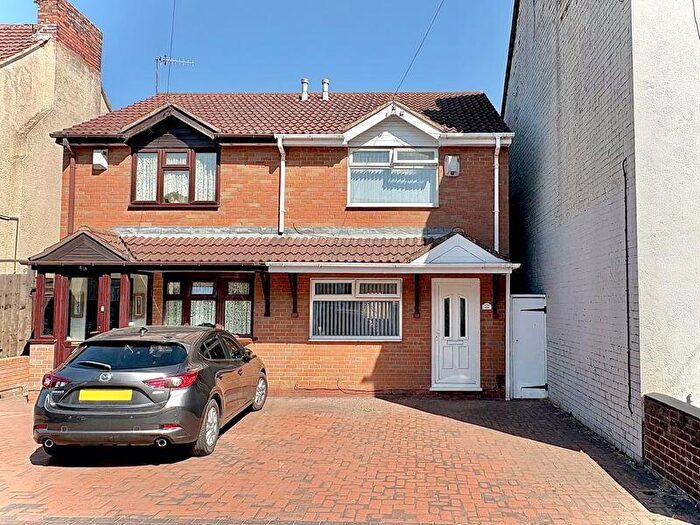
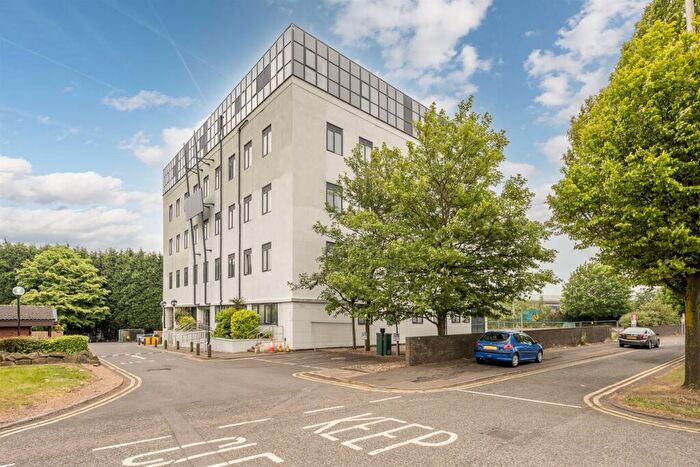
Properties for sale in Brockmoor And Pensnett
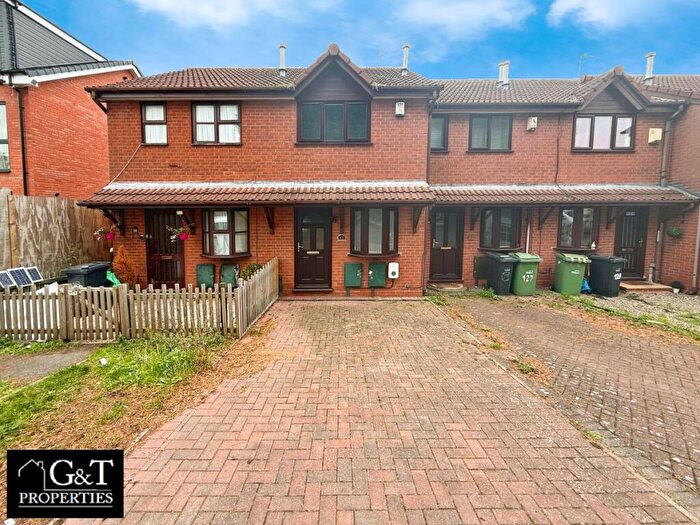
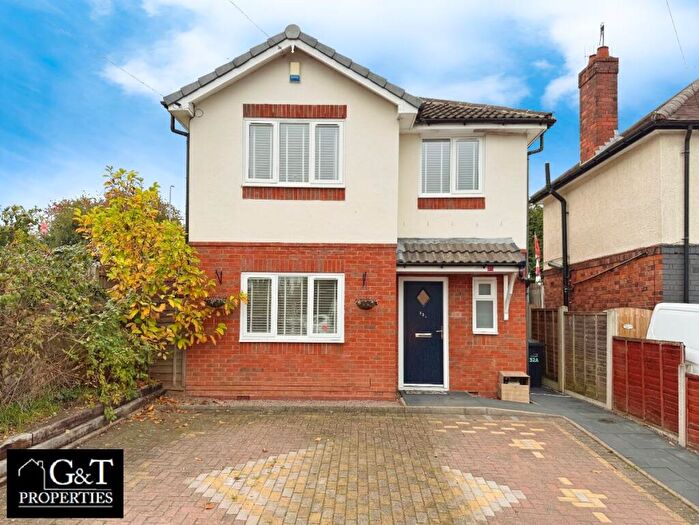
![]()
If you are looking to sell your house, let it out, or receive a property valuation, an expert can help you.
Click the button below to get started.

Roads and Postcodes in Brockmoor And Pensnett
Navigate through our locations to find the location of your next house in Brockmoor And Pensnett, Dudley for sale or to rent.
Transport near Brockmoor And Pensnett
-
 Cradley Heath Station
 -
Lye Station
-
Tipton Station
-
Stourbridge Town Station
-
Coseley Station
-
Dudley Port Station
-
Old Hill Station
-
Stourbridge Junction Station
-
Rowley Regis Station
-
Sandwell and Dudley Station
- FAQ
- Price Paid By Year
- Property Type Price
Frequently asked questions about Brockmoor And Pensnett
What is the average price for a property for sale in Brockmoor And Pensnett?
The average price for a property for sale in Brockmoor And Pensnett is £256,000. This amount is 24% higher than the average price in Dudley. There are 760 property listings for sale in Brockmoor And Pensnett.
What streets have the most expensive properties for sale in Brockmoor And Pensnett?
The street with the most expensive properties for sale in Brockmoor And Pensnett is Coach Mews at an average of £270,666.
What streets have the most affordable properties for sale in Brockmoor And Pensnett?
The street with the most affordable properties for sale in Brockmoor And Pensnett is Stourbridge Road at an average of £212,000.
Which train stations are available in or near Brockmoor And Pensnett?
Some of the train stations available in or near Brockmoor And Pensnett are Cradley Heath, Lye and Tipton.
Property Price Paid in Brockmoor And Pensnett by Year
The average sold property price by year was:
| Year | Average Sold Price | Price Change |
Sold Properties
|
|---|---|---|---|
| 2025 | £255,000 | -27% |
1 Property |
| 2024 | £325,000 | 35% |
1 Property |
| 2023 | £212,000 | -9% |
1 Property |
| 2022 | £232,000 | 3% |
1 Property |
| 2021 | £225,000 | 2% |
3 Properties |
| 2020 | £219,600 | -2% |
3 Properties |
| 2019 | £224,499 | 11% |
2 Properties |
| 2017 | £200,270 | 35% |
11 Properties |
| 2016 | £130,000 | 36% |
1 Property |
| 2014 | £83,500 | -130% |
2 Properties |
| 2013 | £191,903 | 27% |
11 Properties |
| 2012 | £139,500 | -43% |
1 Property |
| 2011 | £199,950 | 43% |
1 Property |
| 2010 | £114,000 | -13% |
1 Property |
| 2009 | £129,000 | 38% |
2 Properties |
| 2008 | £80,000 | -49% |
1 Property |
| 2007 | £119,000 | -24% |
3 Properties |
| 2005 | £148,000 | 49% |
1 Property |
| 2004 | £74,950 | -13% |
1 Property |
| 2003 | £85,000 | -55% |
1 Property |
| 2002 | £132,000 | 77% |
1 Property |
| 2000 | £30,000 | -55% |
1 Property |
| 1999 | £46,500 | -18% |
1 Property |
| 1998 | £55,000 | 37% |
1 Property |
| 1997 | £34,647 | -108% |
4 Properties |
| 1995 | £72,000 | - |
3 Properties |
Property Price per Property Type in Brockmoor And Pensnett
Here you can find historic sold price data in order to help with your property search.
The average Property Paid Price for specific property types in the last three years are:
| Property Type | Average Sold Price | Sold Properties |
|---|---|---|
| Semi Detached House | £212,000.00 | 1 Semi Detached House |
| Terraced House | £243,500.00 | 2 Terraced Houses |
| Detached House | £325,000.00 | 1 Detached House |