
Houses for sale & to rent in Dudley, England
House Prices in Dudley
Properties in Dudley have
an average house price of
£240k
and had 11,373 Property Transactions
within the last 3 years.¹
Dudley is a location in
England with
129,772 households², where the most expensive property was sold for £3.35M.
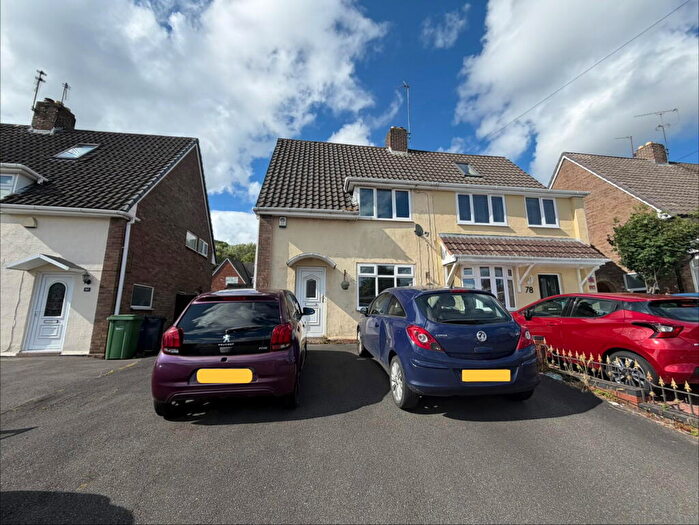
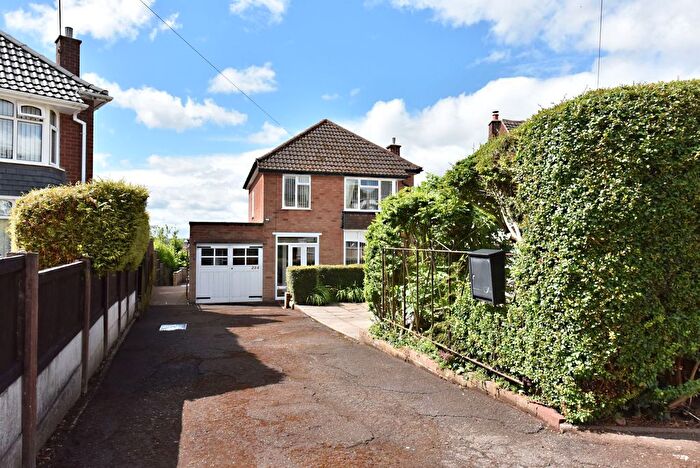
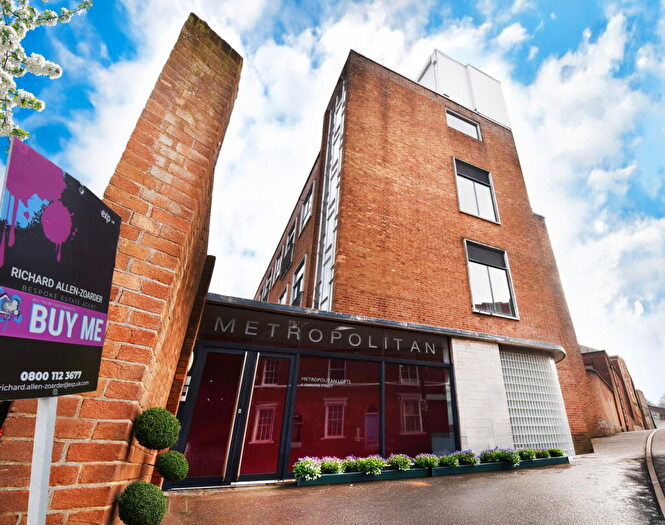
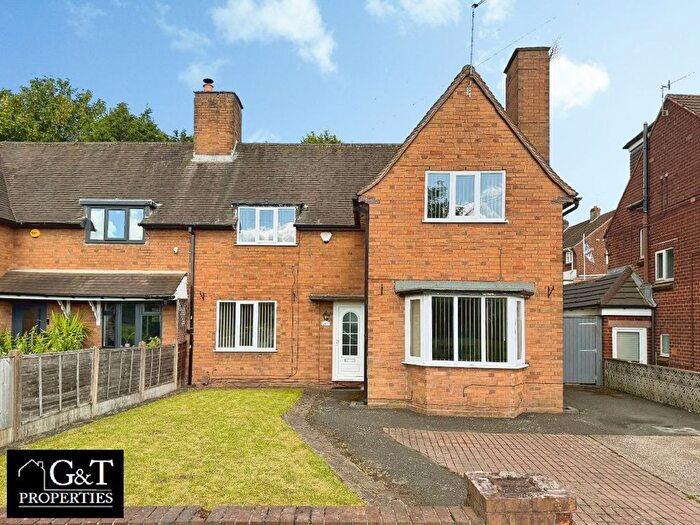
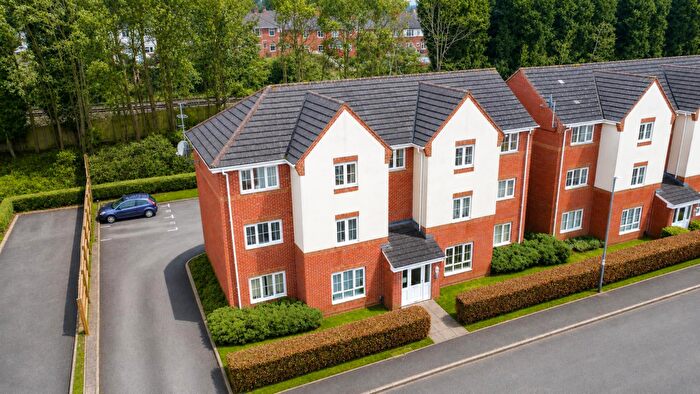
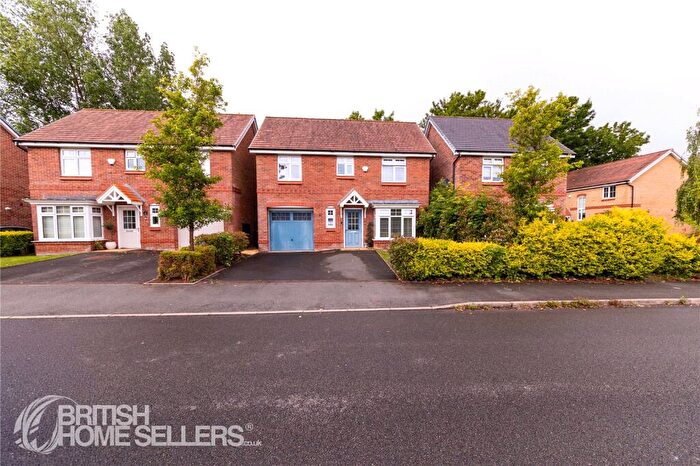
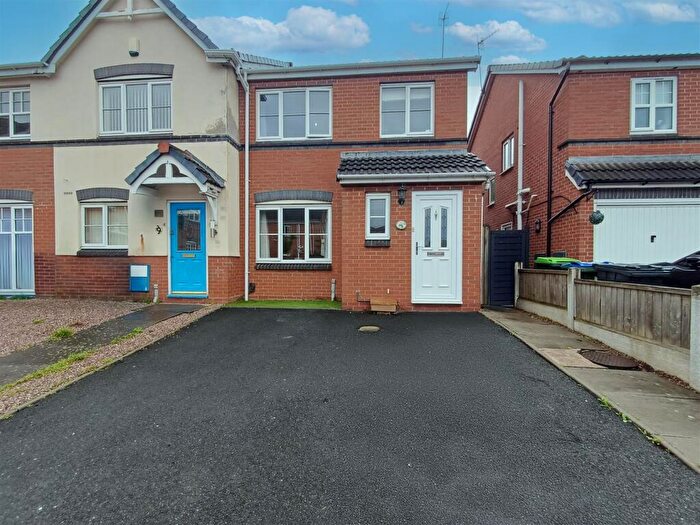
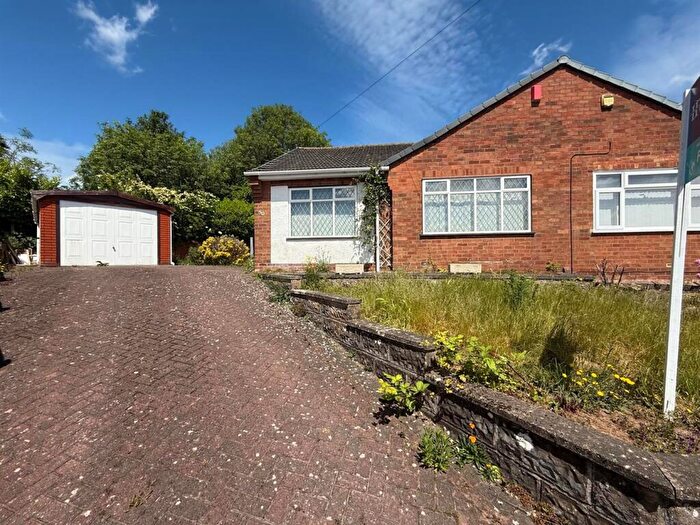
Properties for sale in Dudley
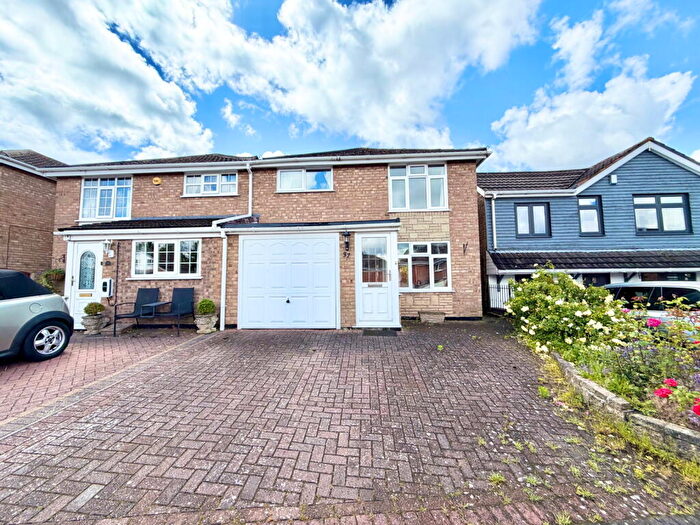
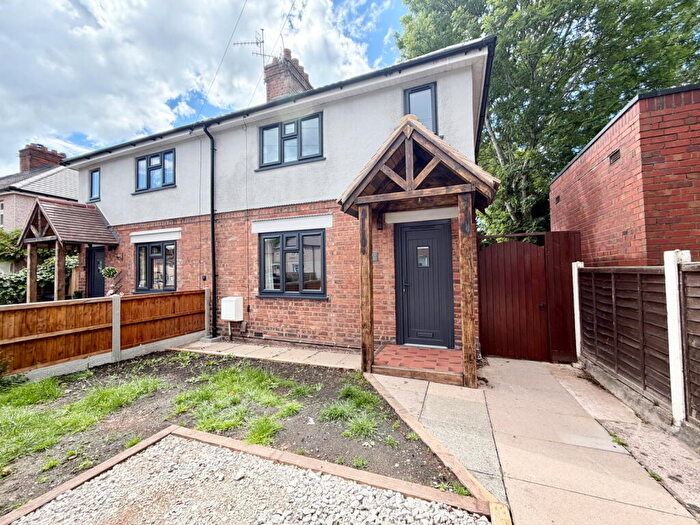

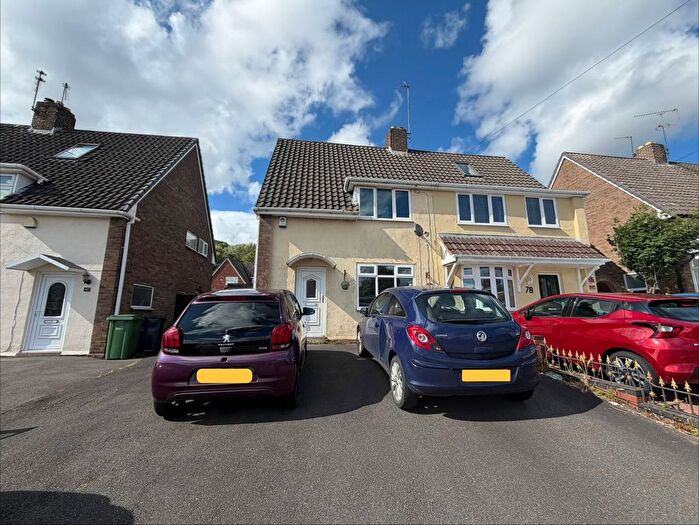
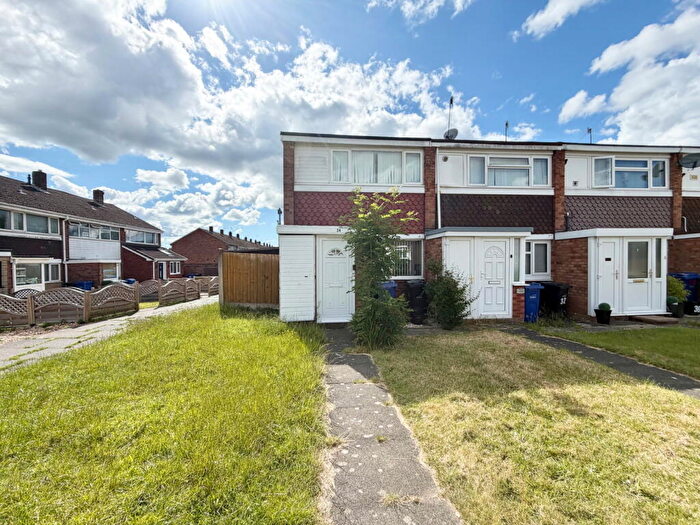
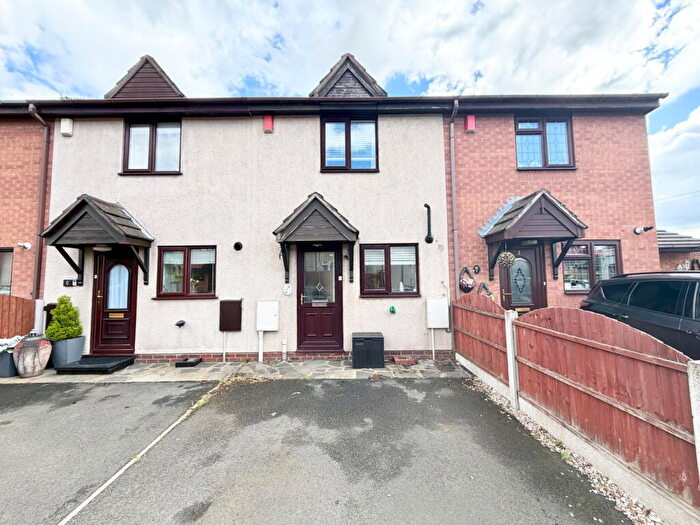
![]()
If you are looking to sell your house, let it out, or receive a property valuation, an expert can help you.
Click the button below to get started.


Towns in Dudley
Navigate through our locations to find the location of your next house in Dudley, England for sale or to rent.
Transport in Dudley
Please see below transportation links in this area:
-
 Cradley Heath Station
 -
Lye Station
-
Stourbridge Town Station
-
Old Hill Station
-
Stourbridge Junction Station
- FAQ
- Price Paid By Year
- Property Type Price
Frequently asked questions about Dudley
What is the average price for a property for sale in Dudley?
The average price for a property for sale in Dudley is £239,687. This amount is 33% lower than the average price in England. There are more than 10,000 property listings for sale in Dudley.
What locations have the most expensive properties for sale in Dudley?
The locations with the most expensive properties for sale in Dudley are Stourbridge at an average of £279,630, Kingswinford at an average of £278,246 and Halesowen at an average of £248,601.
What locations have the most affordable properties for sale in Dudley?
The locations with the most affordable properties for sale in Dudley are Wolverhampton at an average of £97,499, Rowley Regis at an average of £185,285 and Bilston at an average of £190,982.
Which train stations are available in or near Dudley?
Some of the train stations available in or near Dudley are Cradley Heath, Lye and Stourbridge Town.
Property Price Paid in Dudley by Year
The average sold property price by year was:
| Year | Average Sold Price | Price Change |
Sold Properties
|
|---|---|---|---|
| 2026 | £239,649 | -4% |
453 Properties |
| 2025 | £249,168 | 4% |
3,714 Properties |
| 2024 | £238,051 | 3% |
3,860 Properties |
| 2023 | £231,057 | 1% |
3,346 Properties |
| 2022 | £228,138 | 4% |
4,338 Properties |
| 2021 | £218,417 | 9% |
5,462 Properties |
| 2020 | £199,783 | 6% |
3,935 Properties |
| 2019 | £186,991 | 5% |
4,744 Properties |
| 2018 | £178,230 | 4% |
4,797 Properties |
| 2017 | £171,977 | 4% |
4,661 Properties |
| 2016 | £165,957 | 3% |
4,810 Properties |
| 2015 | £161,248 | 6% |
4,515 Properties |
| 2014 | £151,143 | 2% |
4,239 Properties |
| 2013 | £147,689 | 2% |
3,490 Properties |
| 2012 | £145,124 | -0,1% |
2,913 Properties |
| 2011 | £145,221 | -4% |
3,063 Properties |
| 2010 | £151,134 | 4% |
2,972 Properties |
| 2009 | £145,211 | -1% |
2,700 Properties |
| 2008 | £146,884 | -4% |
3,057 Properties |
| 2007 | £152,086 | 4% |
5,596 Properties |
| 2006 | £145,335 | 6% |
5,835 Properties |
| 2005 | £136,742 | 4% |
4,546 Properties |
| 2004 | £130,723 | 13% |
5,175 Properties |
| 2003 | £113,280 | 17% |
4,942 Properties |
| 2002 | £93,490 | 16% |
5,630 Properties |
| 2001 | £78,514 | 9% |
5,107 Properties |
| 2000 | £71,486 | 6% |
5,030 Properties |
| 1999 | £67,522 | 4% |
4,970 Properties |
| 1998 | £65,048 | 7% |
4,842 Properties |
| 1997 | £60,485 | 6% |
4,950 Properties |
| 1996 | £56,633 | 5% |
4,411 Properties |
| 1995 | £53,839 | - |
3,790 Properties |
Property Price per Property Type in Dudley
Here you can find historic sold price data in order to help with your property search.
The average Property Paid Price for specific property types in the last three years are:
| Property Type | Average Sold Price | Sold Properties |
|---|---|---|
| Semi Detached House | £232,589.00 | 5,067 Semi Detached Houses |
| Terraced House | £197,169.00 | 2,927 Terraced Houses |
| Detached House | £368,177.00 | 2,271 Detached Houses |
| Flat | £121,111.00 | 1,108 Flats |