
Houses for sale in Halesowen, Dudley
House Prices in Halesowen
Properties in Halesowen have an average house price of £249k and had 2,230 Property Transactions within the last 3 years.¹
Halesowen is an area in Dudley with 25,215 households², where the most expensive property was sold for £1.6M.
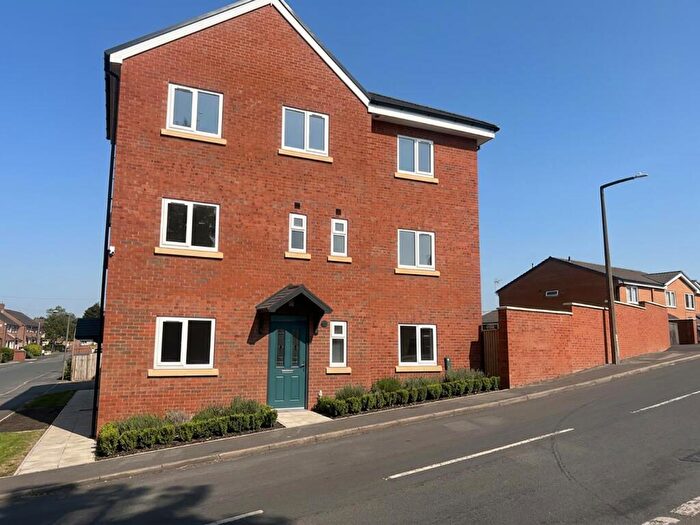
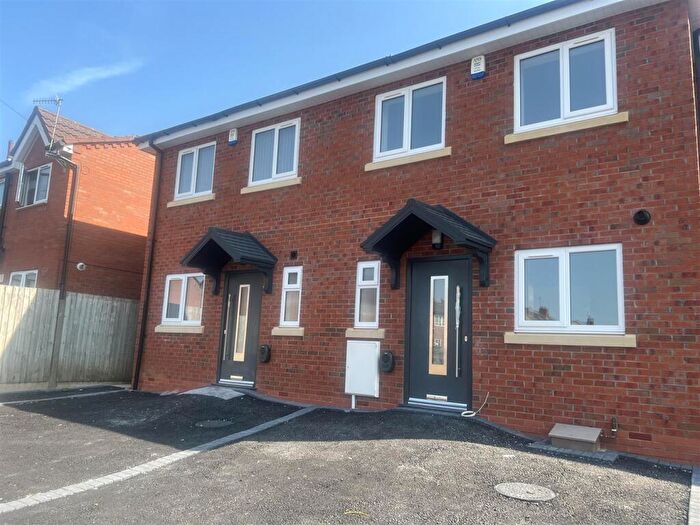
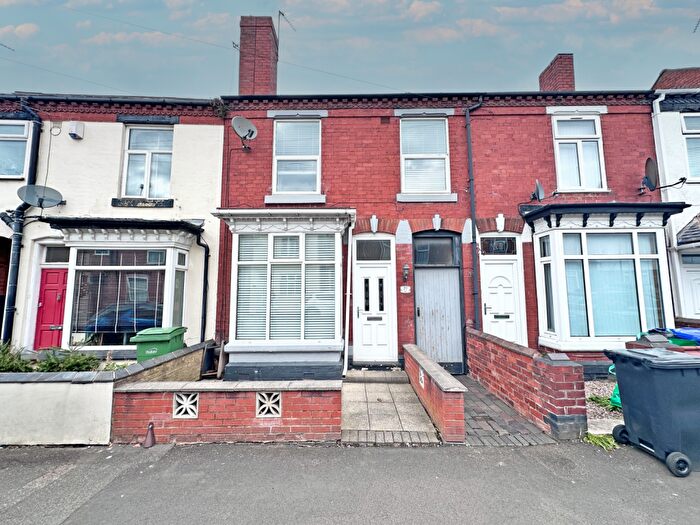
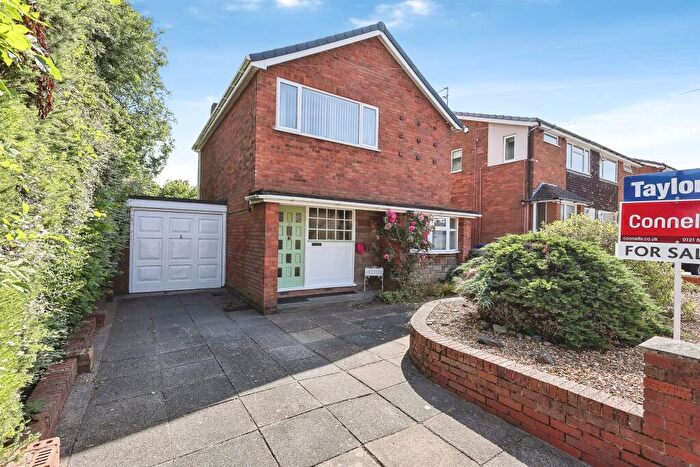
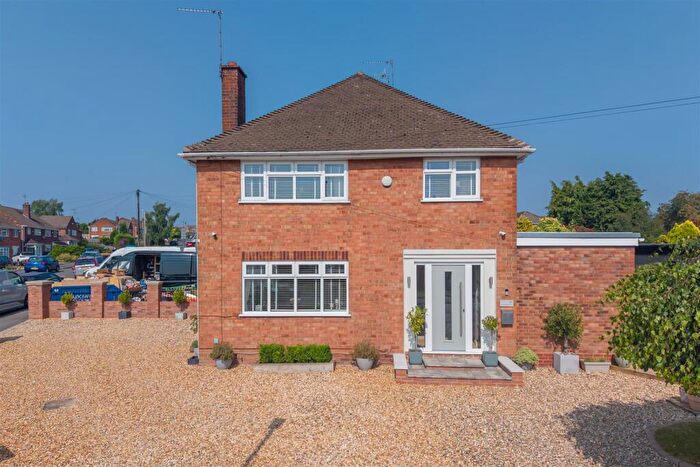
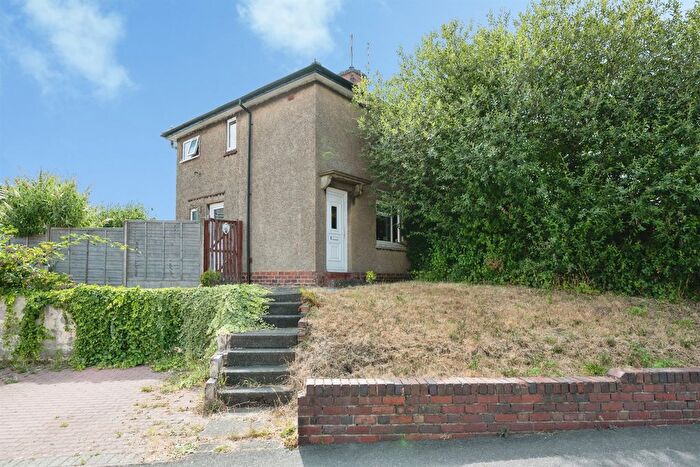
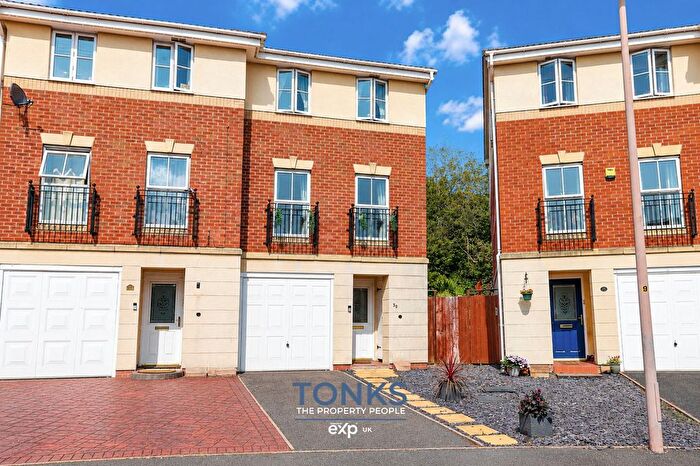
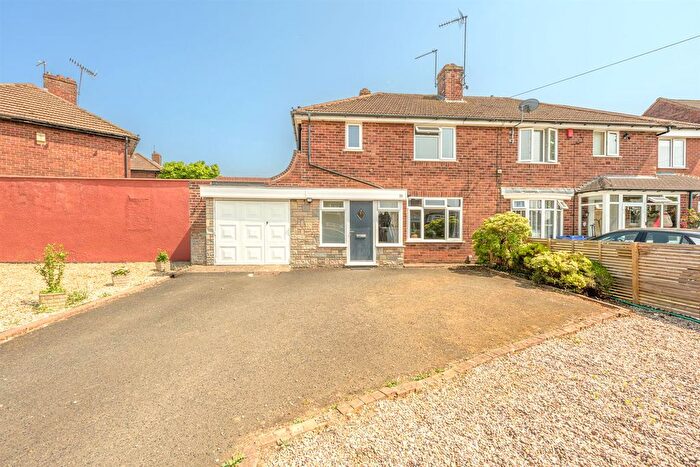
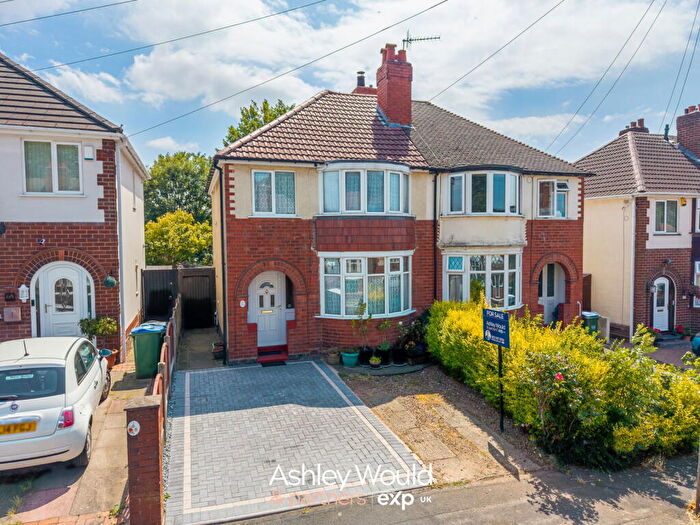
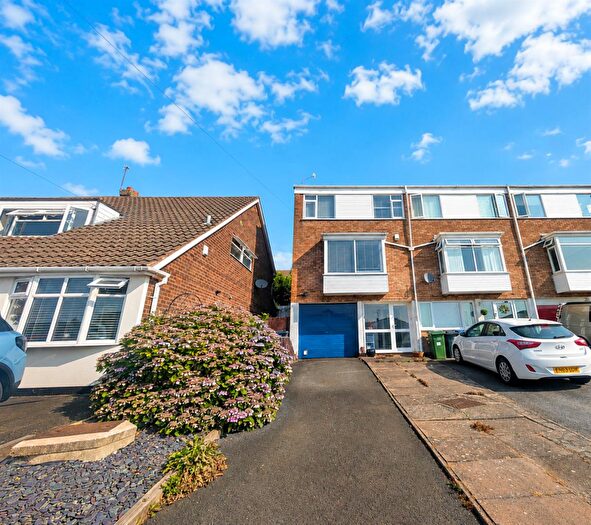
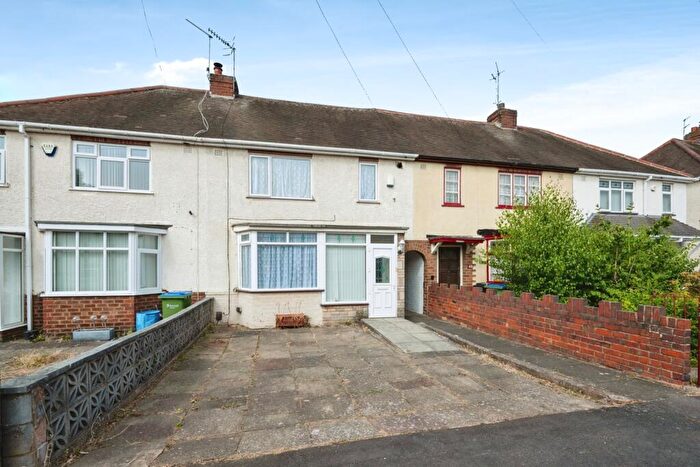
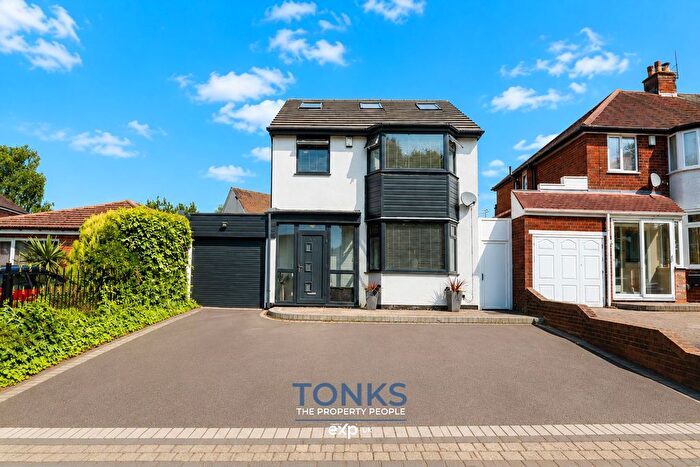
Properties for sale in Halesowen
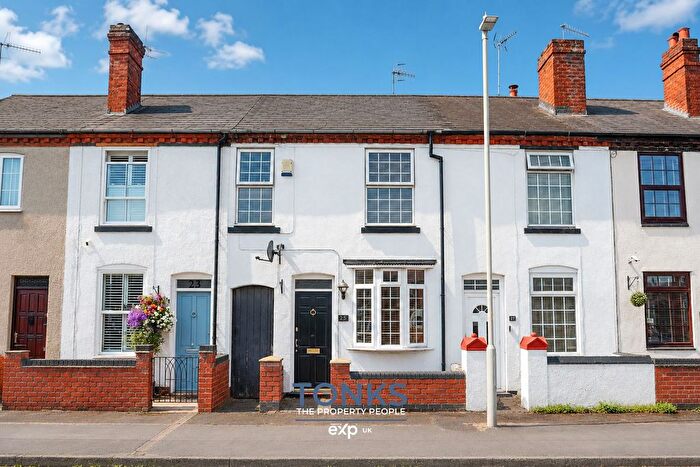


![]()
If you are looking to sell your house, let it out, or receive a property valuation, an expert can help you.
Click the button below to get started.


Neighbourhoods in Halesowen
Navigate through our locations to find the location of your next house in Halesowen, Dudley for sale or to rent.
Property price trends in Halesowen
According to the latest Land Registry data, the average home in Halesowen sold for £244,941 in 2026. That figure comes from a substantial record of 27,148 sales logged over the past 31 years.
Prices have moved up over the last three years. Compared with 2023, when the typical sale came in around £235,554, that's a rise of roughly 4%.
Looking back five years, average prices are up about 10.6% since 2021, a gain of around £23,564 in cash terms.
Zoom out to the past decade for the fuller picture. Back in 2016, homes here averaged £175,148, so the typical sold price has climbed about 39.8% since then, roughly 3.4% a year. Stretch the view to fifteen years and that annual pace holds at about 3.5%.
Frequently asked questions about Halesowen
What is the average price for a property for sale in Halesowen?
The average price for a property for sale in Halesowen is £248,601. This amount is 4% higher than the average price in Dudley. There are 6,187 property listings for sale in Halesowen.
What locations have the most expensive properties for sale in Halesowen?
The locations with the most expensive properties for sale in Halesowen are Halesowen South at an average of £297,223, Hayley Green And Cradley South at an average of £284,285 and Halesowen North at an average of £234,251.
What locations have the most affordable properties for sale in Halesowen?
The locations with the most affordable properties for sale in Halesowen are Cradley And Wollescote at an average of £195,697 and Belle Vale at an average of £222,747.
Which train stations are available in or near Halesowen?
Some of the train stations available in or near Halesowen are Old Hill, Rowley Regis and Cradley Heath.
Property Price Paid in Halesowen by Year
The average sold property price by year was:
| Year | Average Sold Price | Price Change |
Sold Properties
|
|---|---|---|---|
| 2026 | £244,941 | -7% |
43 Properties |
| 2025 | £262,455 | 6% |
724 Properties |
| 2024 | £247,087 | 5% |
799 Properties |
| 2023 | £235,554 | -2% |
664 Properties |
| 2022 | £239,901 | 8% |
856 Properties |
| 2021 | £221,377 | 6% |
1,149 Properties |
| 2020 | £207,078 | 3% |
786 Properties |
| 2019 | £200,983 | 6% |
1,053 Properties |
| 2018 | £188,732 | 7% |
916 Properties |
| 2017 | £175,120 | - |
923 Properties |
Property Price per Property Type in Halesowen
Here you can find historic sold price data in order to help with your property search.
The average Property Paid Price for specific property types in the last three years are:
| Property Type | Average Sold Price | Sold Properties |
|---|---|---|
| Semi Detached House | £260,493.00 | 954 Semi Detached Houses |
| Terraced House | £210,321.00 | 664 Terraced Houses |
| Detached House | £372,386.00 | 366 Detached Houses |
| Flat | £121,641.00 | 246 Flats |
Transport in Halesowen
Please see below transportation links in this area:
