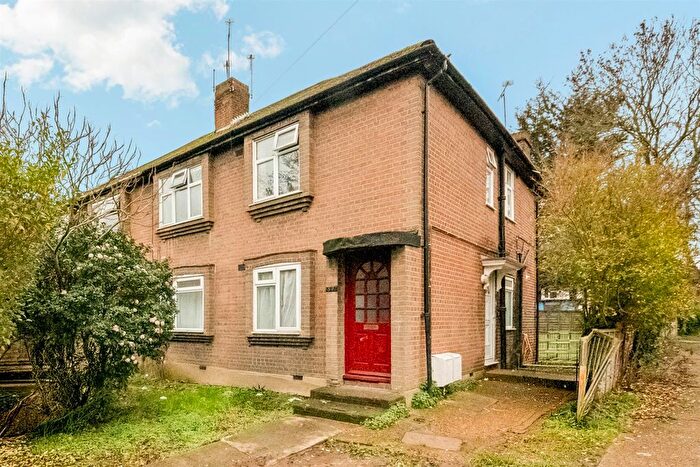
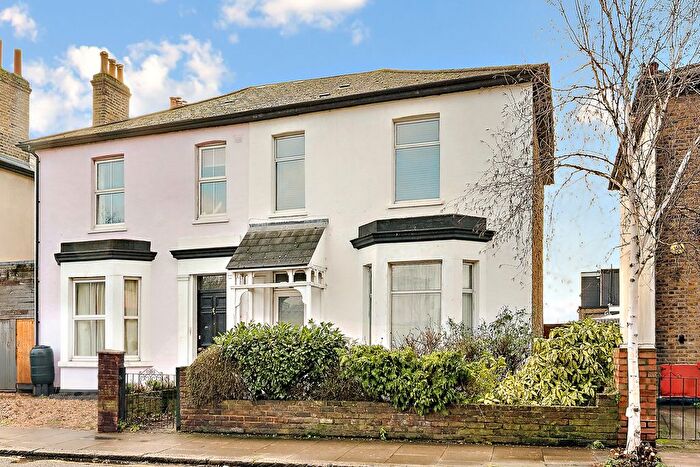
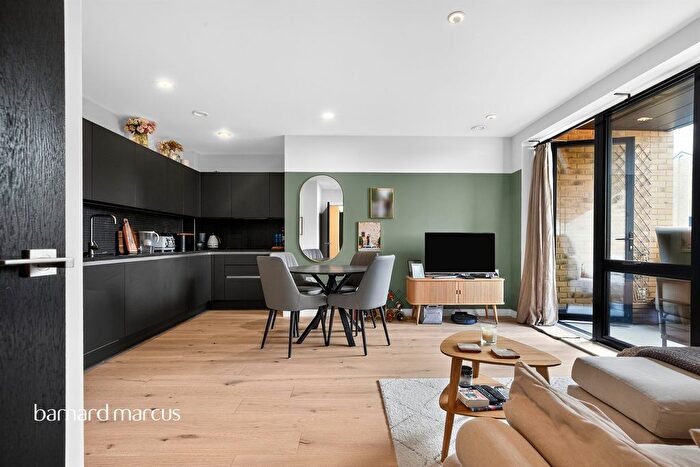
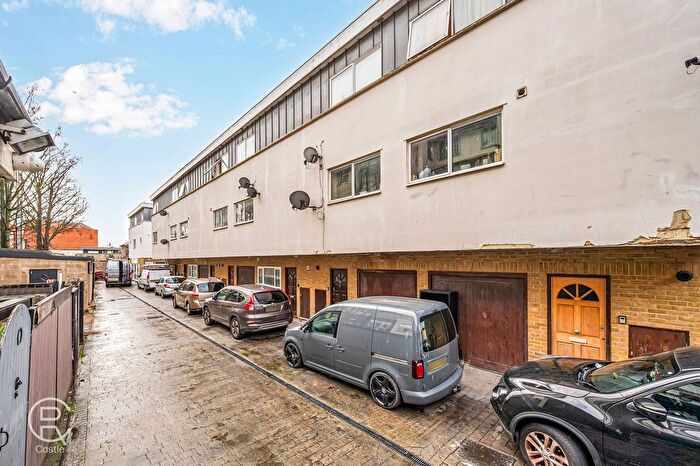
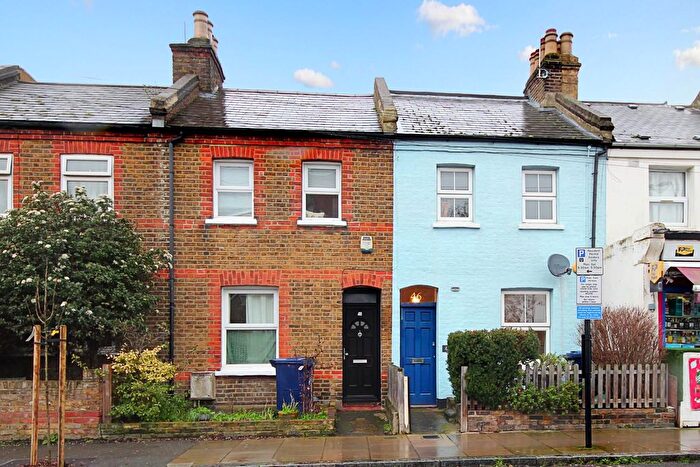
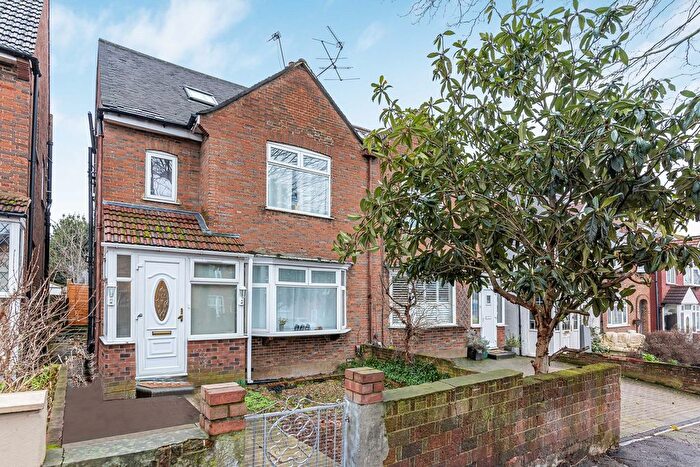
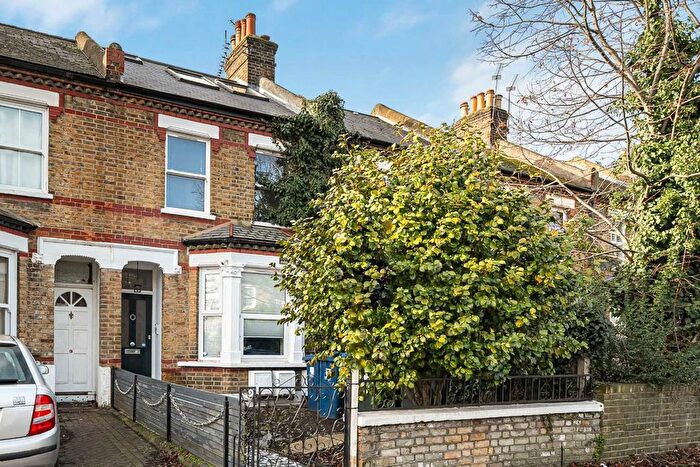
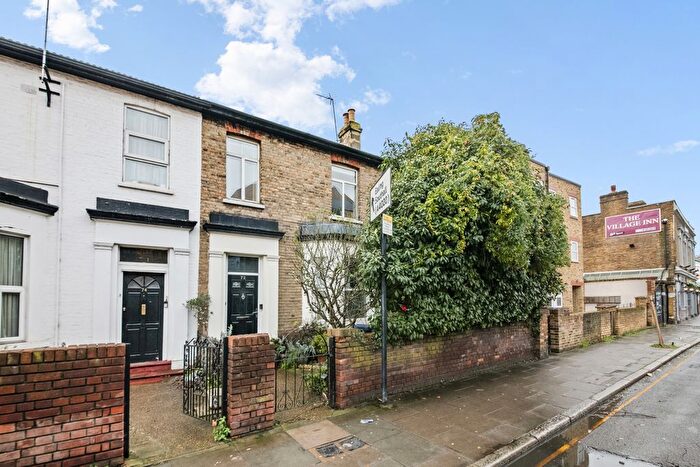
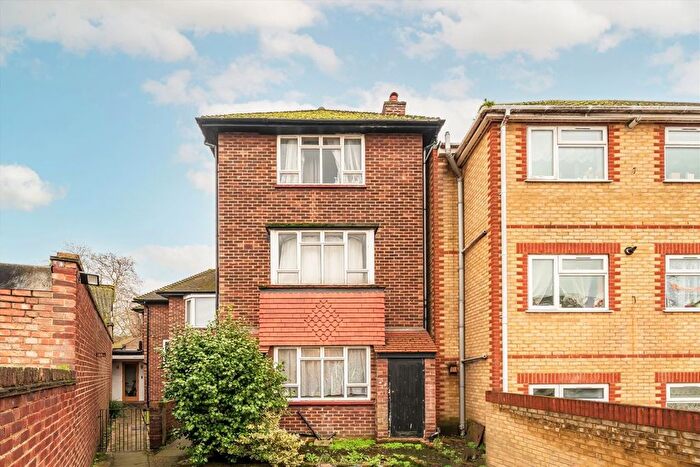
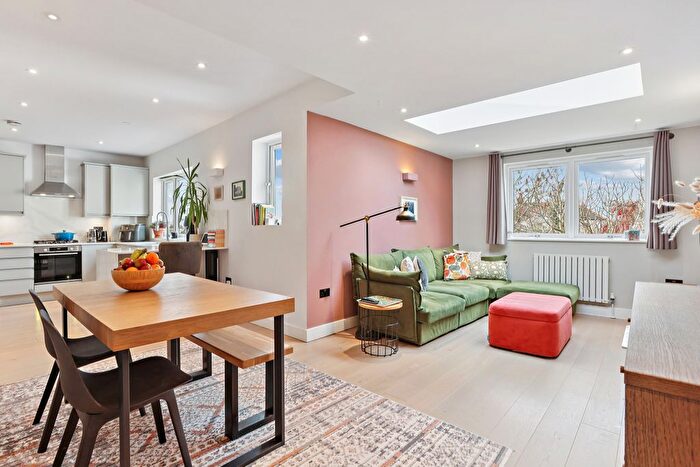
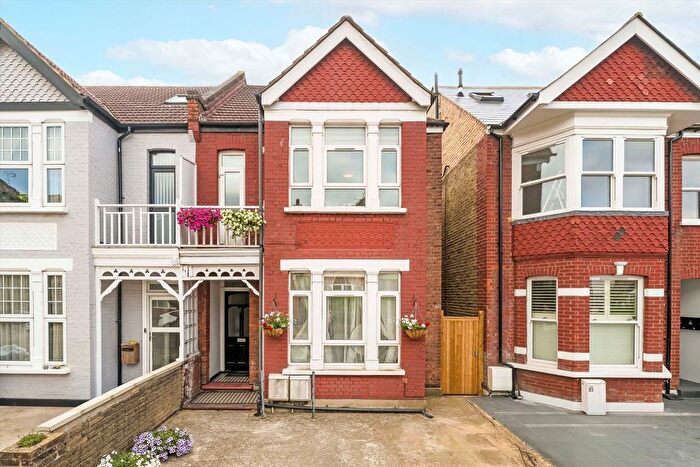
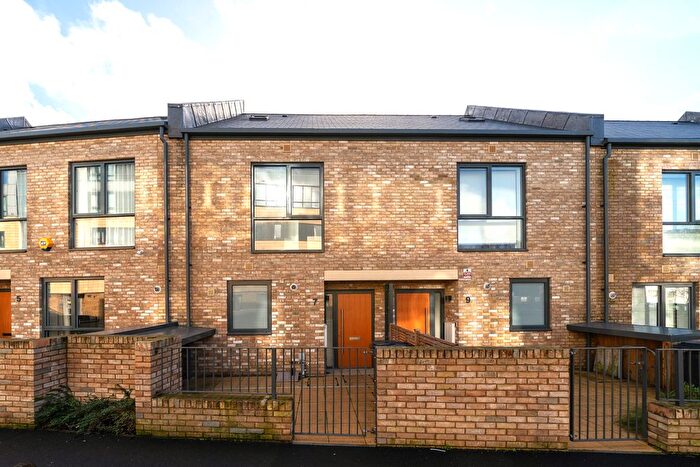
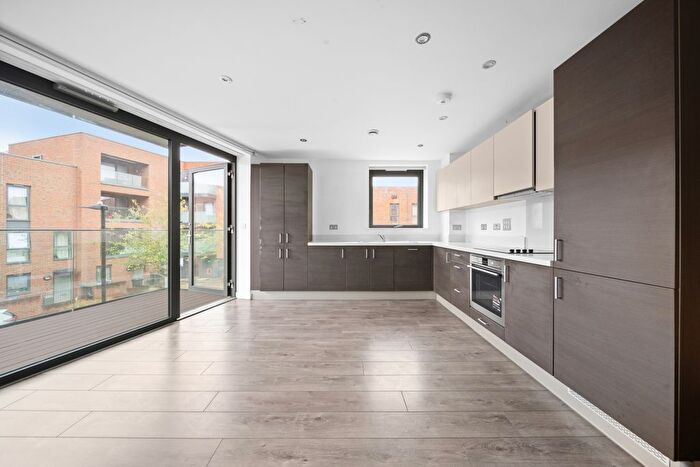
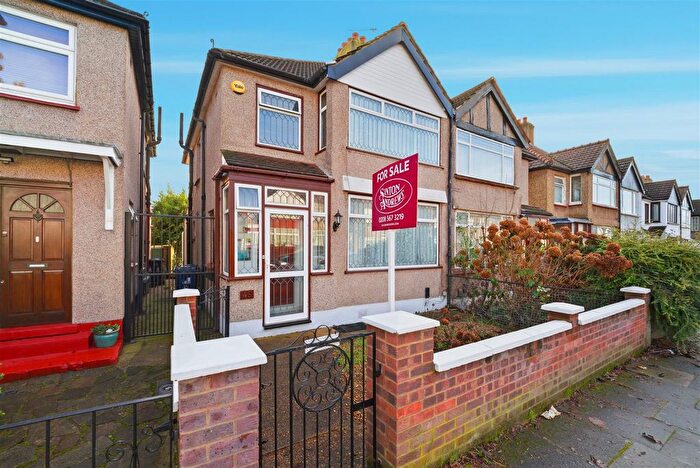
Houses for sale & to rent in Hobbayne, London
House Prices in Hobbayne
Properties in this part of Hobbayne within London have an average house price of £557,442.00 and had 309 Property Transactions within the last 3 years¹. This area has 5,286 households² , where the most expensive property was sold for £1,920,000.00.
Properties for sale in Hobbayne
Roads and Postcodes in Hobbayne
Navigate through our locations to find the location of your next house in Hobbayne, London for sale or to rent.
| Streets | Postcodes |
|---|---|
| Alcott Close | W7 1PE |
| Allingham Close | W7 1NA W7 1NB |
| Alwyne Road | W7 3EN |
| April Close | W7 3AT W7 3HF |
| Beechmount Avenue | W7 3AE W7 3AF W7 3AG W7 3AQ |
| Benham Road | W7 1AQ |
| Beresford Avenue | W7 3AJ W7 3AL W7 3AP |
| Bordars Road | W7 1AF W7 1AG W7 1AJ W7 1AL W7 1BF |
| Bordars Walk | W7 1JB |
| Brants Walk | W7 1BU |
| Brentmead Close | W7 3EW |
| Bridge Avenue | W7 3AR W7 3DJ W7 3GQ |
| Britton Terrace | W7 3AY |
| Brookbank Avenue | W7 3DN W7 3DW |
| Browning Avenue | W7 1AU W7 1AX W7 1EW |
| Campbell Road | W7 3EA W7 3EB W7 3ED |
| Chadwick Close | W7 1PR |
| Church Road | W7 3BD W7 3BE W7 3BH W7 3BJ W7 3BL W7 3BN W7 3BP W7 3BX W7 3BY W7 3BZ W7 3XP |
| Copley Close | W7 1BZ W7 1DD |
| Cotts Close | W7 1PS |
| Cowper Road | W7 1EH W7 1EJ W7 1EL |
| Cuckoo Avenue | W7 1BN W7 1BP W7 1BT W7 1BW W7 1BX |
| Cuckoo Dene | W7 3DP W7 3DR W7 3DS W7 3DT |
| Cuckoo Lane | W7 3EY |
| Drayton Bridge Road | W7 1EP W7 1ER W7 1ET W7 1EX W7 1EU |
| Dryden Avenue | W7 1ES |
| Elfwine Road | W7 1JD |
| Elm Villas | W7 3EZ |
| Elmbank Way | W7 3DE W7 3DF W7 3DG W7 3DQ |
| Elmwood Gardens | W7 3HA |
| Framfield Road | W7 1NG W7 1NH W7 1NJ W7 1NQ |
| Gifford Gardens | W7 3AN W7 3AS W7 3AW |
| Golden Manor | W7 3EE W7 3EG W7 3EH W7 3EQ W7 3EF W7 3HB |
| Greatdown Road | W7 1AP W7 1AR W7 1JR W7 1JS |
| Greenford Avenue | W7 1AA W7 1AD W7 1HA W7 1JH W7 1JJ W7 1LD W7 1LJ W7 1LL W7 1LP W7 1LZ W7 3AA W7 3AB W7 3AD W7 3DA W7 3DB W7 3DD W7 3QP W7 3QS W7 3QT W7 3AH |
| Grove Avenue | W7 3EP W7 3ER W7 3ES W7 3ET W7 3EX |
| Hale Walk | W7 1AE |
| Hall Drive | W7 1AB |
| Hanway Road | W7 3AU W7 3RN W7 3RP W7 3RR W7 3RW W7 3RS |
| Harp Road | W7 1JE W7 1JF W7 1JG W7 1JQ |
| High Lane | W7 3RT |
| Highland Avenue | W7 3RE W7 3RF |
| Hillyard Road | W7 1BH W7 1BJ |
| Hobbayne Road | W7 3RG W7 3RJ W7 3RL W7 3RQ |
| Homefarm Road | W7 1NL W7 1NP W7 1NR W7 1PP |
| Kennedy Path | W7 1JP |
| Kennedy Road | W7 1JL W7 1JN W7 1JW |
| Laurie Road | W7 1BG W7 1BL W7 1BQ |
| Lile Crescent | W7 1AH |
| Lime Terrace | W7 3HE |
| Littlejohn Road | W7 1NS |
| Madge Hill | W7 3BW |
| Manor Court Road | W7 3EJ W7 3EL W7 3HD |
| Mayfield Gardens | W7 3RA W7 3RB W7 3RD W7 3RH |
| Milton Road | W7 1LE W7 1LF W7 1LG W7 1LQ |
| Oakley Close | W7 3BQ |
| Old Twelve Close | W7 1JA |
| Park Road | W7 1EN W7 1LY |
| Riverside Close | W7 1BY |
| Ruislip Road East | W7 1BS W7 1DA |
| Shakespeare Road | W7 1LR W7 1LS W7 1LT W7 1LU W7 1LX |
| Sharpe Close | W7 1BD |
| Stephenson Road | W7 1NN W7 1NW |
| Studland Road | W7 3QU W7 3QX W7 3QY W7 3QZ |
| Templeman Road | W7 1AS W7 1AT W7 1BE |
| Tennyson Road | W7 1LH W7 1LN W7 1LW |
| Treebank Gardens | W7 3FB |
| Upfield Road | W7 1AN W7 1AW |
| Wakeling Road | W7 1NX |
| Westcott Crescent | W7 1NT W7 1NU W7 1PA W7 1PB W7 1PD W7 1PH W7 1PJ W7 1PL |
| Westview Close | W7 3DZ |
| Yeats Close | W7 1NE |
Transport near Hobbayne
-
Castle Bar Park Station
-
Drayton Green Station
-
Hanwell Station
-
West Ealing Station
-
South Greenford Station
-
Perivale Station
-
Greenford Station
-
Ealing Broadway Station
-
Northfields Station
-
Boston Manor Station
- FAQ
- Price Paid By Year
- Property Type Price
Frequently asked questions about Hobbayne
What is the average price for a property for sale in Hobbayne?
The average price for a property for sale in Hobbayne is £557,442. This amount is 23% lower than the average price in London. There are 1,856 property listings for sale in Hobbayne.
What streets have the most expensive properties for sale in Hobbayne?
The streets with the most expensive properties for sale in Hobbayne are Park Road at an average of £1,145,000, Grove Avenue at an average of £976,843 and Elmwood Gardens at an average of £932,500.
What streets have the most affordable properties for sale in Hobbayne?
The streets with the most affordable properties for sale in Hobbayne are Riverside Close at an average of £279,250, Oakley Close at an average of £300,000 and April Close at an average of £367,000.
Which train stations are available in or near Hobbayne?
Some of the train stations available in or near Hobbayne are Castle Bar Park, Drayton Green and Hanwell.
Which tube stations are available in or near Hobbayne?
Some of the tube stations available in or near Hobbayne are Perivale, Greenford and Ealing Broadway.
Property Price Paid in Hobbayne by Year
The average sold property price by year was:
| Year | Average Sold Price | Price Change |
Sold Properties
|
|---|---|---|---|
| 2025 | £548,555 | -3% |
85 Properties |
| 2024 | £562,698 | 1% |
119 Properties |
| 2023 | £558,681 | -6% |
105 Properties |
| 2022 | £594,500 | 4% |
150 Properties |
| 2021 | £571,163 | 2% |
192 Properties |
| 2020 | £561,603 | 10% |
110 Properties |
| 2019 | £504,421 | -3% |
117 Properties |
| 2018 | £519,227 | 3% |
137 Properties |
| 2017 | £505,704 | -3% |
115 Properties |
| 2016 | £521,306 | 8% |
102 Properties |
| 2015 | £481,766 | 10% |
134 Properties |
| 2014 | £431,938 | 17% |
134 Properties |
| 2013 | £360,664 | 7% |
157 Properties |
| 2012 | £337,206 | 8% |
123 Properties |
| 2011 | £309,818 | 1% |
128 Properties |
| 2010 | £307,376 | 11% |
138 Properties |
| 2009 | £274,990 | -6% |
103 Properties |
| 2008 | £292,023 | -2% |
101 Properties |
| 2007 | £297,969 | 14% |
230 Properties |
| 2006 | £254,946 | 4% |
269 Properties |
| 2005 | £245,668 | 1% |
238 Properties |
| 2004 | £242,461 | 10% |
259 Properties |
| 2003 | £219,323 | 9% |
254 Properties |
| 2002 | £200,370 | 15% |
264 Properties |
| 2001 | £170,176 | 14% |
239 Properties |
| 2000 | £146,679 | 10% |
214 Properties |
| 1999 | £132,455 | 19% |
278 Properties |
| 1998 | £107,324 | 14% |
253 Properties |
| 1997 | £92,694 | 3% |
236 Properties |
| 1996 | £90,311 | 11% |
203 Properties |
| 1995 | £80,071 | - |
153 Properties |
Property Price per Property Type in Hobbayne
Here you can find historic sold price data in order to help with your property search.
The average Property Paid Price for specific property types in the last three years are:
| Property Type | Average Sold Price | Sold Properties |
|---|---|---|
| Flat | £388,634.00 | 113 Flats |
| Semi Detached House | £713,196.00 | 67 Semi Detached Houses |
| Detached House | £1,216,200.00 | 5 Detached Houses |
| Terraced House | £600,557.00 | 124 Terraced Houses |

