
Houses for sale & to rent in London, Ealing London Borough
House Prices in London, Ealing London Borough
Properties in this part of London within the Ealing London Borough have an average house price of £724k and had 6,267 Property Transactions within the last 3 years.¹ This area has 70,865 households² , where the most expensive property was sold for £19.13M.
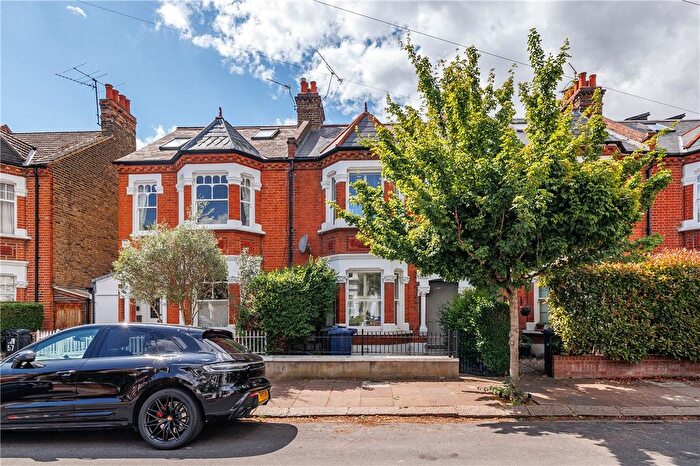
Properties for sale in London, Ealing London Borough
![]()
If you are looking to sell your house, let it out, or receive a property valuation, an expert can help you.
Click the button below to get started.
Neighbourhoods in London, Ealing London Borough
Navigate through our locations to find the location of your next house in London, Ealing London Borough for sale or to rent.
Transport in London, Ealing London Borough
Please see below transportation links in this area:
-


 Ealing Broadway Station
 -
Ealing Common Station
-
North Ealing Station
-
West Acton Station
-
South Ealing Station
-
Acton Town Station
-
West Ealing Station
-
Park Royal Station
-
Northfields Station
-
Hanger Lane Station
- FAQ
- Price Paid By Year
- Property Type Price
Frequently asked questions about London, Ealing London Borough
What is the average price for a property for sale in London, Ealing London Borough?
The average price for a property for sale in London, Ealing London Borough is £724,255. This amount is 14% higher than the average price in Ealing London Borough. There are more than 10,000 property listings for sale in London, Ealing London Borough.
What locations have the most expensive properties for sale in London, Ealing London Borough?
The locations with the most expensive properties for sale in London, Ealing London Borough are Southfield at an average of £916,373, Ealing Broadway at an average of £841,664 and Walpole at an average of £808,828.
What locations have the most affordable properties for sale in London, Ealing London Borough?
The locations with the most affordable properties for sale in London, Ealing London Borough are East Acton at an average of £499,966, Hobbayne at an average of £562,906 and Elthorne at an average of £587,675.
Which train stations are available in or near London, Ealing London Borough?
Some of the train stations available in or near London, Ealing London Borough are Ealing Broadway and West Ealing.
Which tube stations are available in or near London, Ealing London Borough?
Some of the tube stations available in or near London, Ealing London Borough are Ealing Broadway, Ealing Common and North Ealing.
Property Price Paid in London, Ealing London Borough by Year
The average sold property price by year was:
| Year | Average Sold Price | Price Change |
Sold Properties
|
|---|---|---|---|
| 2026 | £696,752 | -4% |
127 Properties |
| 2025 | £726,699 | -2% |
1,829 Properties |
| 2024 | £738,052 | 4% |
2,301 Properties |
| 2023 | £707,974 | -4% |
2,010 Properties |
| 2022 | £737,864 | 5% |
2,418 Properties |
| 2021 | £701,480 | 3% |
2,921 Properties |
| 2020 | £680,044 | 5% |
1,825 Properties |
| 2019 | £642,643 | -1% |
2,094 Properties |
| 2018 | £648,258 | -5% |
2,021 Properties |
| 2017 | £683,385 | 6% |
1,991 Properties |
| 2016 | £643,668 | 3% |
2,310 Properties |
| 2015 | £622,998 | 3% |
2,598 Properties |
| 2014 | £607,388 | 17% |
2,434 Properties |
| 2013 | £504,340 | 9% |
2,718 Properties |
| 2012 | £460,280 | 5% |
2,330 Properties |
| 2011 | £436,072 | 6% |
2,114 Properties |
| 2010 | £411,402 | 6% |
2,139 Properties |
| 2009 | £385,953 | -1% |
1,575 Properties |
| 2008 | £390,300 | 1% |
1,630 Properties |
| 2007 | £385,067 | 13% |
3,857 Properties |
| 2006 | £335,224 | 6% |
4,256 Properties |
| 2005 | £314,056 | 5% |
2,972 Properties |
| 2004 | £299,063 | 6% |
3,511 Properties |
| 2003 | £280,176 | 4% |
3,183 Properties |
| 2002 | £269,131 | 12% |
3,919 Properties |
| 2001 | £236,643 | 8% |
3,742 Properties |
| 2000 | £217,441 | 16% |
3,242 Properties |
| 1999 | £182,186 | 16% |
4,047 Properties |
| 1998 | £153,303 | 13% |
3,512 Properties |
| 1997 | £133,172 | 14% |
3,815 Properties |
| 1996 | £114,022 | 6% |
3,379 Properties |
| 1995 | £106,672 | - |
2,585 Properties |
Property Price per Property Type in London, Ealing London Borough
Here you can find historic sold price data in order to help with your property search.
The average Property Paid Price for specific property types in the last three years are:
| Property Type | Average Sold Price | Sold Properties |
|---|---|---|
| Semi Detached House | £1,079,048.00 | 926 Semi Detached Houses |
| Terraced House | £871,042.00 | 1,748 Terraced Houses |
| Detached House | £1,887,441.00 | 240 Detached Houses |
| Flat | £466,490.00 | 3,353 Flats |