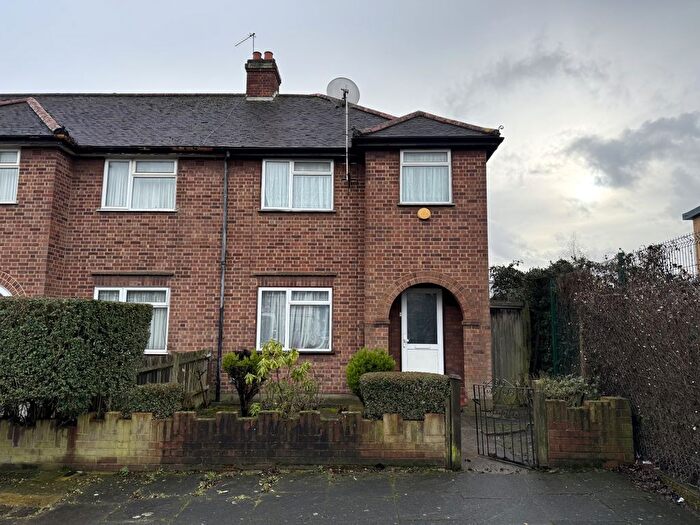
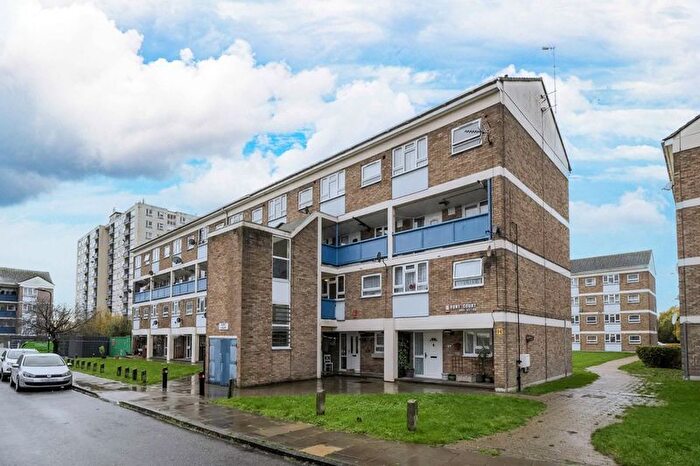
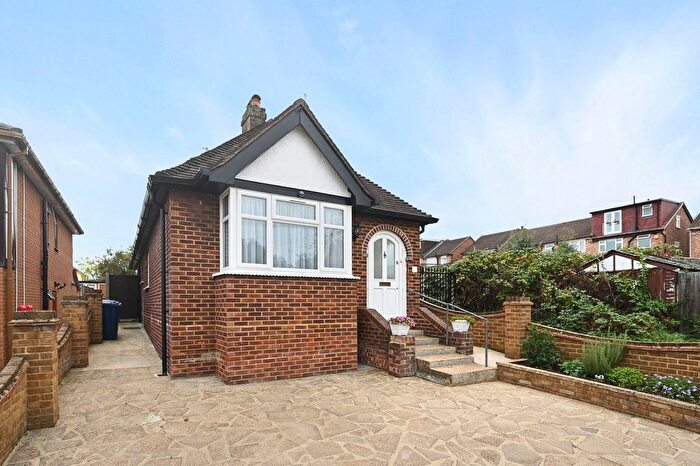
Houses for sale & to rent in Greenford Broadway, Northolt
House Prices in Greenford Broadway
Properties in this part of Greenford Broadway within Northolt have an average house price of £315,882.00 and had 138 Property Transactions within the last 3 years¹. This area has 2,443 households² , where the most expensive property was sold for £715,000.00.
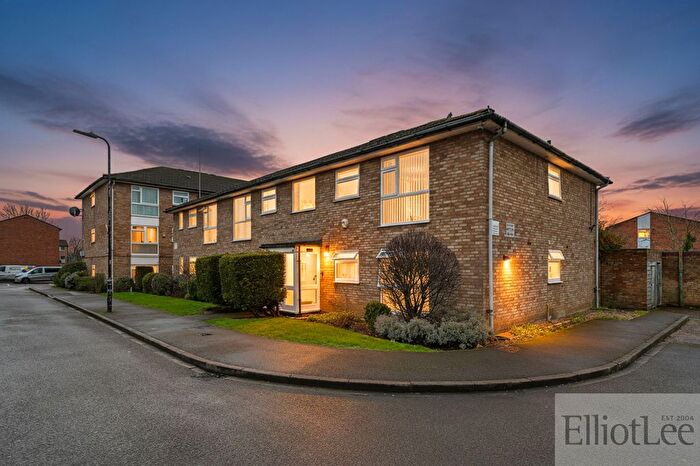
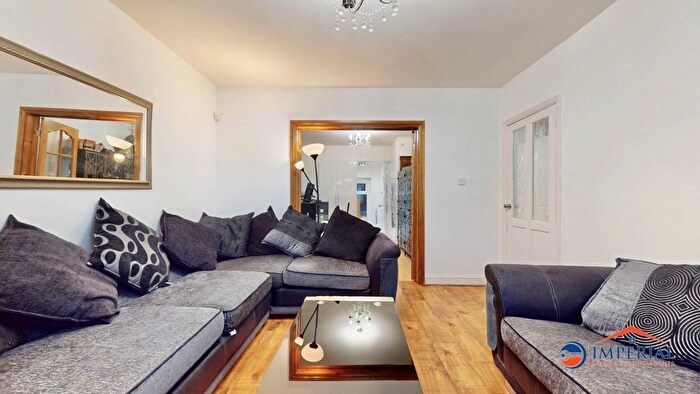
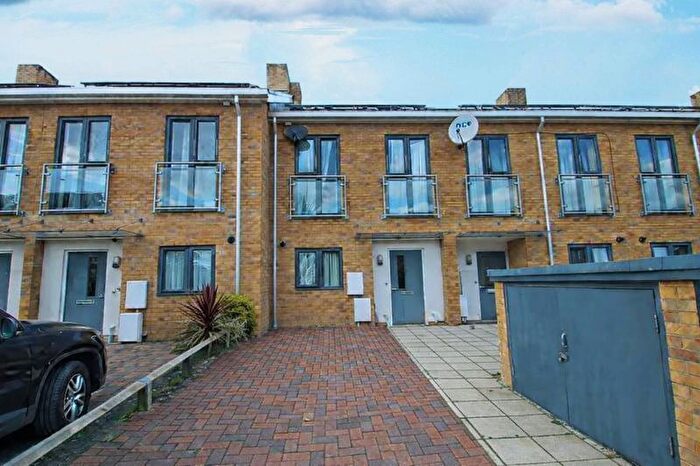
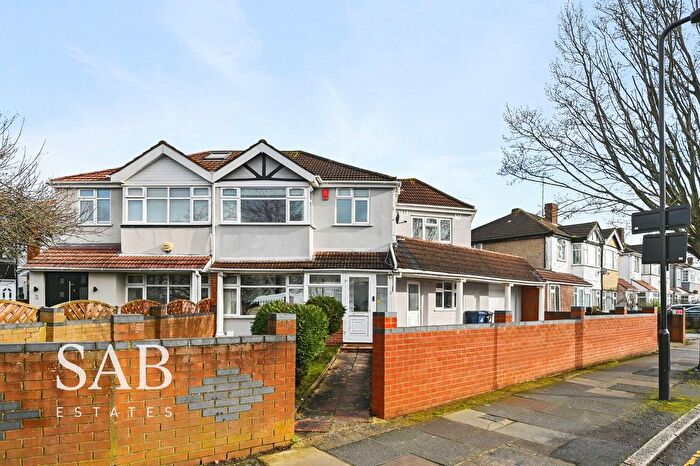
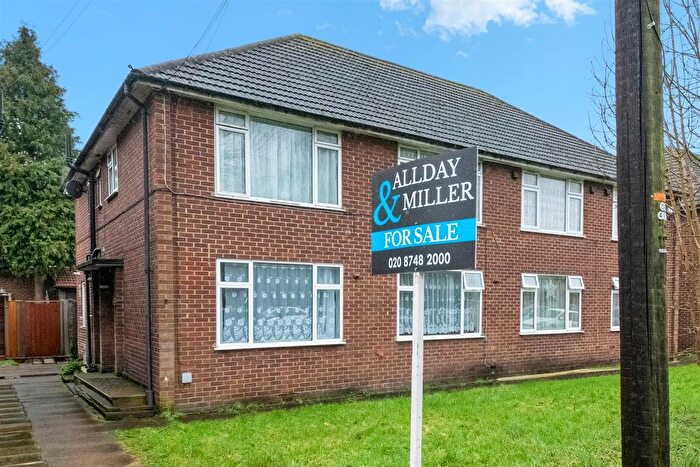
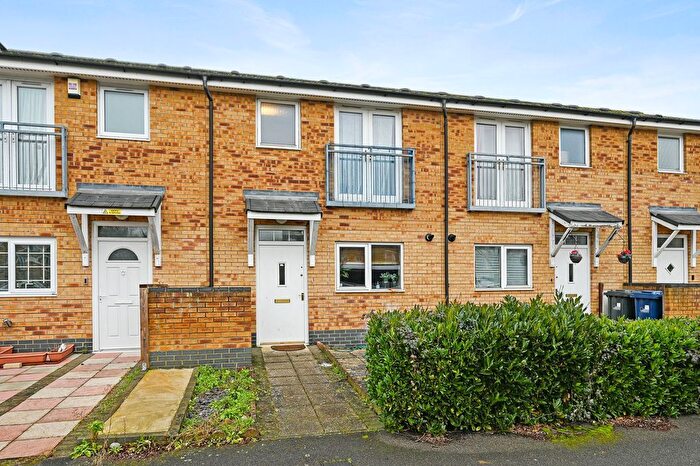
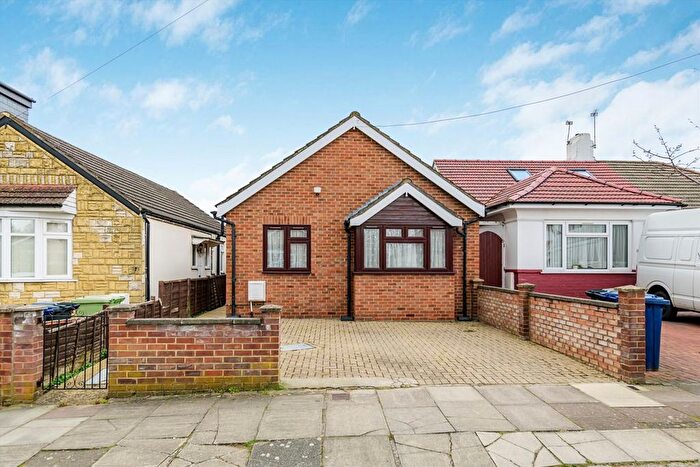
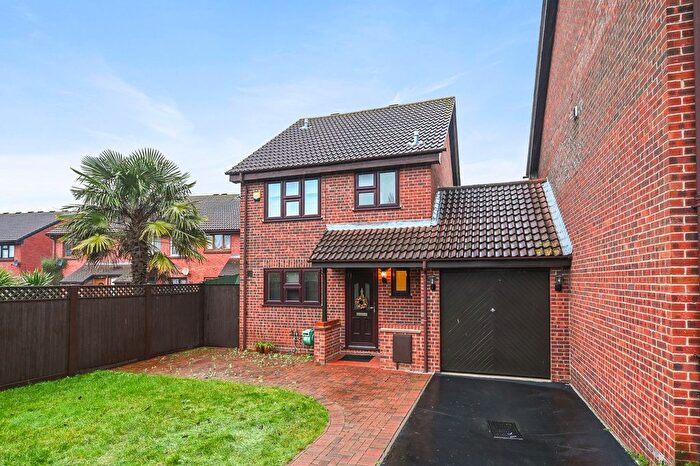
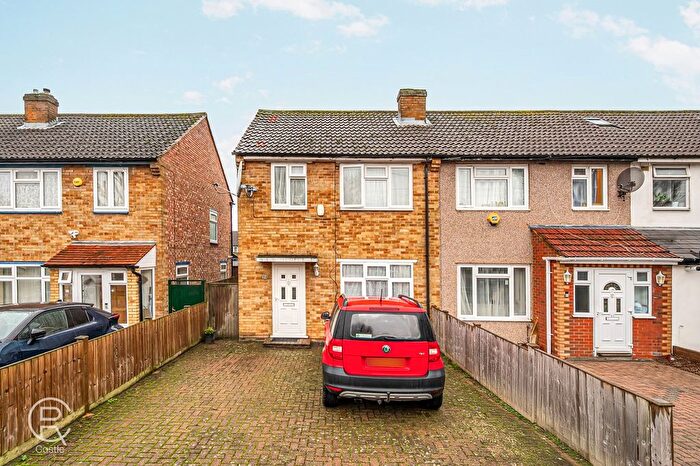
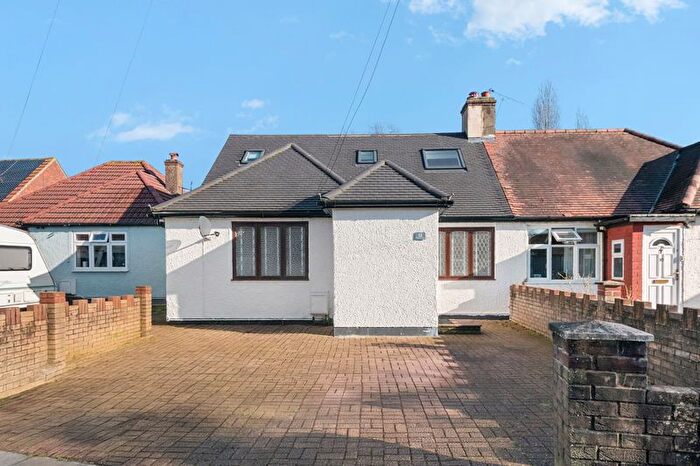
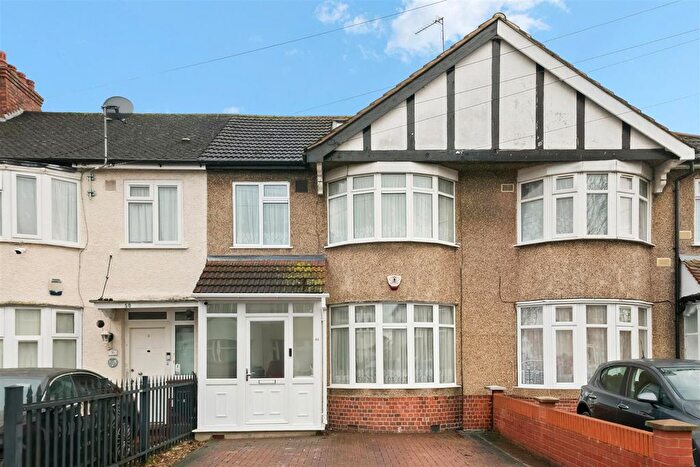
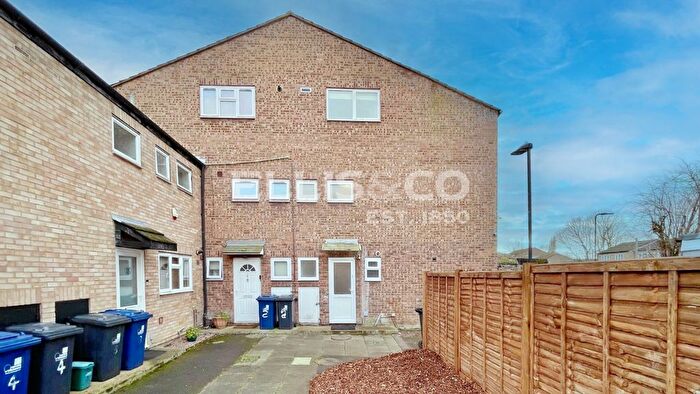
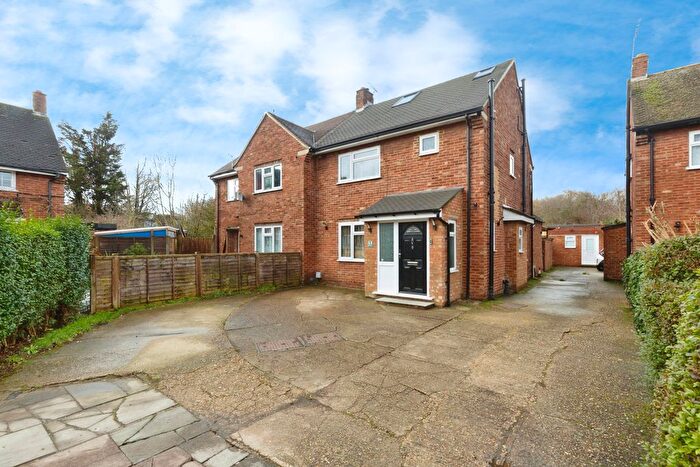
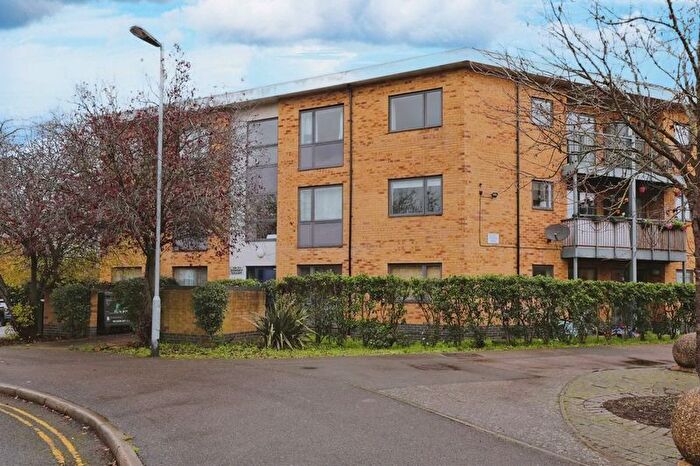
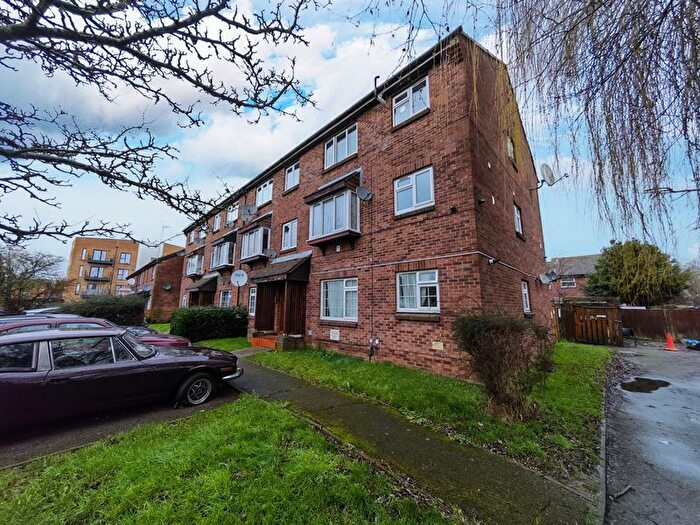
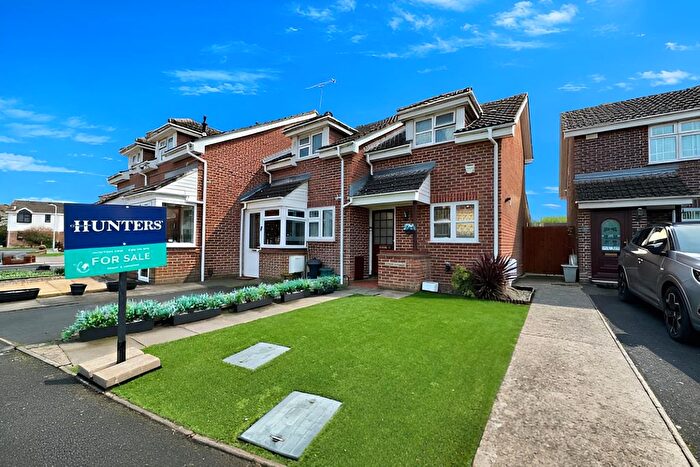
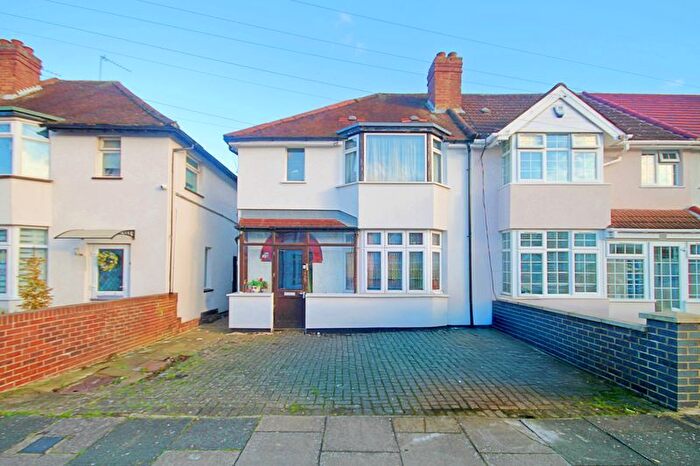
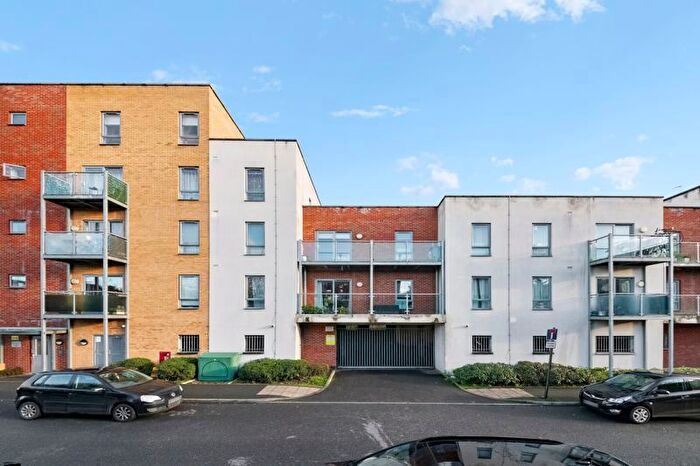
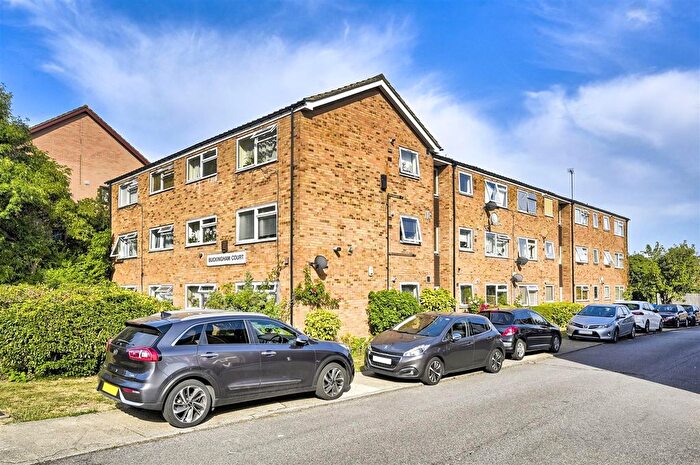
Properties for sale in Greenford Broadway
Roads and Postcodes in Greenford Broadway
Navigate through our locations to find the location of your next house in Greenford Broadway, Northolt for sale or to rent.
| Streets | Postcodes |
|---|---|
| Abbey Close | UB5 6RN |
| Apprentice Gardens | UB5 6GP |
| Ballinger Way | UB5 6FR UB5 6GG |
| Banbury Walk | UB5 6TJ |
| Brick Lane | UB5 6GS |
| Broadmead Road | UB5 6FS UB5 6FT UB5 6FY UB5 6FZ UB5 6FX |
| Brunel Close | UB5 6RW |
| Casey Avenue | UB5 6SP |
| Cathay Walk | UB5 6TD |
| Condor Path | UB5 6TA |
| Court Mead | UB5 6DH |
| Crawford Gardens | UB5 6BQ |
| Dolphin Road | UB5 6UQ |
| Downside Walk | UB5 6RP |
| Elm Tree Close | UB5 6AP UB5 6AR |
| Engineers Wharf | UB5 6GT |
| Farrier Road | UB5 6TT UB5 6TU UB5 6TX UB5 6TY |
| Founders Close | UB5 6GN |
| Greenhill Gardens | UB5 6BU UB5 6BX UB5 6SU UB5 6SW |
| Greenhill Terrace | UB5 6BY |
| Hamble Walk | UB5 6TB |
| Hazelmere Close | UB5 6UP |
| Hazelmere Drive | UB5 6UT |
| Hazelmere Road | UB5 6UJ UB5 6UL UB5 6UN UB5 6UW |
| Hazelmere Walk | UB5 6UR |
| Hermes Walk | UB5 6TG |
| Higham Mews | UB5 6DT UB5 6FP |
| Home Close | UB5 6DL |
| Horse Shoe Crescent | UB5 6TP |
| Hotspur Road | UB5 6TL UB5 6TN |
| Invicta Grove | UB5 6RR UB5 6RS |
| Kensington Road | UB5 6AL UB5 6AN UB5 6AW UB5 6AH |
| Leander Road | UB5 6TE UB5 6TF |
| Lingfield Court | UB5 6TR |
| Meadow Close | UB5 6TZ |
| Mersey Walk | UB5 6TH |
| Old Bridge Close | UB5 6UA |
| Paddock Close | UB5 6TS |
| Pump Close | UB5 6UG |
| Rectory Park Avenue | UB5 6SB UB5 6SD UB5 6SE UB5 6SG UB5 6SH UB5 6SJ UB5 6SL UB5 6SQ UB5 6HG UB5 6RF UB5 6SR UB5 6SS UB5 6ST UB5 6WW UB5 6BD UB5 6DN |
| Ruislip Road | UB5 6AS UB5 6BG UB5 6BH UB5 6AT UB5 6BJ |
| Shadwell Court | UB5 6DQ |
| Shadwell Drive | UB5 6DB UB5 6DD UB5 6DE UB5 6DF UB5 6DG |
| Stable Close | UB5 6TW |
| Star Path | UB5 6TQ |
| Swallow Drive | UB5 6UH |
| Taywood Road | UB5 6FU UB5 6GA UB5 6GB UB5 6GD UB5 6GE UB5 6GF UB5 6GU UB5 6GW UB5 6GX UB5 6WS UB5 6GY UB5 6WL UB5 6WT |
| Thorn Close | UB5 6DJ |
| Towney Mead | UB5 6BZ |
| Towney Mead Court | UB5 6DA |
| Union Road | UB5 6UB UB5 6UD UB5 6UE UB5 6UF |
| Waterside Close | UB5 6DW |
| Waxlow Way | UB5 6FN UB5 6FW |
Transport near Greenford Broadway
-
Northolt Station
-
Greenford Station
-
South Greenford Station
-
Northolt Park Station
-
South Ruislip Station
-
Southall Station
-
Castle Bar Park Station
-
Hanwell Station
-
Perivale Station
-
Drayton Green Station
- FAQ
- Price Paid By Year
- Property Type Price
Frequently asked questions about Greenford Broadway
What is the average price for a property for sale in Greenford Broadway?
The average price for a property for sale in Greenford Broadway is £315,882. This amount is 20% lower than the average price in Northolt. There are 1,659 property listings for sale in Greenford Broadway.
What streets have the most expensive properties for sale in Greenford Broadway?
The streets with the most expensive properties for sale in Greenford Broadway are Court Mead at an average of £715,000, Home Close at an average of £572,500 and Thorn Close at an average of £540,000.
What streets have the most affordable properties for sale in Greenford Broadway?
The streets with the most affordable properties for sale in Greenford Broadway are Hotspur Road at an average of £198,000, Higham Mews at an average of £219,000 and Broadmead Road at an average of £220,000.
Which train stations are available in or near Greenford Broadway?
Some of the train stations available in or near Greenford Broadway are Greenford, South Greenford and Northolt Park.
Which tube stations are available in or near Greenford Broadway?
Some of the tube stations available in or near Greenford Broadway are Northolt, Greenford and South Ruislip.
Property Price Paid in Greenford Broadway by Year
The average sold property price by year was:
| Year | Average Sold Price | Price Change |
Sold Properties
|
|---|---|---|---|
| 2025 | £342,258 | 13% |
44 Properties |
| 2024 | £298,464 | -4% |
56 Properties |
| 2023 | £311,013 | -12% |
38 Properties |
| 2022 | £348,592 | 9% |
38 Properties |
| 2021 | £316,593 | 11% |
44 Properties |
| 2020 | £282,254 | - |
43 Properties |
| 2019 | £282,116 | -3% |
42 Properties |
| 2018 | £289,249 | 3% |
51 Properties |
| 2017 | £280,870 | 2% |
56 Properties |
| 2016 | £275,143 | 11% |
64 Properties |
| 2015 | £245,996 | 10% |
74 Properties |
| 2014 | £220,577 | 10% |
65 Properties |
| 2013 | £198,423 | -0,3% |
62 Properties |
| 2012 | £199,050 | 10% |
62 Properties |
| 2011 | £178,369 | 5% |
47 Properties |
| 2010 | £169,022 | 1% |
49 Properties |
| 2009 | £166,618 | -18% |
72 Properties |
| 2008 | £196,858 | -1% |
88 Properties |
| 2007 | £198,386 | 2% |
165 Properties |
| 2006 | £195,033 | 1% |
123 Properties |
| 2005 | £193,315 | 9% |
208 Properties |
| 2004 | £176,601 | 15% |
88 Properties |
| 2003 | £149,501 | 14% |
77 Properties |
| 2002 | £128,930 | 22% |
64 Properties |
| 2001 | £100,993 | 14% |
69 Properties |
| 2000 | £86,840 | 17% |
68 Properties |
| 1999 | £72,081 | 8% |
52 Properties |
| 1998 | £66,179 | 5% |
67 Properties |
| 1997 | £62,546 | 16% |
54 Properties |
| 1996 | £52,476 | 8% |
23 Properties |
| 1995 | £48,211 | - |
33 Properties |
Property Price per Property Type in Greenford Broadway
Here you can find historic sold price data in order to help with your property search.
The average Property Paid Price for specific property types in the last three years are:
| Property Type | Average Sold Price | Sold Properties |
|---|---|---|
| Semi Detached House | £488,833.00 | 18 Semi Detached Houses |
| Terraced House | £452,200.00 | 25 Terraced Houses |
| Flat | £247,240.00 | 95 Flats |

