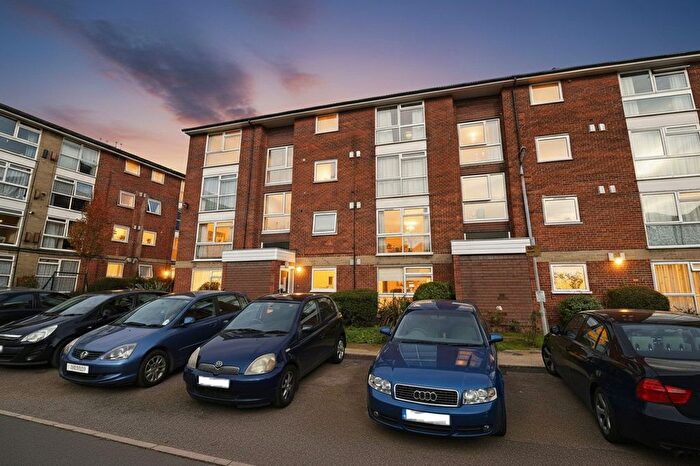
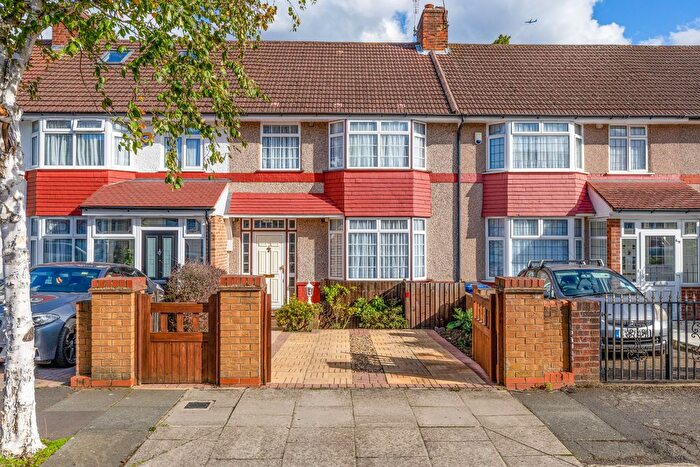
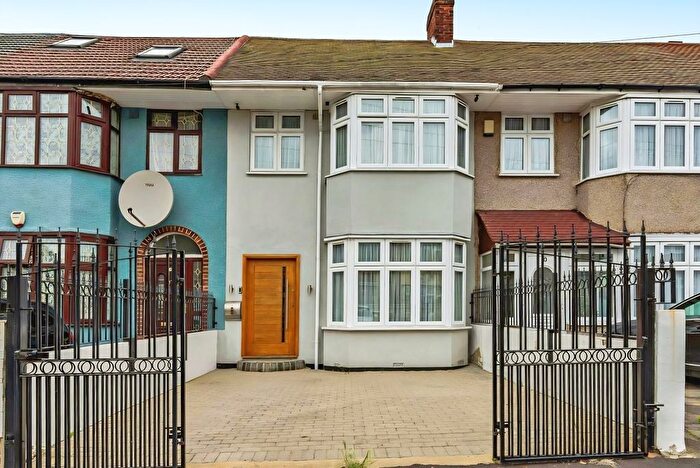
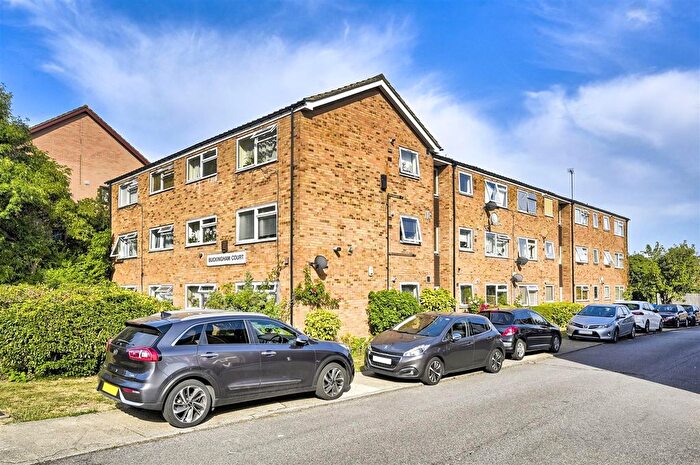
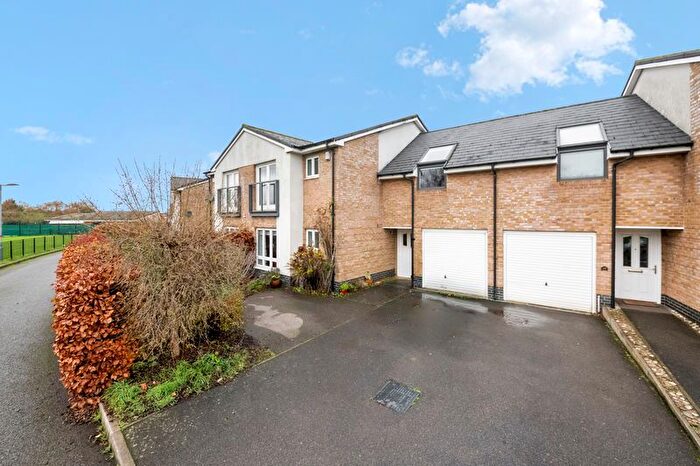
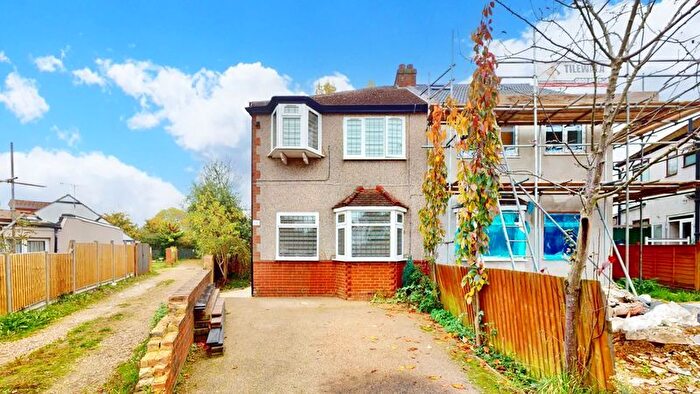
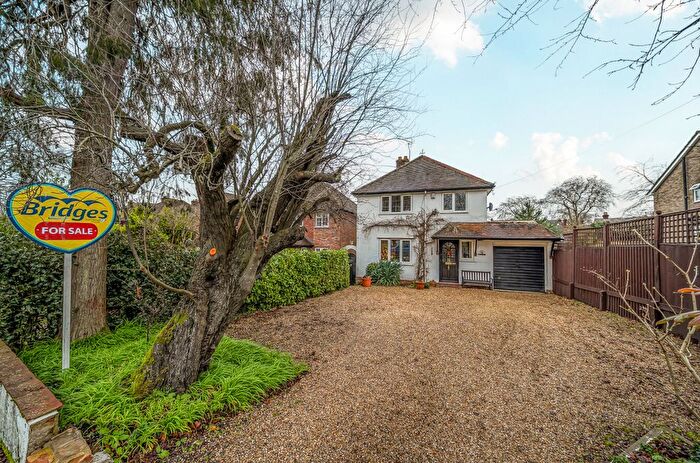
Houses for sale & to rent in Greenford Broadway, Southall
House Prices in Greenford Broadway
Properties in this part of Greenford Broadway within Southall have an average house price of £339,362.00 and had 29 Property Transactions within the last 3 years¹. This area has 504 households² , where the most expensive property was sold for £570,000.00.
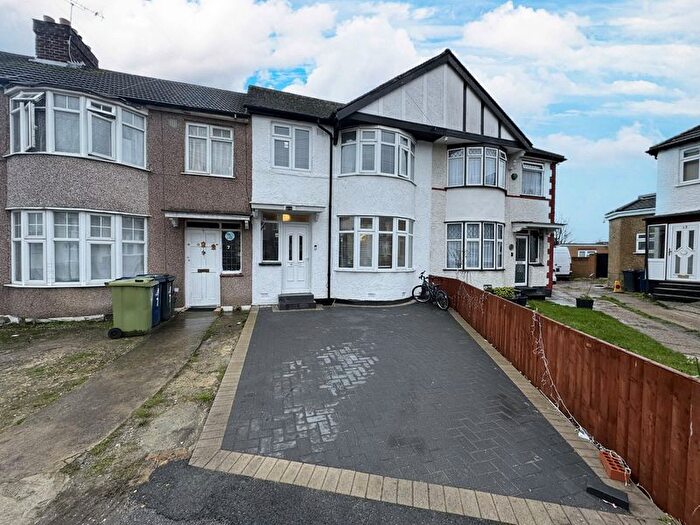
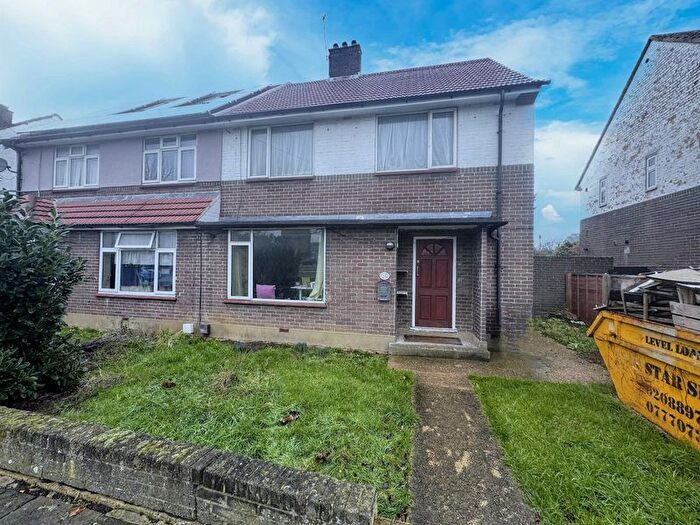
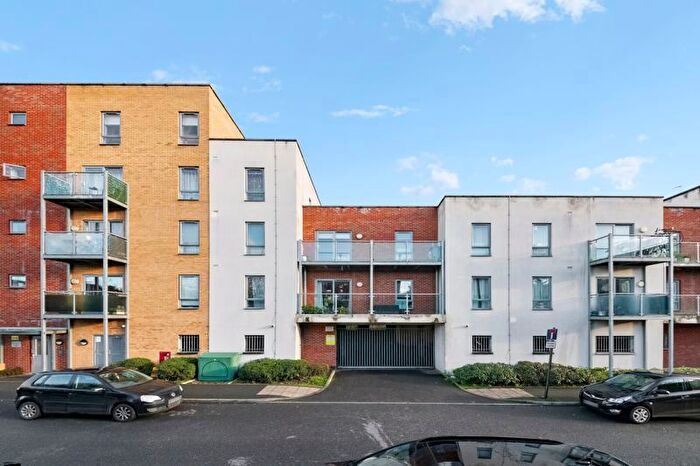
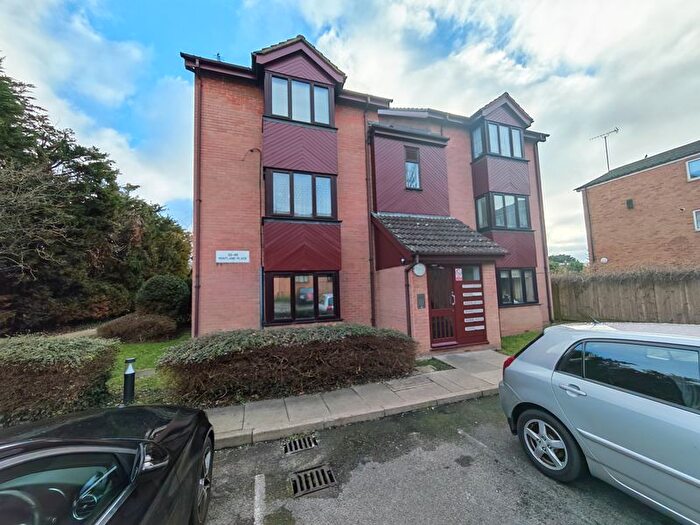
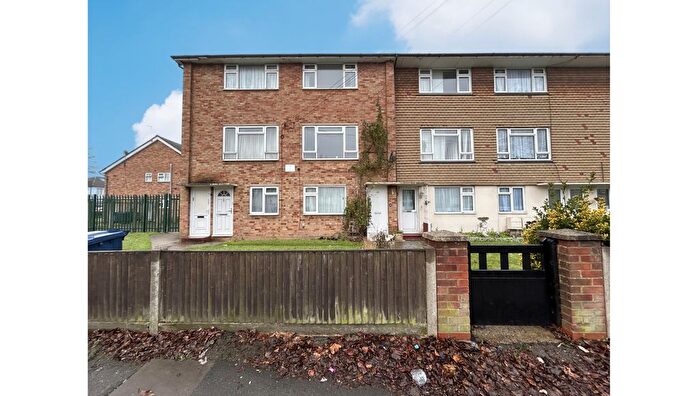
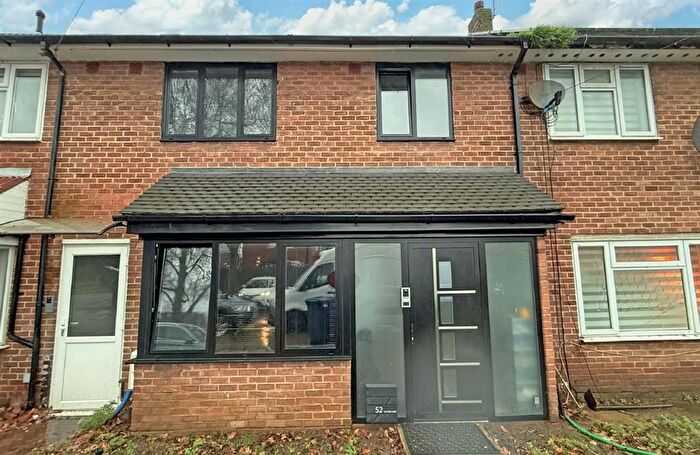
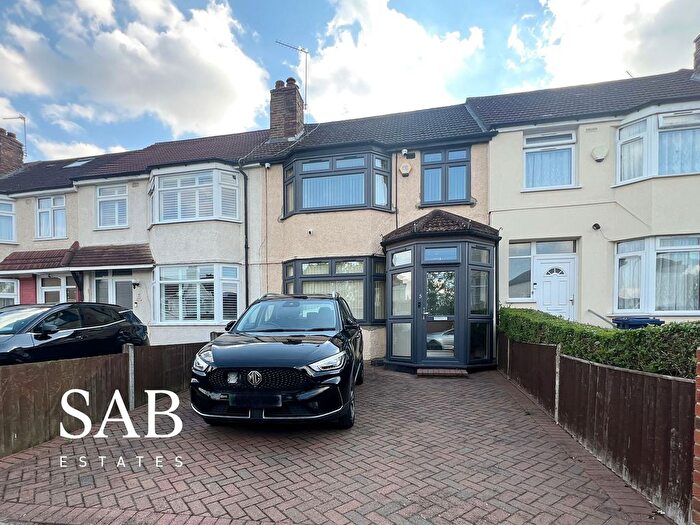
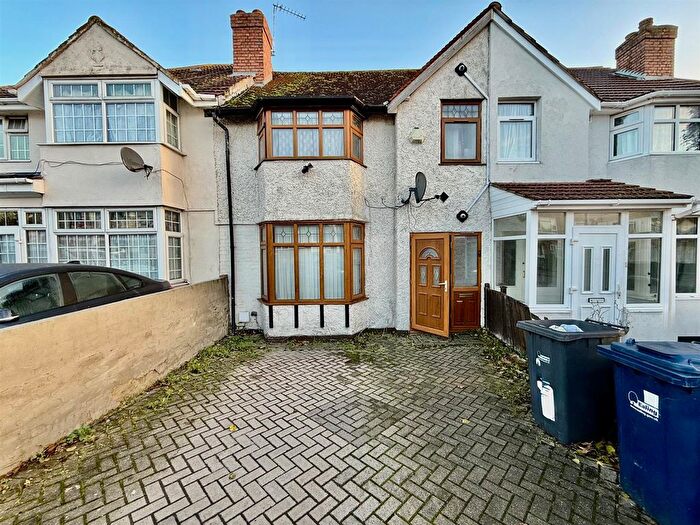
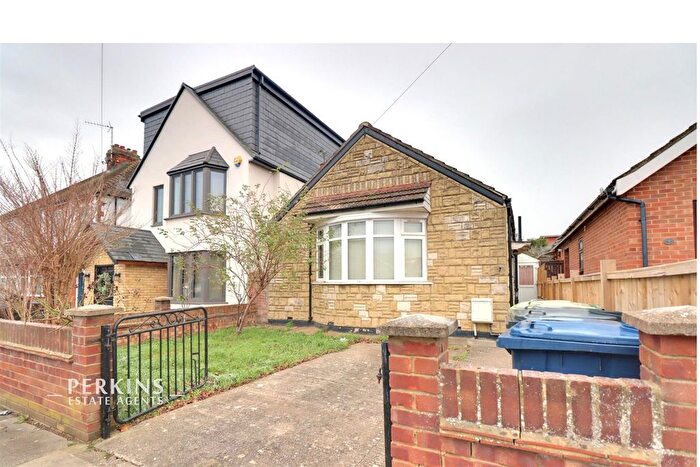
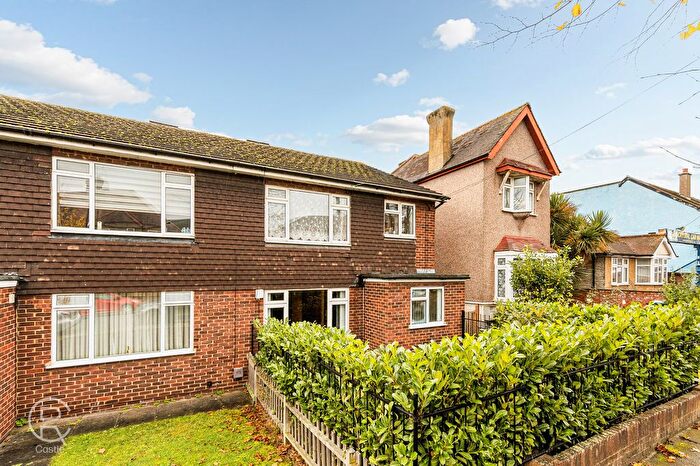
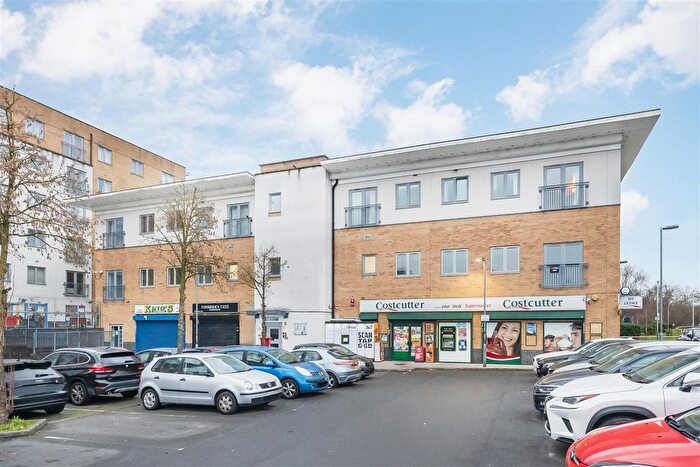
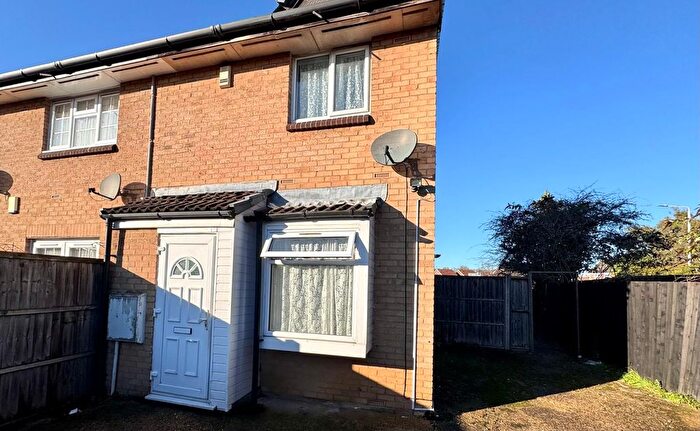
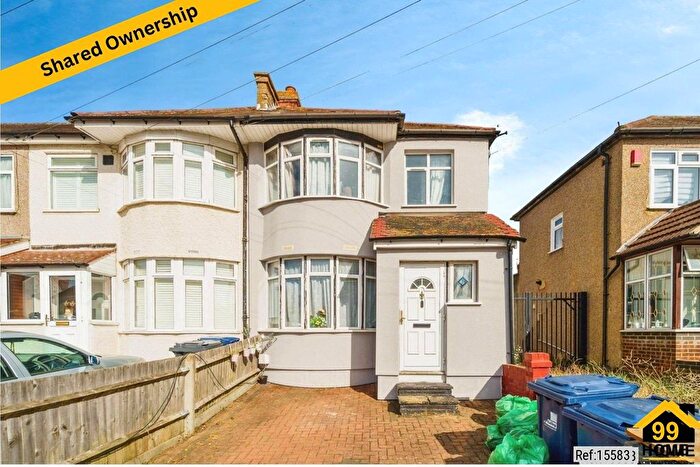
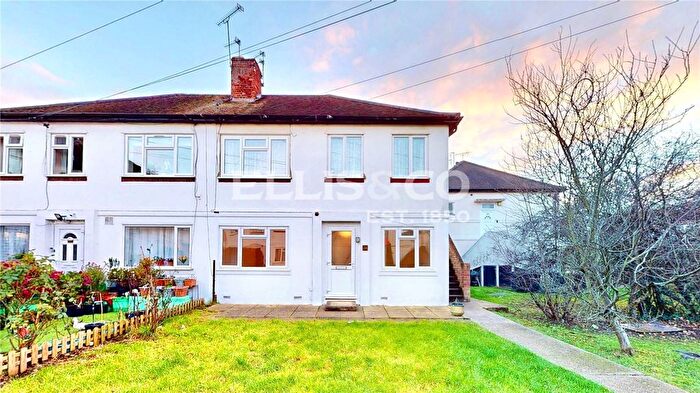
Properties for sale in Greenford Broadway
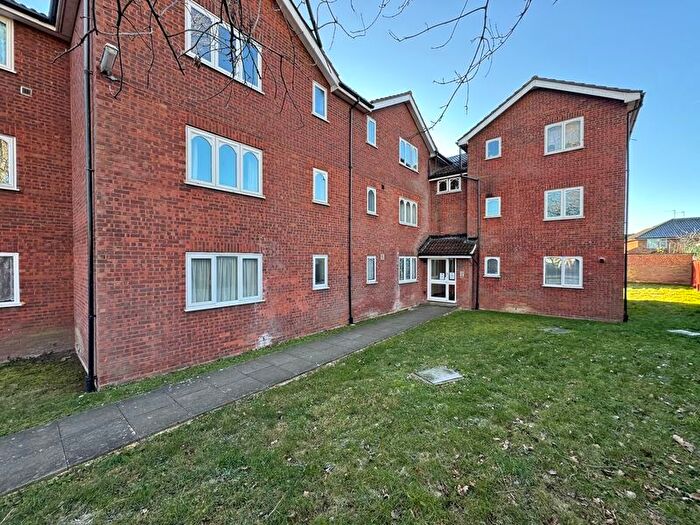
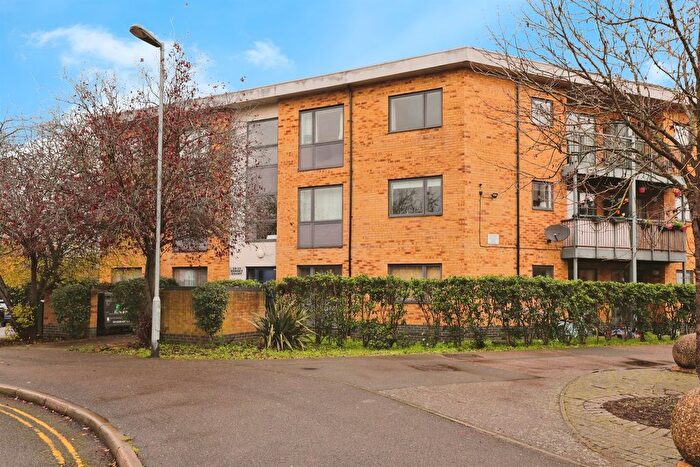
Previously listed properties in Greenford Broadway
Roads and Postcodes in Greenford Broadway
Navigate through our locations to find the location of your next house in Greenford Broadway, Southall for sale or to rent.
| Streets | Postcodes |
|---|---|
| Adrienne Avenue | UB1 2FJ UB1 2QW |
| Allenby Road | UB1 2HG UB1 2HS UB1 2HT |
| Coraline Close | UB1 2YP |
| Frensham Close | UB1 2YD UB1 2YE UB1 2YF UB1 2YG UB1 2YQ |
| Hadfield Close | UB1 2XU |
| Kenilworth Gardens | UB1 2QL |
| Lady Margaret Road | UB1 2NP UB1 2NW UB1 2NY UB1 2QD UB1 2QG UB1 2QQ UB1 2GU |
| Neal Avenue | UB1 2QR |
| Woodstock Avenue | UB1 2QN |
Transport near Greenford Broadway
-
Northolt Station
-
Greenford Station
-
South Greenford Station
-
Southall Station
-
Castle Bar Park Station
-
Northolt Park Station
-
Hanwell Station
-
Drayton Green Station
-
South Ruislip Station
-
Perivale Station
- FAQ
- Price Paid By Year
- Property Type Price
Frequently asked questions about Greenford Broadway
What is the average price for a property for sale in Greenford Broadway?
The average price for a property for sale in Greenford Broadway is £339,362. This amount is 23% lower than the average price in Southall. There are 1,582 property listings for sale in Greenford Broadway.
What streets have the most expensive properties for sale in Greenford Broadway?
The streets with the most expensive properties for sale in Greenford Broadway are Adrienne Avenue at an average of £356,250, Coraline Close at an average of £254,000 and Lady Margaret Road at an average of £225,450.
What streets have the most affordable properties for sale in Greenford Broadway?
The streets with the most affordable properties for sale in Greenford Broadway are Frensham Close at an average of £202,500 and Hadfield Close at an average of £215,000.
Which train stations are available in or near Greenford Broadway?
Some of the train stations available in or near Greenford Broadway are Greenford, South Greenford and Southall.
Which tube stations are available in or near Greenford Broadway?
Some of the tube stations available in or near Greenford Broadway are Northolt, Greenford and South Ruislip.
Property Price Paid in Greenford Broadway by Year
The average sold property price by year was:
| Year | Average Sold Price | Price Change |
Sold Properties
|
|---|---|---|---|
| 2025 | £301,666 | 35% |
6 Properties |
| 2024 | £197,400 | -60% |
5 Properties |
| 2023 | £315,800 | -33% |
5 Properties |
| 2022 | £420,423 | 46% |
13 Properties |
| 2021 | £227,187 | -10% |
8 Properties |
| 2020 | £249,600 | -35% |
5 Properties |
| 2019 | £336,571 | 10% |
7 Properties |
| 2018 | £304,555 | 17% |
9 Properties |
| 2017 | £251,468 | -4% |
8 Properties |
| 2016 | £261,664 | - |
21 Properties |
| 2015 | £261,714 | 19% |
14 Properties |
| 2014 | £211,100 | 12% |
14 Properties |
| 2013 | £184,818 | -4% |
11 Properties |
| 2012 | £192,500 | -6% |
9 Properties |
| 2011 | £204,250 | 29% |
8 Properties |
| 2010 | £145,908 | -17% |
6 Properties |
| 2009 | £170,850 | -15% |
10 Properties |
| 2008 | £197,125 | 4% |
15 Properties |
| 2007 | £189,565 | 7% |
26 Properties |
| 2006 | £175,979 | 4% |
27 Properties |
| 2005 | £168,939 | 4% |
19 Properties |
| 2004 | £162,357 | 13% |
33 Properties |
| 2003 | £140,651 | 5% |
36 Properties |
| 2002 | £133,633 | 27% |
37 Properties |
| 2001 | £97,786 | 14% |
40 Properties |
| 2000 | £84,058 | 20% |
35 Properties |
| 1999 | £67,479 | 18% |
31 Properties |
| 1998 | £55,620 | 2% |
29 Properties |
| 1997 | £54,526 | 22% |
32 Properties |
| 1996 | £42,576 | -16% |
13 Properties |
| 1995 | £49,576 | - |
36 Properties |
Property Price per Property Type in Greenford Broadway
Here you can find historic sold price data in order to help with your property search.
The average Property Paid Price for specific property types in the last three years are:
| Property Type | Average Sold Price | Sold Properties |
|---|---|---|
| Semi Detached House | £502,142.00 | 7 Semi Detached Houses |
| Flat | £219,218.00 | 16 Flats |
| Terraced House | £469,833.00 | 6 Terraced Houses |

