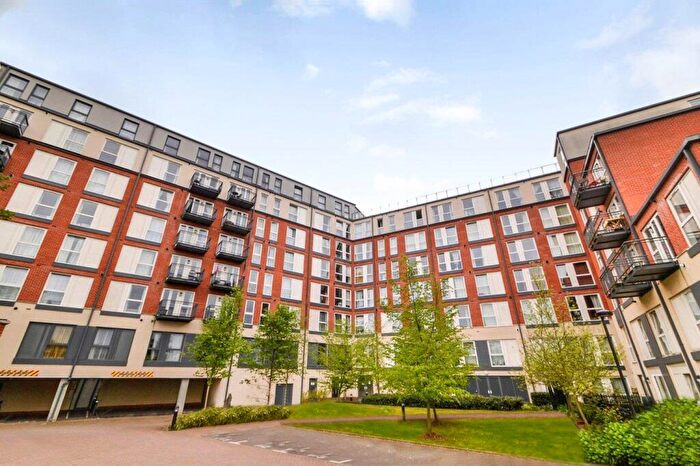
Houses for sale & to rent in North Greenford, Northolt
House Prices in North Greenford
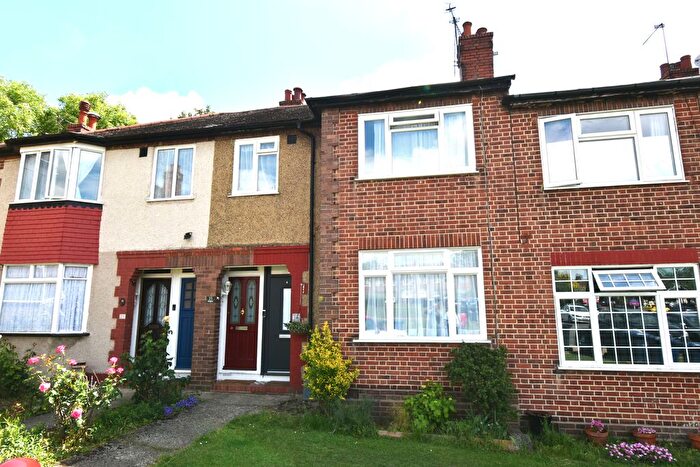
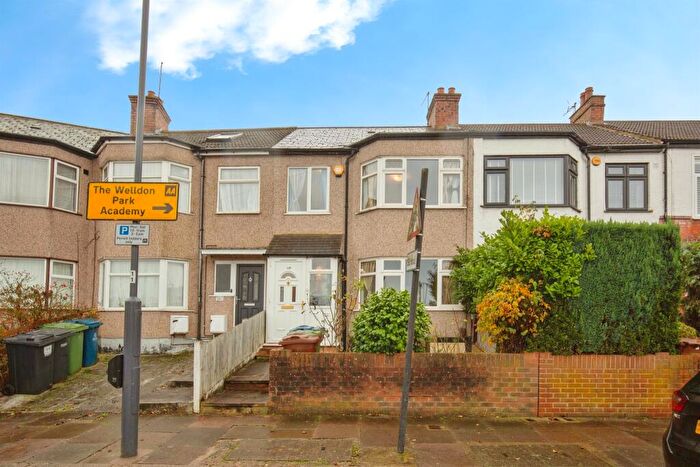
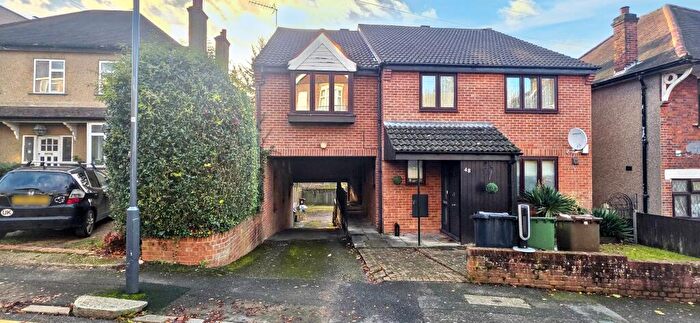
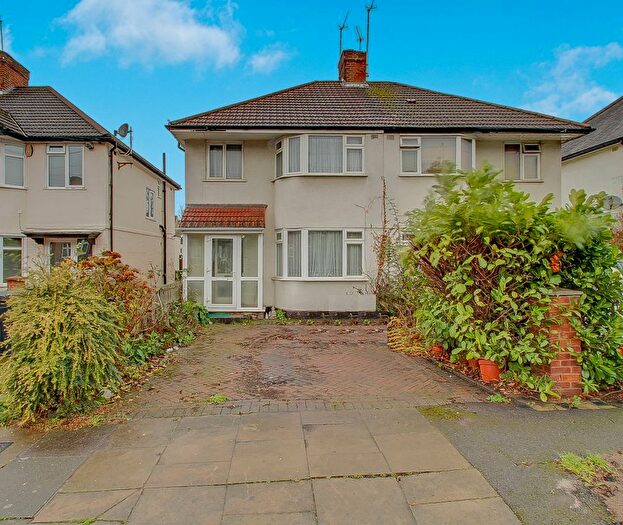
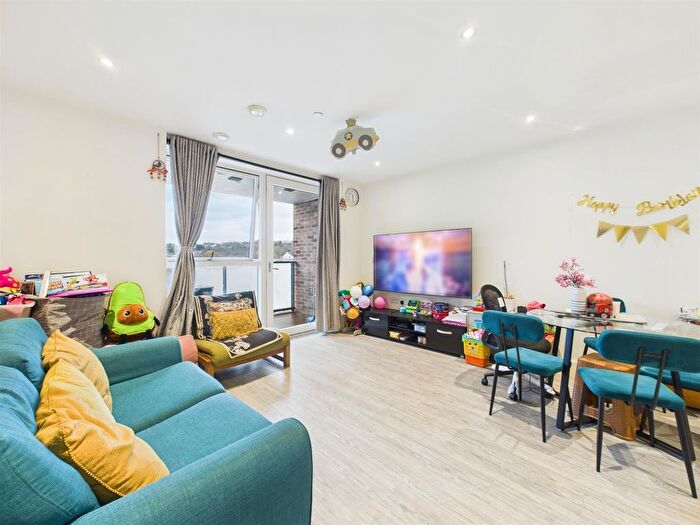
Properties in this part of North Greenford within Northolt have an average house price of £421,682.00 and had 128 Property Transactions within the last 3 years¹. This area has 1,291 households² , where the most expensive property was sold for £805,199.00.
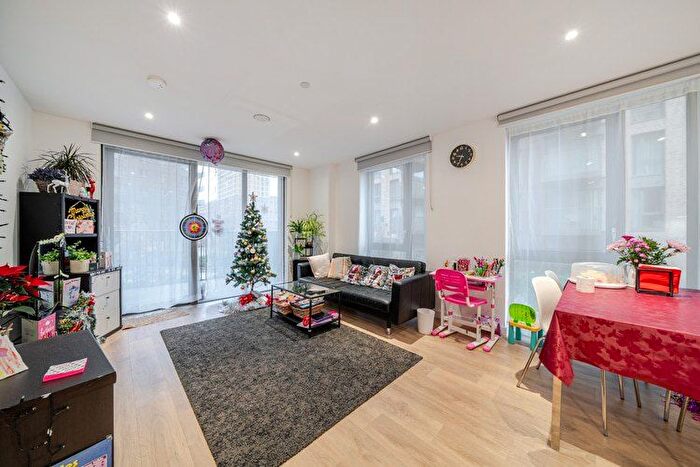
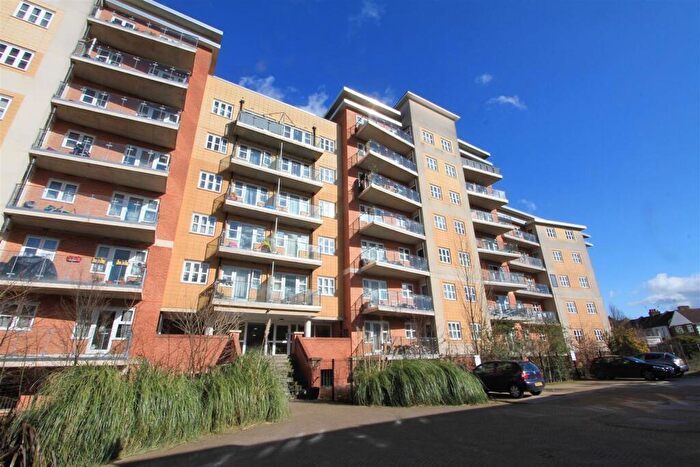
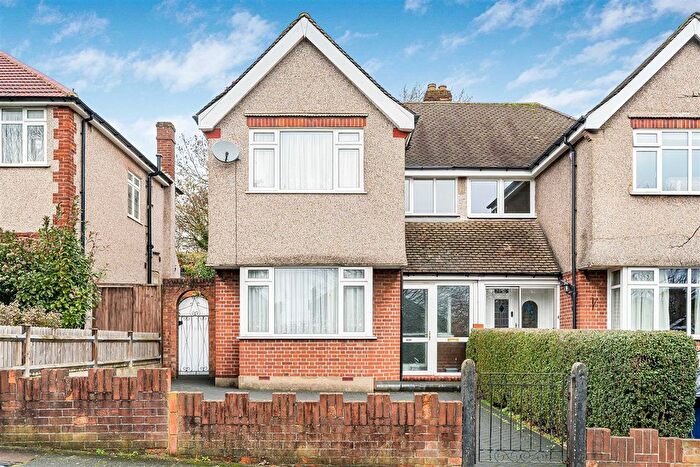
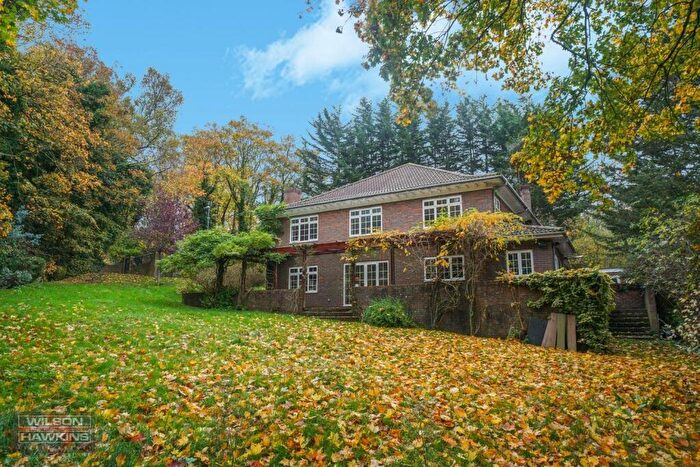
Properties for sale in North Greenford
Roads and Postcodes in North Greenford
Navigate through our locations to find the location of your next house in North Greenford, Northolt for sale or to rent.
| Streets | Postcodes |
|---|---|
| Acock Grove | UB5 4RT UB5 4RS |
| Cassandra Close | UB5 4RX |
| Clauson Avenue | UB5 4PR UB5 4PS UB5 4PT |
| Dorchester Close | UB5 4PE |
| Dorchester Road | UB5 4PA UB5 4PB UB5 4PD |
| Halsbury Road East | UB5 4PU UB5 4PX UB5 4PY UB5 4PZ |
| Halsbury Road West | UB5 4PL UB5 4PN UB5 4PP UB5 4PW |
| Hari Close | UB5 4FD |
| Hollydale Close | UB5 4XE |
| Keble Close | UB5 4QE |
| Killowen Avenue | UB5 4QT UB5 4QU |
| Land Adjoining | UB5 4NP |
| Merton Avenue | UB5 4QF |
| New Court | UB5 4PF |
| Petts Hill | UB5 4NW |
| Pilgrims Close | UB5 4QB |
| Reading Road | UB5 4PG UB5 4PH UB5 4PJ UB5 4PQ |
| Ross Close | UB5 4GZ |
| Russell Road | UB5 4QR UB5 4QS |
| Whitton Avenue West | UB5 4JU UB5 4JX UB5 4JY UB5 4JZ UB5 4LA UB5 4LB |
| Wood End Close | UB5 4QP |
| Wood End Gardens | UB5 4QH UB5 4QJ UB5 4QL UB5 4QN UB5 4QW |
| Wood End Lane | UB5 4JP UB5 4JR |
| Wood End Way | UB5 4QD UB5 4QQ UB5 4QG |
Transport near North Greenford
-
Northolt Park Station
-
South Harrow Station
-
Sudbury Hill Station
-
Sudbury Hill Harrow Station
-
Northolt Station
-
Greenford Station
-
Rayners Lane Station
-
West Harrow Station
-
Sudbury and Harrow Road Station
-
Sudbury Town Station
- FAQ
- Price Paid By Year
- Property Type Price
Frequently asked questions about North Greenford
What is the average price for a property for sale in North Greenford?
The average price for a property for sale in North Greenford is £421,682. This amount is 6% higher than the average price in Northolt. There are 2,033 property listings for sale in North Greenford.
What streets have the most expensive properties for sale in North Greenford?
The streets with the most expensive properties for sale in North Greenford are Ross Close at an average of £610,625, Wood End Way at an average of £574,500 and Clauson Avenue at an average of £532,083.
What streets have the most affordable properties for sale in North Greenford?
The streets with the most affordable properties for sale in North Greenford are Hollydale Close at an average of £239,000, Hari Close at an average of £261,111 and Reading Road at an average of £325,562.
Which train stations are available in or near North Greenford?
Some of the train stations available in or near North Greenford are Northolt Park, Sudbury Hill Harrow and Greenford.
Which tube stations are available in or near North Greenford?
Some of the tube stations available in or near North Greenford are South Harrow, Sudbury Hill and Northolt.
Property Price Paid in North Greenford by Year
The average sold property price by year was:
| Year | Average Sold Price | Price Change |
Sold Properties
|
|---|---|---|---|
| 2025 | £428,805 | -3% |
17 Properties |
| 2024 | £439,938 | 8% |
39 Properties |
| 2023 | £406,148 | -2% |
27 Properties |
| 2022 | £412,488 | 2% |
45 Properties |
| 2021 | £405,178 | 5% |
39 Properties |
| 2020 | £383,493 | -5% |
15 Properties |
| 2019 | £401,562 | -0,3% |
31 Properties |
| 2018 | £402,583 | 10% |
41 Properties |
| 2017 | £362,381 | 5% |
33 Properties |
| 2016 | £343,939 | 10% |
42 Properties |
| 2015 | £309,697 | 13% |
35 Properties |
| 2014 | £269,470 | 3% |
41 Properties |
| 2013 | £261,513 | 2% |
30 Properties |
| 2012 | £255,574 | 9% |
27 Properties |
| 2011 | £231,628 | -6% |
35 Properties |
| 2010 | £245,308 | 7% |
37 Properties |
| 2009 | £228,382 | 1% |
31 Properties |
| 2008 | £226,947 | -8% |
42 Properties |
| 2007 | £244,783 | 14% |
81 Properties |
| 2006 | £209,395 | 2% |
66 Properties |
| 2005 | £204,676 | 2% |
61 Properties |
| 2004 | £200,404 | -4% |
65 Properties |
| 2003 | £209,140 | 28% |
70 Properties |
| 2002 | £150,164 | 18% |
90 Properties |
| 2001 | £123,018 | 8% |
92 Properties |
| 2000 | £113,712 | 13% |
69 Properties |
| 1999 | £98,629 | 15% |
72 Properties |
| 1998 | £84,063 | 9% |
71 Properties |
| 1997 | £76,914 | 18% |
50 Properties |
| 1996 | £63,020 | 3% |
35 Properties |
| 1995 | £61,019 | - |
46 Properties |
Property Price per Property Type in North Greenford
Here you can find historic sold price data in order to help with your property search.
The average Property Paid Price for specific property types in the last three years are:
| Property Type | Average Sold Price | Sold Properties |
|---|---|---|
| Semi Detached House | £536,399.00 | 53 Semi Detached Houses |
| Detached House | £574,000.00 | 2 Detached Houses |
| Terraced House | £444,365.00 | 26 Terraced Houses |
| Flat | £273,289.00 | 47 Flats |

