
Houses for sale & to rent in Roxbourne, Harrow
House Prices in Roxbourne
Properties in this part of Roxbourne within Harrow have an average house price of £409k and had 274 Property Transactions within the last 3 years¹. This area has 4,491 households² , where the most expensive property was sold for £960k.
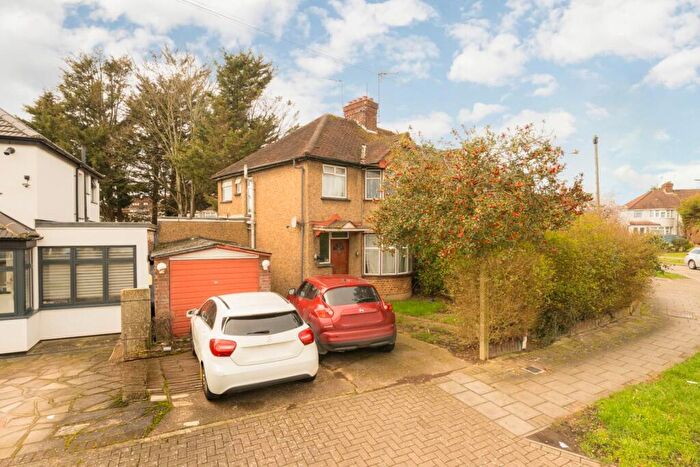
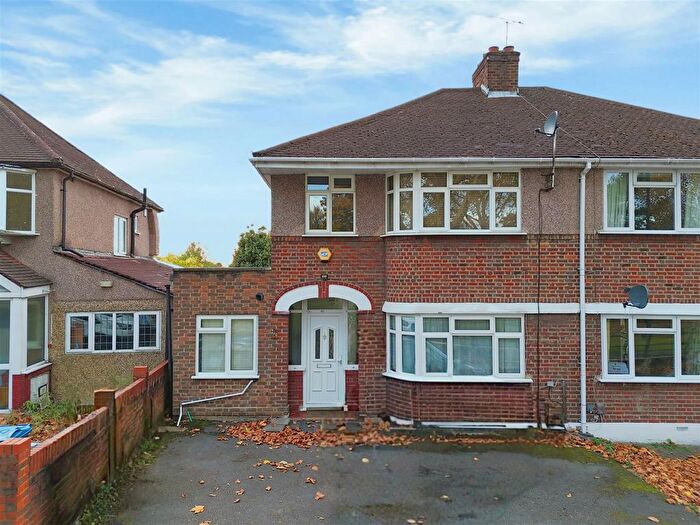
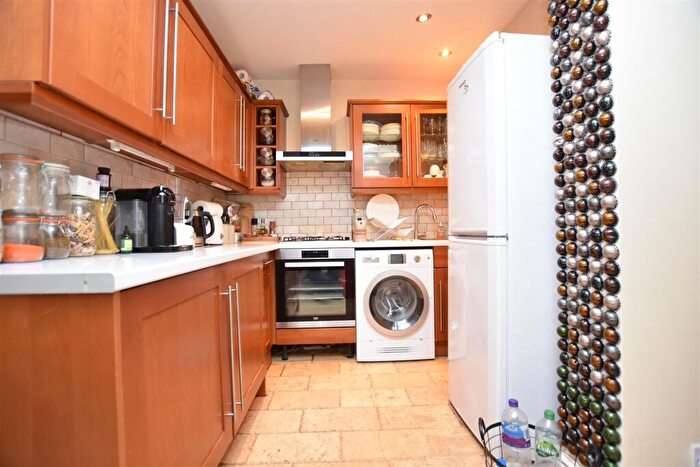
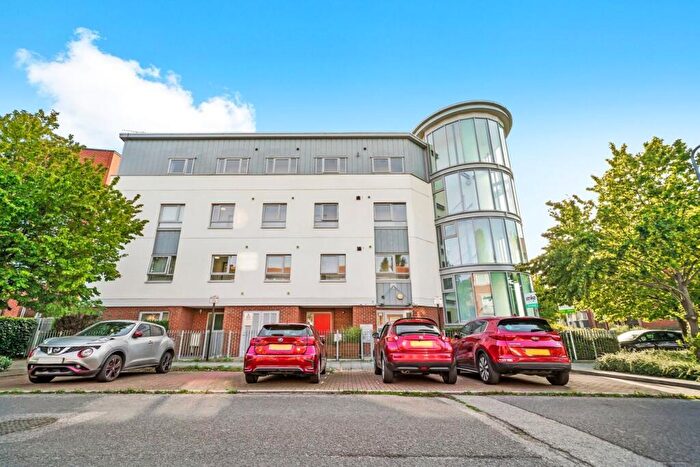
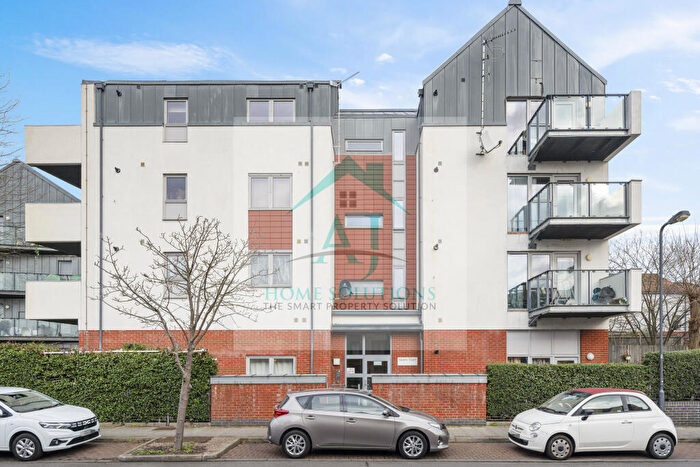
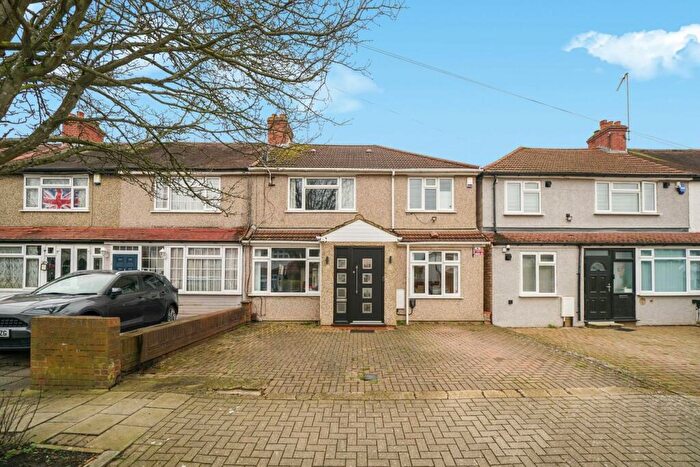
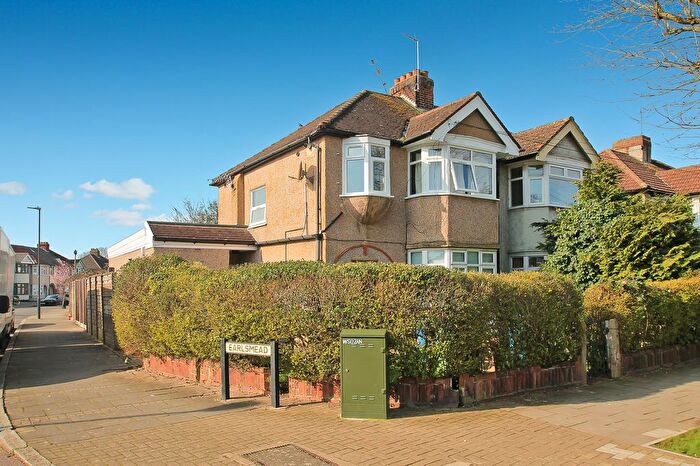
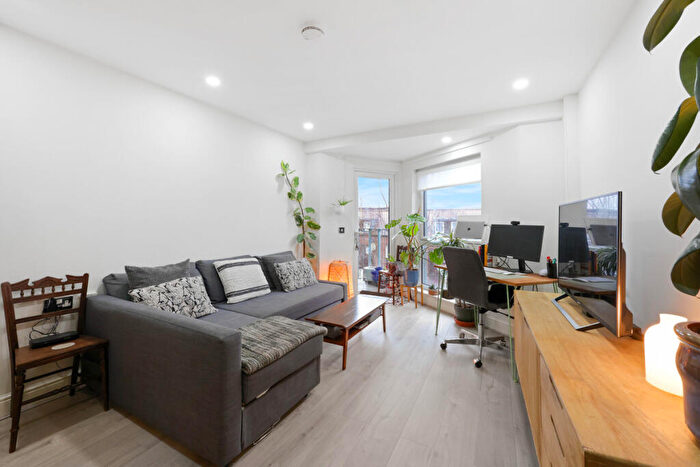
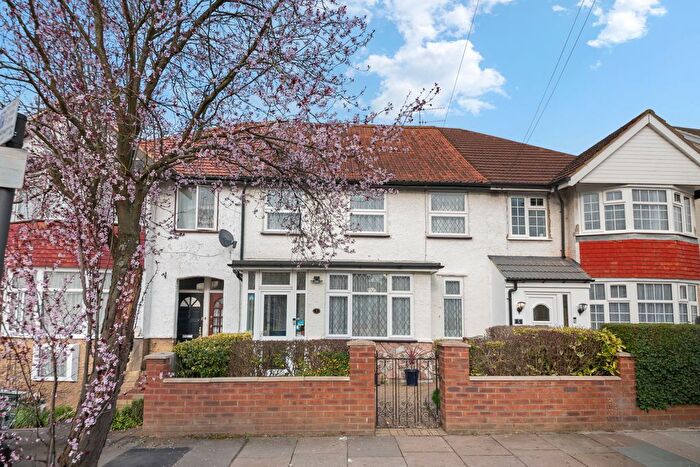
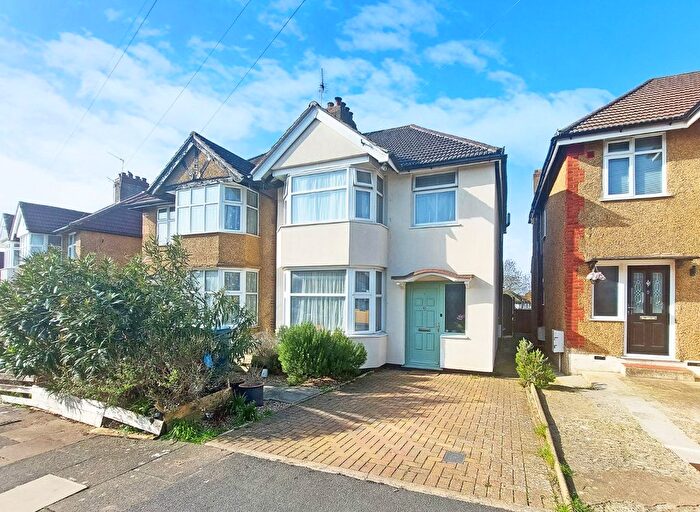
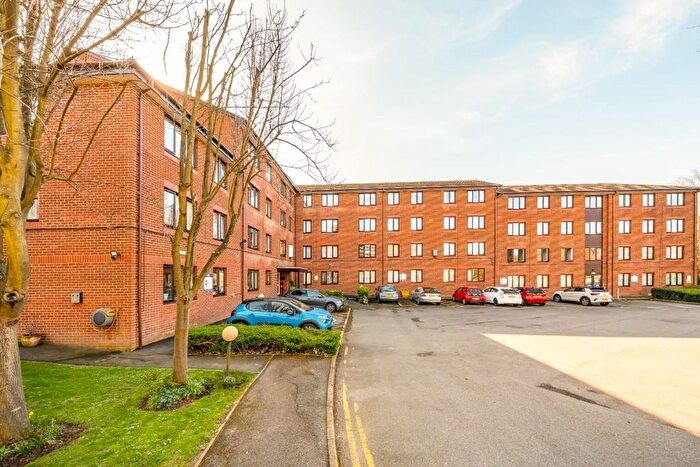
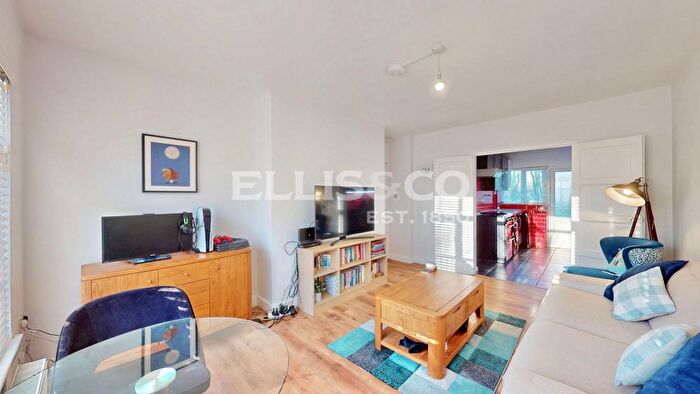
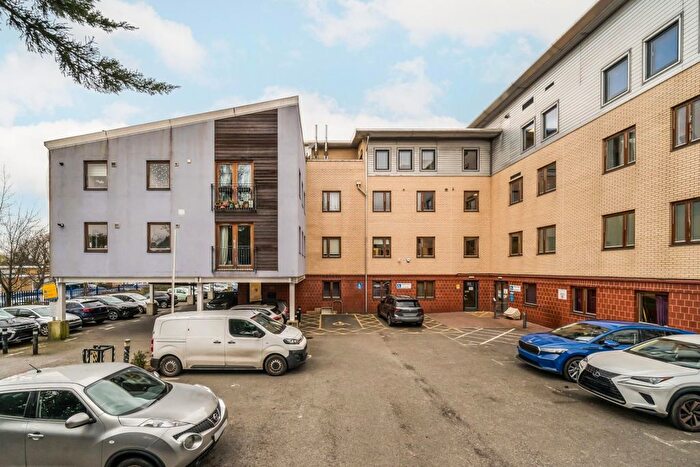
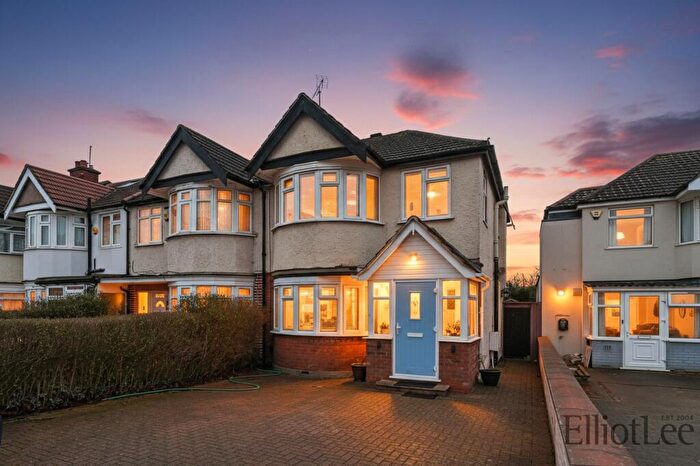
Properties for sale in Roxbourne


![]()
If you are looking to sell your house, let it out, or receive a property valuation, an expert can help you.
Click the button below to get started.


Roads and Postcodes in Roxbourne
Navigate through our locations to find the location of your next house in Roxbourne, Harrow for sale or to rent.
Transport near Roxbourne
-
 South Harrow Station
 -
 Northolt Park Station
 -
Rayners Lane Station
-
West Harrow Station
-
North Harrow Station
-
Northolt Station
-
Sudbury Hill Harrow Station
-
Sudbury Hill Station
-
Harrow-On-The-Hill Station
-
Eastcote Station
- FAQ
- Price Paid By Year
- Property Type Price
Frequently asked questions about Roxbourne
What is the average price for a property for sale in Roxbourne?
The average price for a property for sale in Roxbourne is £408,640. This amount is 17% lower than the average price in Harrow. There are 2,491 property listings for sale in Roxbourne.
What streets have the most expensive properties for sale in Roxbourne?
The streets with the most expensive properties for sale in Roxbourne are Tithe Farm Close at an average of £650,000, Malvern Avenue at an average of £637,884 and Lulworth Gardens at an average of £628,750.
What streets have the most affordable properties for sale in Roxbourne?
The streets with the most affordable properties for sale in Roxbourne are Sherwood Road at an average of £236,924, Barnaby Close at an average of £250,620 and Ivy Close at an average of £274,500.
Which train stations are available in or near Roxbourne?
Some of the train stations available in or near Roxbourne are Northolt Park, Sudbury Hill Harrow and Harrow-On-The-Hill.
Which tube stations are available in or near Roxbourne?
Some of the tube stations available in or near Roxbourne are South Harrow, Rayners Lane and West Harrow.
Property Price Paid in Roxbourne by Year
The average sold property price by year was:
| Year | Average Sold Price | Price Change |
Sold Properties
|
|---|---|---|---|
| 2025 | £413,671 | 4% |
78 Properties |
| 2024 | £398,437 | -5% |
111 Properties |
| 2023 | £417,347 | 1% |
85 Properties |
| 2022 | £413,274 | 5% |
113 Properties |
| 2021 | £392,803 | 2% |
150 Properties |
| 2020 | £383,583 | 1% |
165 Properties |
| 2019 | £378,589 | 3% |
201 Properties |
| 2018 | £367,771 | -2% |
154 Properties |
| 2017 | £375,879 | 1% |
126 Properties |
| 2016 | £372,558 | 16% |
153 Properties |
| 2015 | £313,104 | 5% |
213 Properties |
| 2014 | £296,422 | 19% |
165 Properties |
| 2013 | £238,923 | 1% |
139 Properties |
| 2012 | £236,558 | 3% |
144 Properties |
| 2011 | £228,554 | 1% |
123 Properties |
| 2010 | £225,352 | 14% |
122 Properties |
| 2009 | £193,228 | -9% |
207 Properties |
| 2008 | £211,482 | -13% |
195 Properties |
| 2007 | £239,706 | 10% |
196 Properties |
| 2006 | £215,940 | -2% |
172 Properties |
| 2005 | £220,240 | 8% |
146 Properties |
| 2004 | £201,959 | 6% |
179 Properties |
| 2003 | £189,282 | 6% |
223 Properties |
| 2002 | £177,366 | 22% |
188 Properties |
| 2001 | £138,773 | 10% |
200 Properties |
| 2000 | £125,551 | 15% |
191 Properties |
| 1999 | £106,659 | 18% |
232 Properties |
| 1998 | £87,590 | 13% |
202 Properties |
| 1997 | £75,953 | 9% |
223 Properties |
| 1996 | £68,831 | 4% |
151 Properties |
| 1995 | £66,051 | - |
129 Properties |
Property Price per Property Type in Roxbourne
Here you can find historic sold price data in order to help with your property search.
The average Property Paid Price for specific property types in the last three years are:
| Property Type | Average Sold Price | Sold Properties |
|---|---|---|
| Flat | £286,624.00 | 129 Flats |
| Semi Detached House | £573,988.00 | 42 Semi Detached Houses |
| Terraced House | £491,277.00 | 102 Terraced Houses |
| Detached House | £775,000.00 | 1 Detached House |