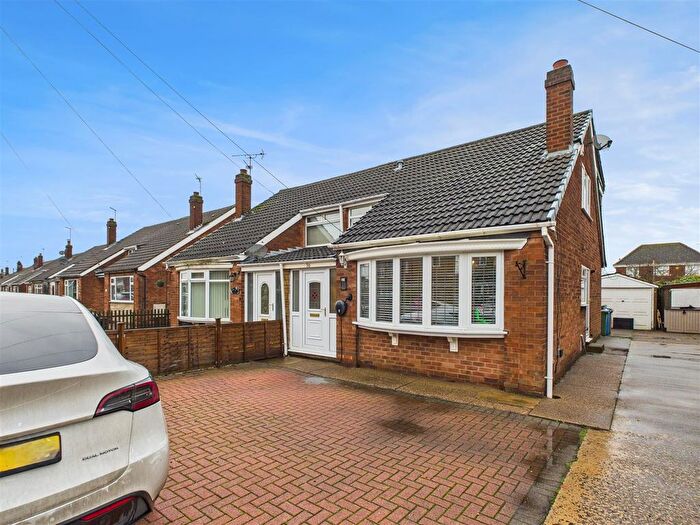
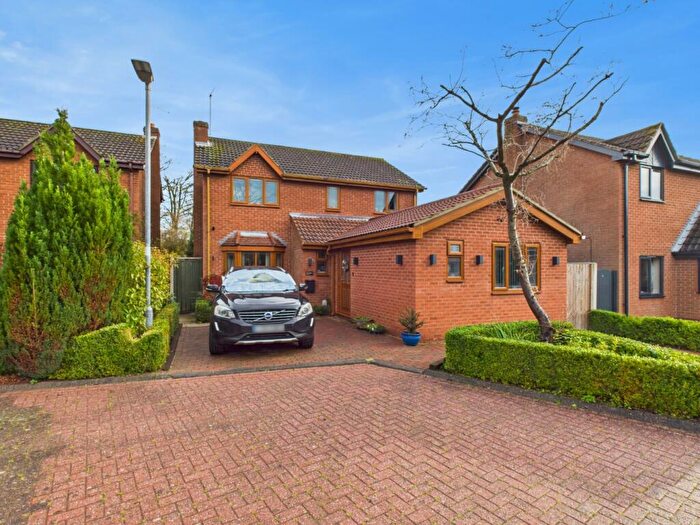
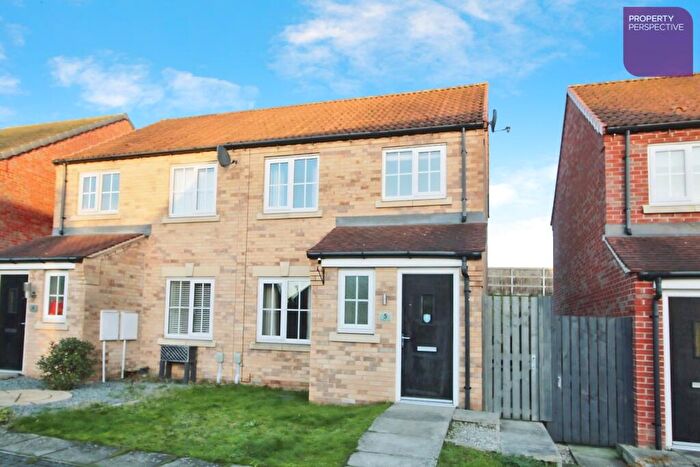
Houses for sale & to rent in South Hunsley, Brough
House Prices in South Hunsley
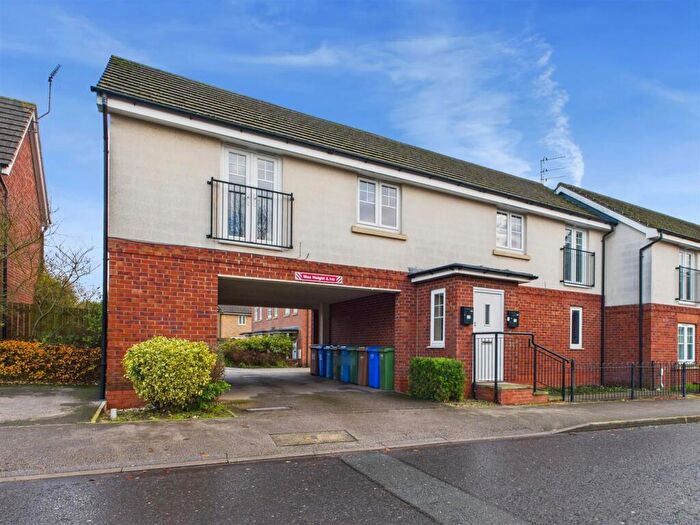
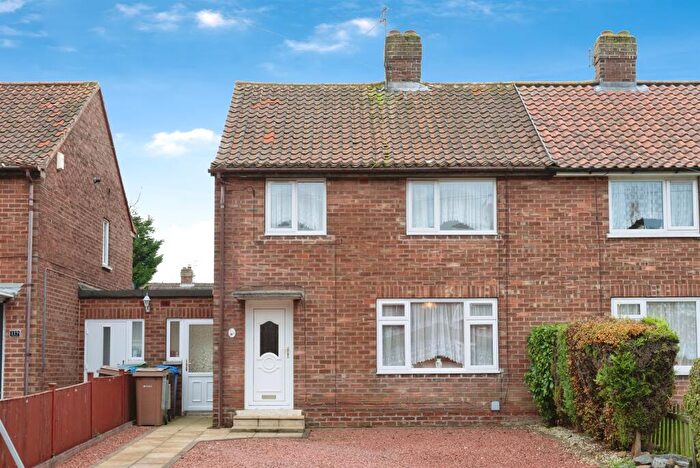
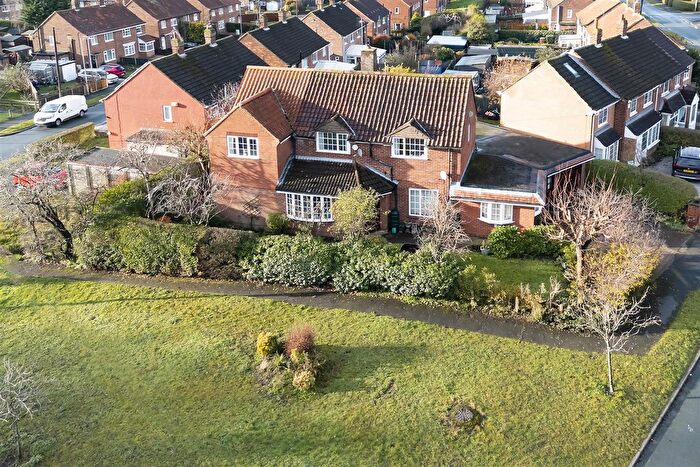
Properties in South Hunsley have an average house price of £296,941.00 and had 169 Property Transactions within the last 3 years¹.
South Hunsley is an area in Brough, East Riding of Yorkshire with 687 households², where the most expensive property was sold for £1,075,000.00.
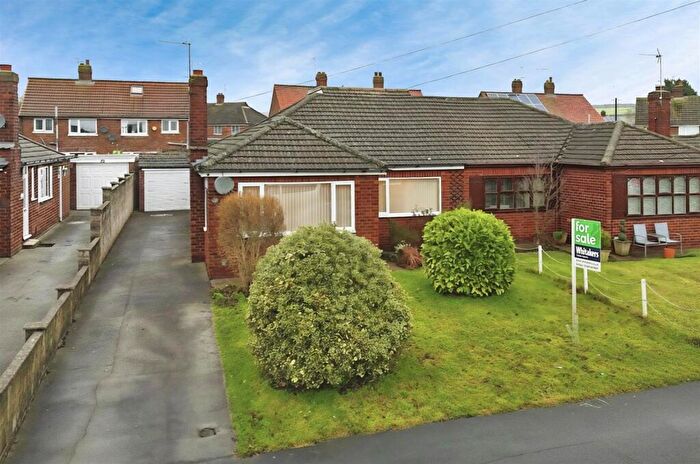
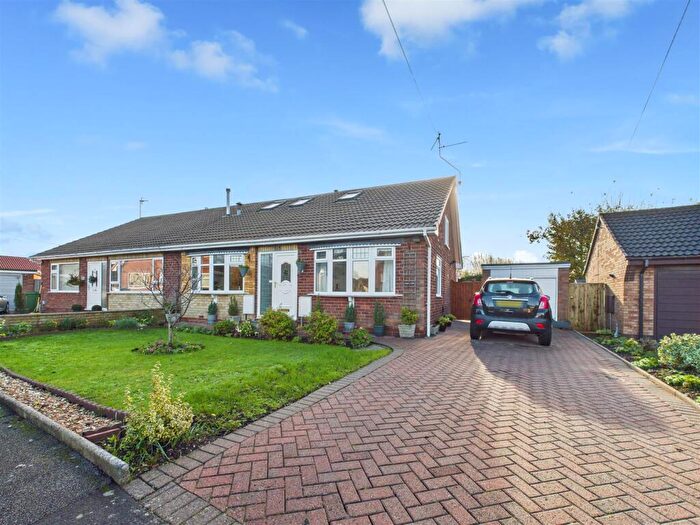
Properties for sale in South Hunsley
Roads and Postcodes in South Hunsley
Navigate through our locations to find the location of your next house in South Hunsley, Brough for sale or to rent.
| Streets | Postcodes |
|---|---|
| Allerthorpe Crescent | HU15 1TP |
| Bartrams | HU15 1LX |
| Beck Lane | HU15 1PW |
| Beckside | HU15 1PF |
| Bell Close | HU15 1YF |
| Beverley Road | HU15 1QR |
| Brookside | HU15 1PB |
| Chapel Hill | HU15 1PD |
| Church Street | HU15 1NH |
| Common Lane | HU15 1PT HU15 1PJ HU15 1ZR HU15 1XL |
| Cowgate | HU15 1NB HU15 1ND HU15 1NF |
| Creyke Lane | HU15 1NQ |
| Dale Road | HU15 1PE |
| Danegeld Garth | HU15 1AX |
| Elloughtonthorpe Way | HU15 1TJ |
| Etherington Field | HU15 1UL |
| Everthorpe Close | HU15 1TL |
| Fairfield View | HU15 1PZ |
| Galland Road | HU15 1XU |
| Hall Walk | HU15 1PN |
| Harrison Place | HU15 1YT |
| Hidcote Walk | HU15 1FP |
| Holly Hill | HU15 1NY |
| Husthwaite Road | HU15 1TF |
| Ingmires | HU15 1PL |
| Kettlethorpe Drive | HU15 1TN |
| Kidd Lane | HU15 1PH |
| Kingscroft Drive | HU15 1FH HU15 1FL |
| Ladywell Court | HU15 1LY |
| Ladywell Gate | HU15 1NL |
| Liberty Park | HU15 1FS |
| Ling Croft | HU15 1TU |
| Munstead Way | HU15 1FN |
| Park Road | HU15 1NN HU15 1NW |
| Parliament Street | HU15 1PA |
| Poolbank Lane | HU15 1PX |
| Popple Walk | HU15 1YB |
| Raikes Court | HU15 1PG |
| Railer Chase | HU15 1YE |
| Shaw Avenue | HU15 1YA |
| Springfield Close | HU15 1NE |
| St Annes Walk | HU15 1NP |
| St Helens Drive | HU15 1NR |
| Temple Close | HU15 1NX |
| Temple Lane | HU15 1FX |
| Temple Walk | HU15 1NZ |
| The Crescent | HU15 1NS |
| The Green | HU15 1NG |
| The Terrace | HU15 1NJ |
| Welton Old Road | HU15 1NT HU15 1NU |
| Welton Wold | HU15 1PY |
| Williamson Rise | HU15 1YD |
| Wilson Place | HU15 1XY |
| HU15 1PU HU15 1UP |
Transport near South Hunsley
- FAQ
- Price Paid By Year
- Property Type Price
Frequently asked questions about South Hunsley
What is the average price for a property for sale in South Hunsley?
The average price for a property for sale in South Hunsley is £296,941. This amount is 12% higher than the average price in Brough. There are 1,127 property listings for sale in South Hunsley.
What streets have the most expensive properties for sale in South Hunsley?
The streets with the most expensive properties for sale in South Hunsley are Beverley Road at an average of £1,075,000, Hall Walk at an average of £703,750 and Ling Croft at an average of £479,250.
What streets have the most affordable properties for sale in South Hunsley?
The streets with the most affordable properties for sale in South Hunsley are Parliament Street at an average of £95,000, Liberty Park at an average of £138,045 and Hidcote Walk at an average of £140,022.
Which train stations are available in or near South Hunsley?
Some of the train stations available in or near South Hunsley are Brough, Ferriby and Hessle.
Property Price Paid in South Hunsley by Year
The average sold property price by year was:
| Year | Average Sold Price | Price Change |
Sold Properties
|
|---|---|---|---|
| 2025 | £356,432 | 19% |
22 Properties |
| 2024 | £288,932 | -2% |
45 Properties |
| 2023 | £295,087 | 6% |
58 Properties |
| 2022 | £277,831 | 6% |
44 Properties |
| 2021 | £260,435 | 1% |
67 Properties |
| 2020 | £258,424 | 2% |
47 Properties |
| 2019 | £253,187 | 0,4% |
90 Properties |
| 2018 | £252,076 | 7% |
92 Properties |
| 2017 | £234,780 | 5% |
44 Properties |
| 2016 | £223,530 | -5% |
61 Properties |
| 2015 | £234,400 | -28% |
46 Properties |
| 2014 | £299,766 | 29% |
45 Properties |
| 2013 | £211,885 | 22% |
31 Properties |
| 2012 | £165,668 | 1% |
62 Properties |
| 2011 | £164,349 | -29% |
101 Properties |
| 2010 | £211,492 | 2% |
78 Properties |
| 2009 | £207,535 | -25% |
40 Properties |
| 2008 | £259,466 | -2% |
40 Properties |
| 2007 | £264,062 | -1% |
37 Properties |
| 2006 | £266,969 | -4% |
39 Properties |
| 2005 | £278,708 | 24% |
34 Properties |
| 2004 | £210,725 | 8% |
62 Properties |
| 2003 | £194,880 | 24% |
58 Properties |
| 2002 | £147,778 | 23% |
42 Properties |
| 2001 | £114,206 | 29% |
25 Properties |
| 2000 | £80,819 | 19% |
25 Properties |
| 1999 | £65,556 | -57% |
20 Properties |
| 1998 | £102,902 | 16% |
36 Properties |
| 1997 | £86,788 | 18% |
24 Properties |
| 1996 | £71,183 | -0,3% |
15 Properties |
| 1995 | £71,397 | - |
19 Properties |
Property Price per Property Type in South Hunsley
Here you can find historic sold price data in order to help with your property search.
The average Property Paid Price for specific property types in the last three years are:
| Property Type | Average Sold Price | Sold Properties |
|---|---|---|
| Semi Detached House | £225,440.00 | 58 Semi Detached Houses |
| Detached House | £418,315.00 | 70 Detached Houses |
| Terraced House | £213,016.00 | 33 Terraced Houses |
| Flat | £99,500.00 | 8 Flats |

