
Houses for sale & to rent in East Riding of Yorkshire, England
House Prices in East Riding of Yorkshire
Properties in East Riding of Yorkshire have
an average house price of
£241k
and had 17,102 Property Transactions
within the last 3 years.¹
East Riding of Yorkshire is a location in
England with
144,383 households², where the most expensive property was sold for £5.7M.
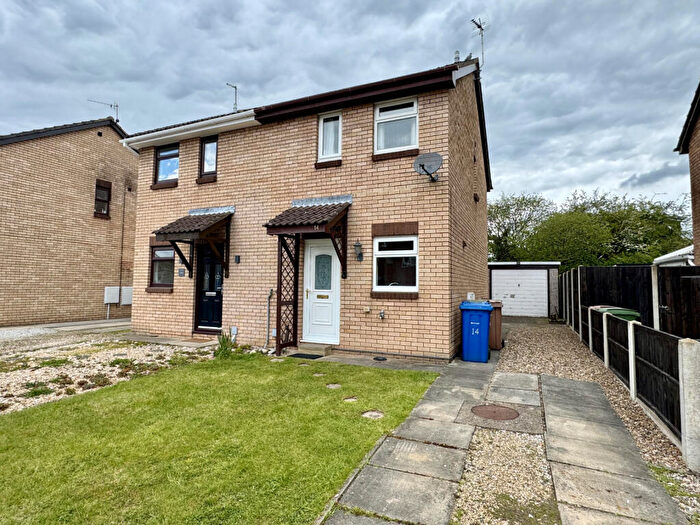
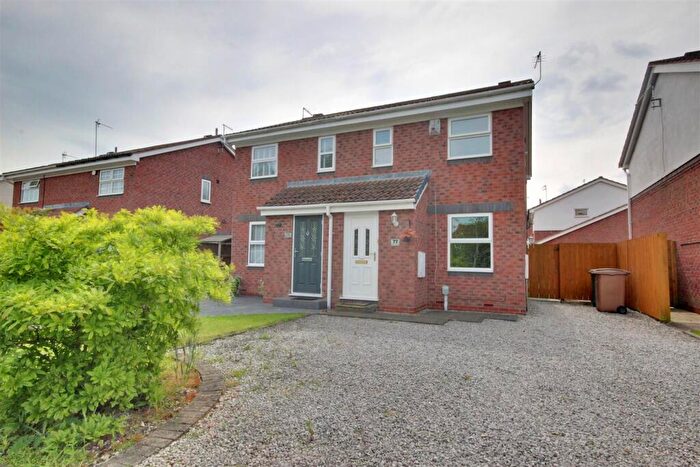
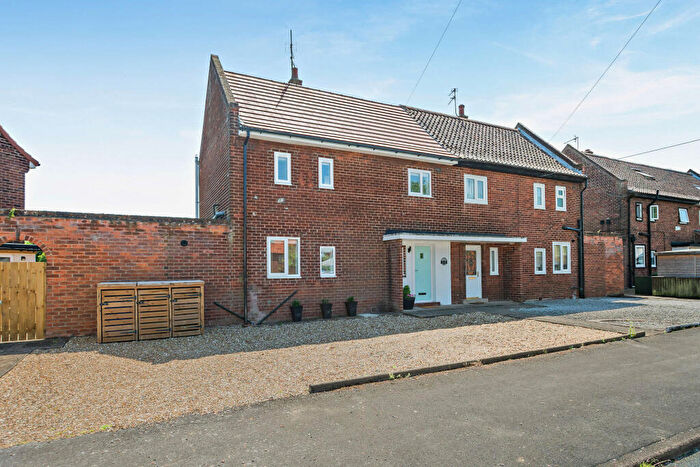
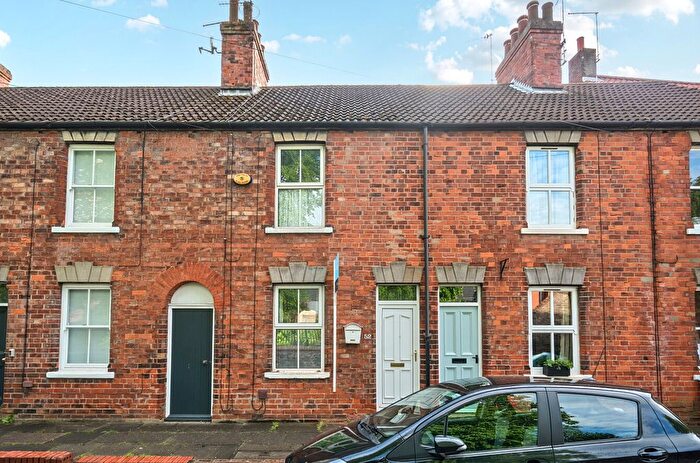
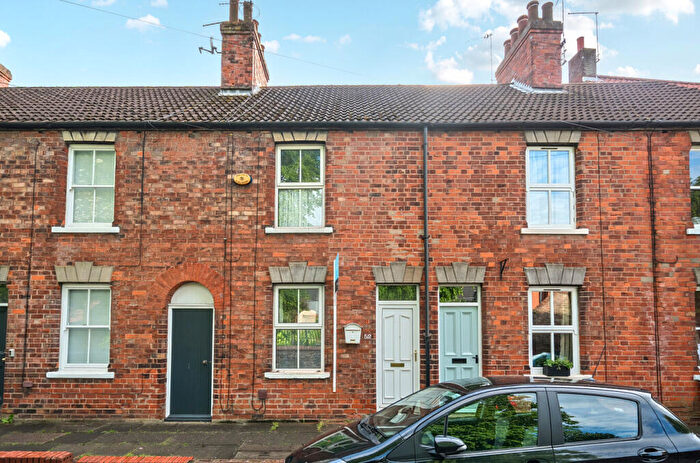
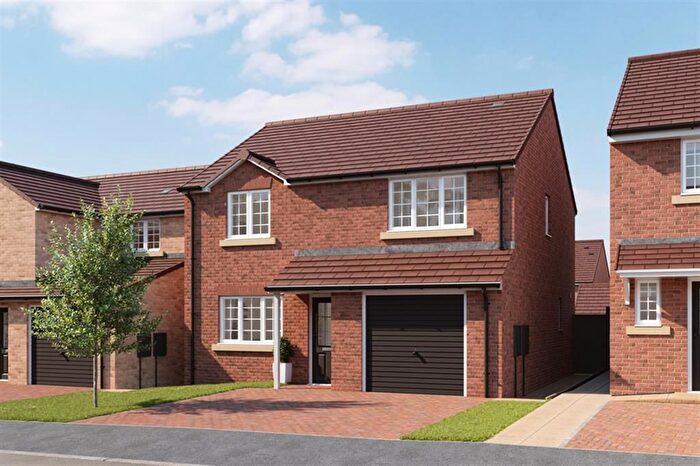
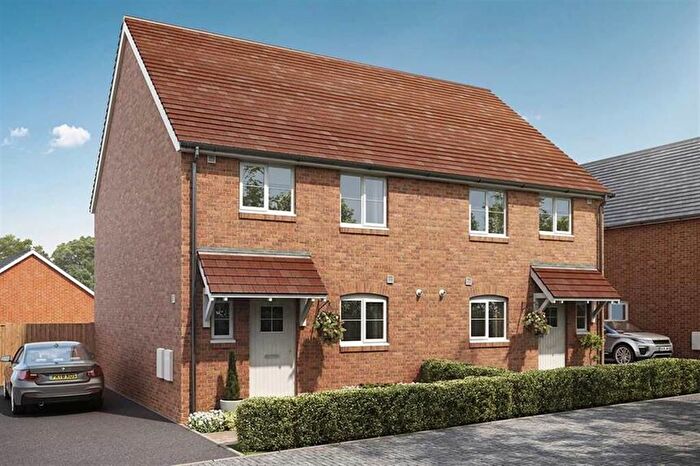
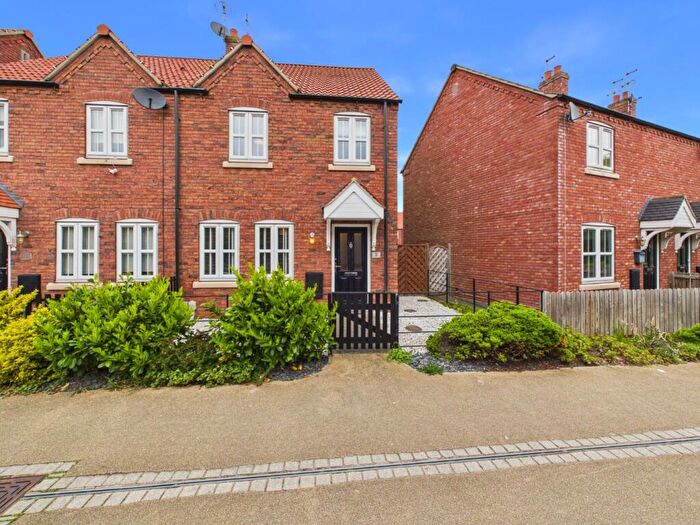
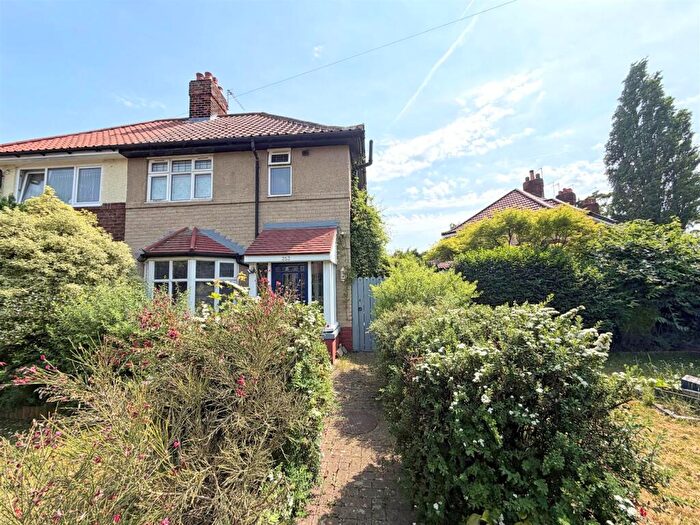
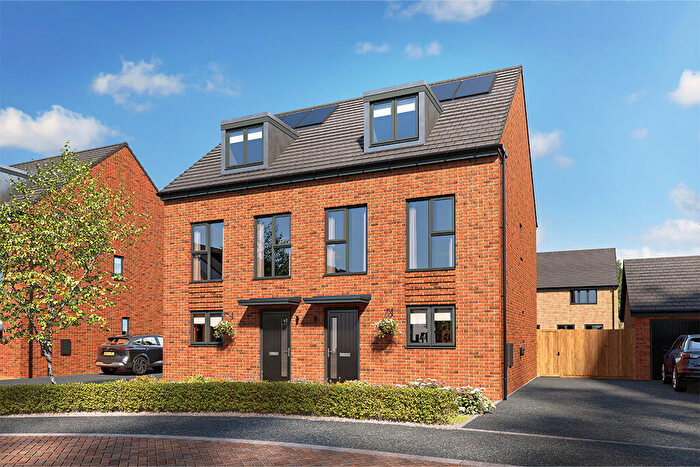
Properties for sale in East Riding of Yorkshire
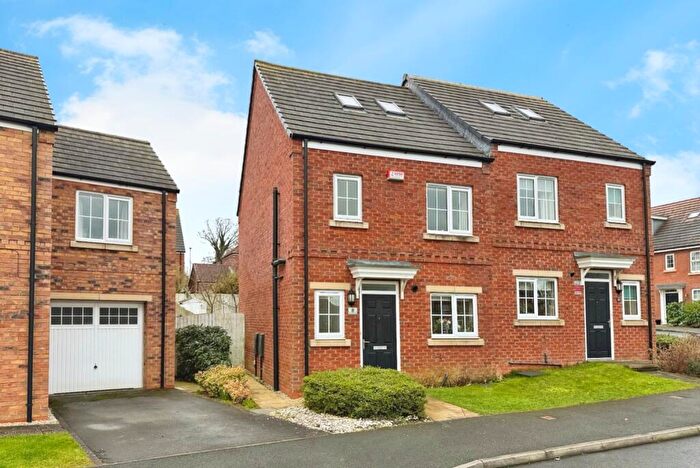
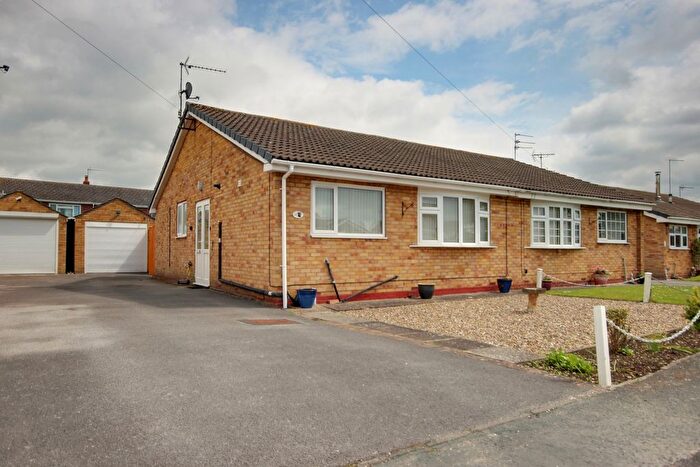
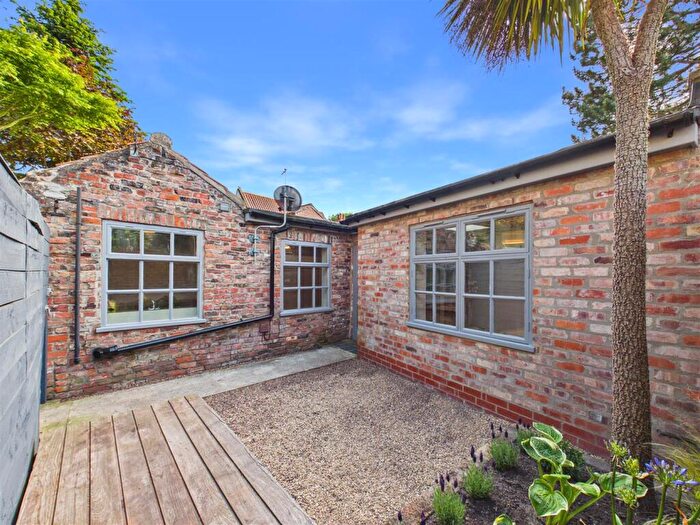
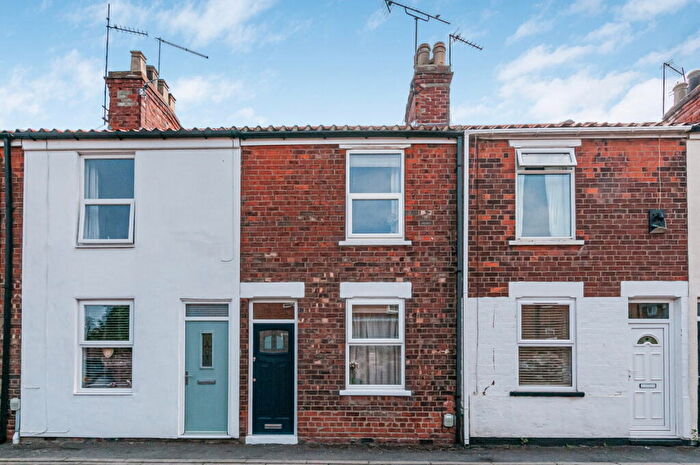
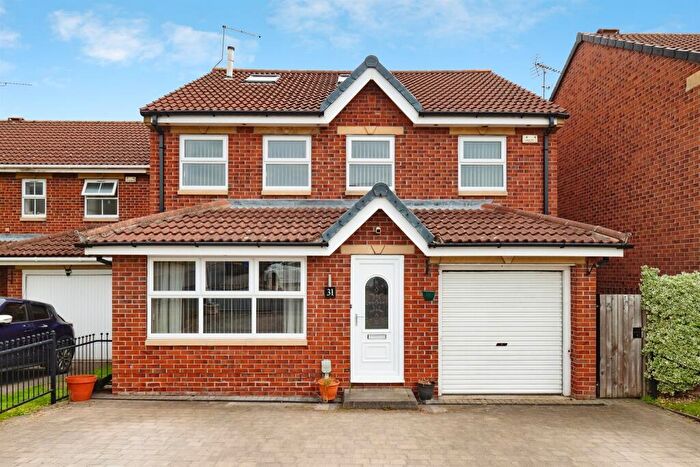
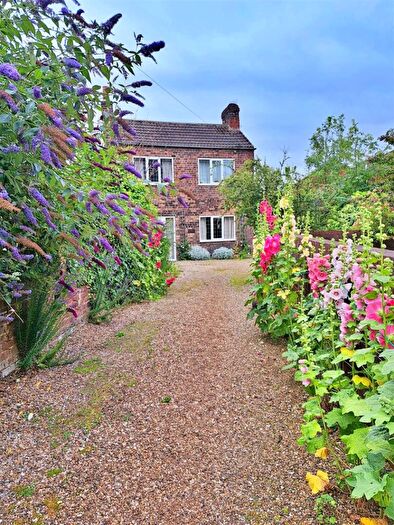
![]()
If you are looking to sell your house, let it out, or receive a property valuation, an expert can help you.
Click the button below to get started.
Towns in East Riding of Yorkshire
Navigate through our locations to find the location of your next house in East Riding of Yorkshire, England for sale or to rent.
Transport in East Riding of Yorkshire
Please see below transportation links in this area:
-
 Beverley Station
 -
Arram Station
-
Cottingham Station
-
Hutton Cranswick Station
-
Hull Station
-
Hessle Station
-
Ferriby Station
-
Brough Station
- FAQ
- Price Paid By Year
- Property Type Price
Frequently asked questions about East Riding of Yorkshire
What is the average price for a property for sale in East Riding of Yorkshire?
The average price for a property for sale in East Riding of Yorkshire is £240,821. This amount is 33% lower than the average price in England. There are more than 10,000 property listings for sale in East Riding of Yorkshire.
What locations have the most expensive properties for sale in East Riding of Yorkshire?
The locations with the most expensive properties for sale in East Riding of Yorkshire are North Ferriby at an average of £364,409, Selby at an average of £355,844 and York at an average of £298,757.
What locations have the most affordable properties for sale in East Riding of Yorkshire?
The locations with the most affordable properties for sale in East Riding of Yorkshire are Withernsea at an average of £148,658, Bridlington at an average of £187,935 and Goole at an average of £200,975.
Which train stations are available in or near East Riding of Yorkshire?
Some of the train stations available in or near East Riding of Yorkshire are Beverley, Arram and Cottingham.
Property Price Paid in East Riding of Yorkshire by Year
The average sold property price by year was:
| Year | Average Sold Price | Price Change |
Sold Properties
|
|---|---|---|---|
| 2026 | £241,341 | -2% |
760 Properties |
| 2025 | £246,995 | 5% |
5,609 Properties |
| 2024 | £235,819 | -2% |
5,560 Properties |
| 2023 | £239,426 | -0,5% |
5,173 Properties |
| 2022 | £240,600 | 3% |
6,537 Properties |
| 2021 | £233,834 | 4% |
8,008 Properties |
| 2020 | £224,343 | 7% |
6,197 Properties |
| 2019 | £208,698 | 3% |
7,184 Properties |
| 2018 | £202,781 | 2% |
7,308 Properties |
| 2017 | £198,343 | 6% |
7,331 Properties |
| 2016 | £186,051 | 5% |
6,933 Properties |
| 2015 | £177,635 | 3% |
6,599 Properties |
| 2014 | £172,268 | 5% |
6,418 Properties |
| 2013 | £163,259 | 1% |
5,302 Properties |
| 2012 | £161,931 | -1% |
4,388 Properties |
| 2011 | £163,777 | -3% |
4,476 Properties |
| 2010 | £169,109 | 5% |
4,387 Properties |
| 2009 | £160,753 | -9% |
4,059 Properties |
| 2008 | £174,934 | 0,2% |
4,308 Properties |
| 2007 | £174,500 | 6% |
8,398 Properties |
| 2006 | £164,775 | 6% |
9,047 Properties |
| 2005 | £155,002 | 6% |
7,152 Properties |
| 2004 | £145,292 | 19% |
8,337 Properties |
| 2003 | £117,816 | 19% |
8,951 Properties |
| 2002 | £95,551 | 19% |
9,352 Properties |
| 2001 | £77,428 | 9% |
9,082 Properties |
| 2000 | £70,467 | 6% |
8,124 Properties |
| 1999 | £66,331 | 5% |
7,297 Properties |
| 1998 | £62,955 | 2% |
6,721 Properties |
| 1997 | £61,906 | 3% |
6,858 Properties |
| 1996 | £60,157 | 1% |
6,534 Properties |
| 1995 | £59,783 | - |
5,693 Properties |
Property Price per Property Type in East Riding of Yorkshire
Here you can find historic sold price data in order to help with your property search.
The average Property Paid Price for specific property types in the last three years are:
| Property Type | Average Sold Price | Sold Properties |
|---|---|---|
| Semi Detached House | £211,644.00 | 6,282 Semi Detached Houses |
| Terraced House | £165,228.00 | 4,163 Terraced Houses |
| Detached House | £356,030.00 | 5,523 Detached Houses |
| Flat | £118,844.00 | 1,134 Flats |