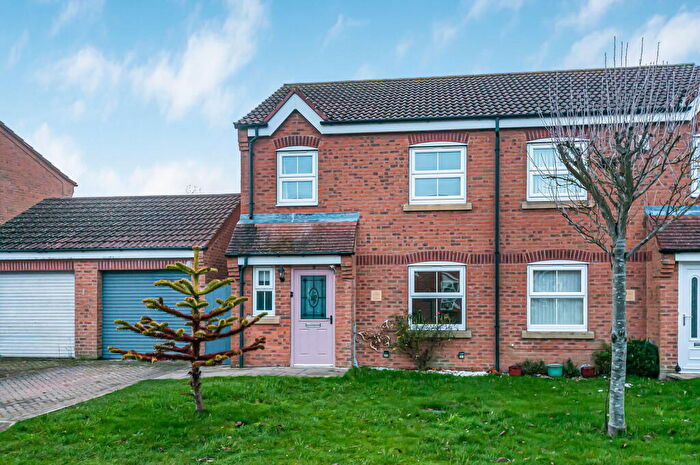
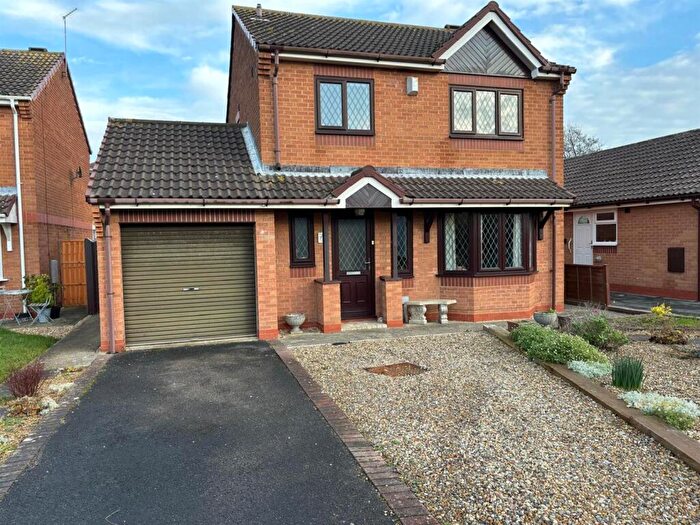
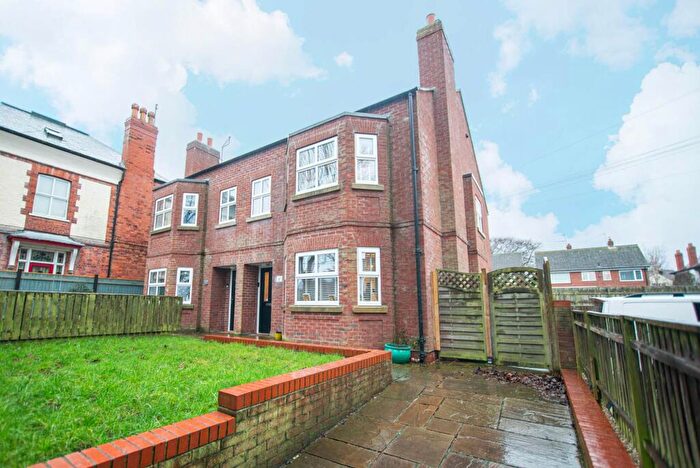
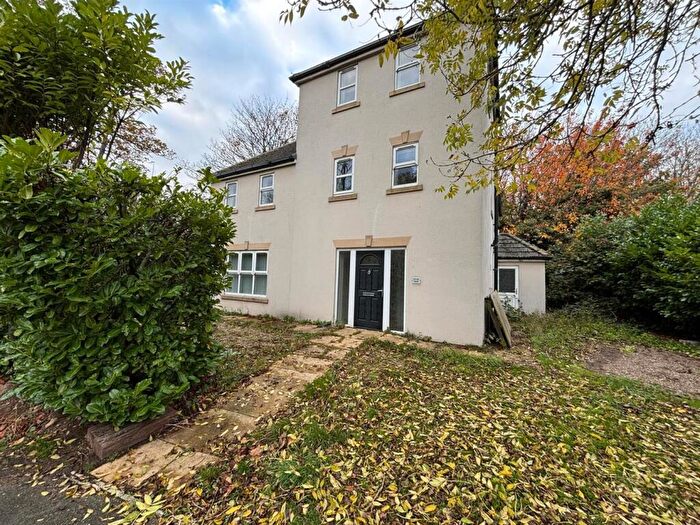
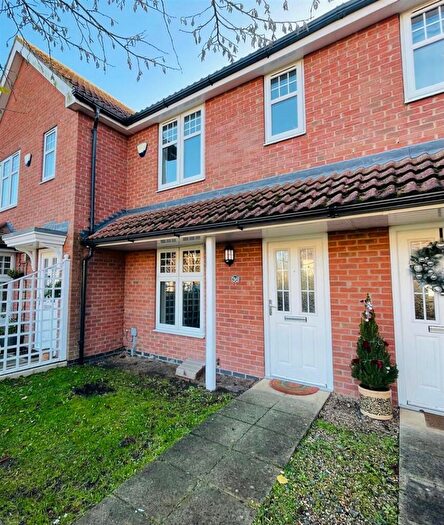
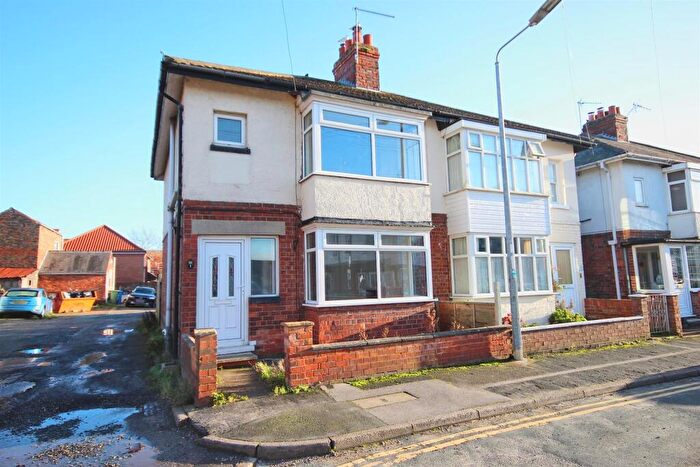
Houses for sale & to rent in North Holderness, Hull
House Prices in North Holderness
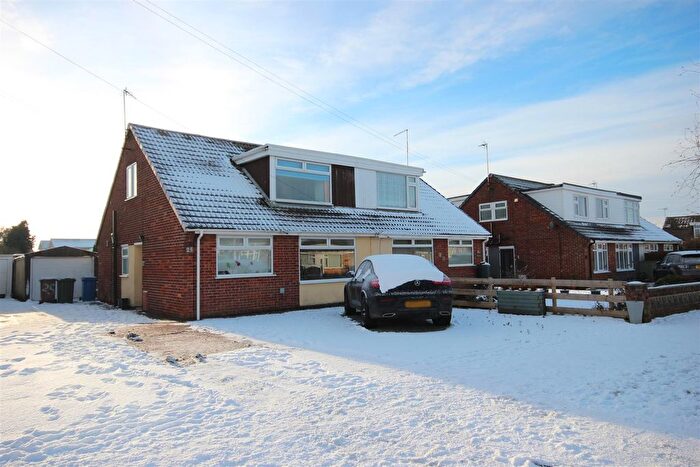
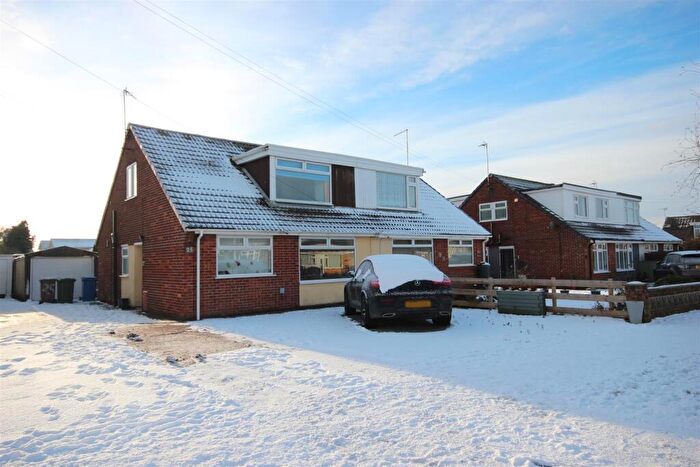
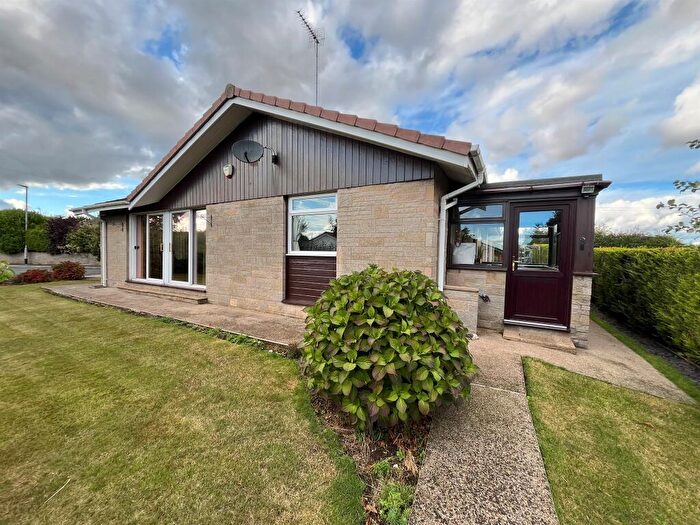
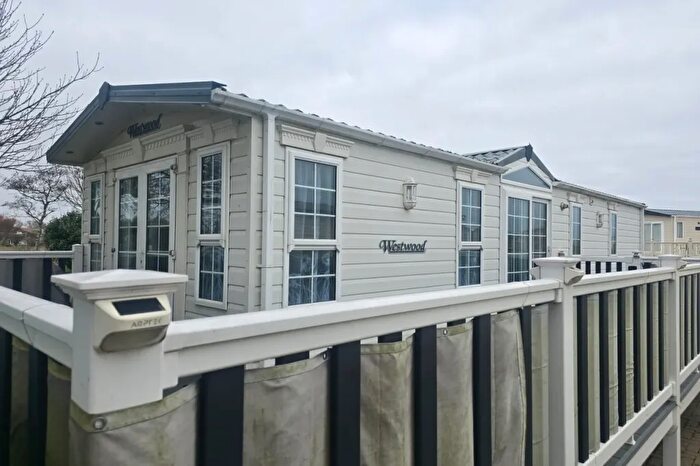
Properties in North Holderness have an average house price of £212,559.00 and had 38 Property Transactions within the last 3 years¹.
North Holderness is an area in Hull, East Riding of Yorkshire with 456 households², where the most expensive property was sold for £397,500.00.
Properties for sale in North Holderness
Roads and Postcodes in North Holderness
Navigate through our locations to find the location of your next house in North Holderness, Hull for sale or to rent.
| Streets | Postcodes |
|---|---|
| Aerodrome | HU11 5SU |
| Ash Grove | HU11 5QE |
| Back Lane | HU11 5SG |
| Bentinck Lane | HU11 5QR |
| Bewholme Lane | HU11 5SF HU11 5SZ HU11 5SY |
| Breamer Lane | HU11 5SQ HU11 5TA |
| Butcher Row | HU11 5RB |
| Catfoss Lane | HU11 5QN HU11 5SN |
| Church Lane | HU11 5QG |
| Common Lane | HU11 5SL |
| East Lane | HU11 5QQ |
| East View Cottages | HU11 5SH |
| Eelmere Lane | HU11 4UL |
| Garthend Lane | HU11 4UN |
| Great Hatfield Road | HU11 5QJ |
| Hill Top Cottages | HU11 5RD |
| Hornsea Road | HU11 5QL HU11 5RQ |
| Hull Road | HU11 5RN |
| Lawrence Avenue | HU11 5SS |
| Leas Bungalows | HU11 5RG |
| Leas Lane | HU11 5RE |
| Little Lane | HU11 4UQ |
| Main Road | HU11 4UJ HU11 4UD HU11 4UG |
| Main Street | HU11 5QA HU11 5RA HU11 5DN |
| Manor Park | HU11 5RF |
| Mappleton Road | HU11 4UW |
| Middle Lane | HU11 5SE |
| Mill Lane | HU11 5SW |
| Old Lane | HU11 5QF |
| Remington Avenue | HU11 5SR |
| Rise Road | HU11 5QH |
| Southorpe Road | HU11 5RL HU11 5RP |
| Spring Field Close | HU11 5QP |
| St Lawrence Square | HU11 5QB |
| The Common | HU11 5SJ |
| The Crescent | HU11 5QD |
| Withernwick Road | HU11 4UH |
| Wittys Paddock | HU11 5ST |
| HU11 5RH HU11 5RJ HU11 5SP HU11 5SX |
Transport near North Holderness
- FAQ
- Price Paid By Year
- Property Type Price
Frequently asked questions about North Holderness
What is the average price for a property for sale in North Holderness?
The average price for a property for sale in North Holderness is £212,559. This amount is 6% lower than the average price in Hull. There are 2,023 property listings for sale in North Holderness.
What streets have the most expensive properties for sale in North Holderness?
The streets with the most expensive properties for sale in North Holderness are East Lane at an average of £386,250, Remington Avenue at an average of £385,000 and Bentinck Lane at an average of £316,875.
What streets have the most affordable properties for sale in North Holderness?
The streets with the most affordable properties for sale in North Holderness are Back Lane at an average of £122,379, Eelmere Lane at an average of £140,000 and Butcher Row at an average of £155,000.
Which train stations are available in or near North Holderness?
Some of the train stations available in or near North Holderness are Arram, Beverley and Hutton Cranswick.
Property Price Paid in North Holderness by Year
The average sold property price by year was:
| Year | Average Sold Price | Price Change |
Sold Properties
|
|---|---|---|---|
| 2025 | £239,785 | 22% |
7 Properties |
| 2024 | £188,084 | -32% |
8 Properties |
| 2023 | £248,681 | 28% |
11 Properties |
| 2022 | £179,883 | -25% |
12 Properties |
| 2021 | £223,994 | 24% |
19 Properties |
| 2020 | £170,523 | -23% |
19 Properties |
| 2019 | £209,786 | 1% |
19 Properties |
| 2018 | £207,047 | 21% |
20 Properties |
| 2017 | £162,715 | -18% |
21 Properties |
| 2016 | £192,126 | 14% |
19 Properties |
| 2015 | £164,650 | 3% |
19 Properties |
| 2014 | £159,916 | 9% |
18 Properties |
| 2013 | £145,148 | -14% |
15 Properties |
| 2012 | £164,950 | -70% |
5 Properties |
| 2011 | £280,723 | 41% |
10 Properties |
| 2010 | £165,637 | 1% |
16 Properties |
| 2009 | £163,493 | 4% |
8 Properties |
| 2008 | £156,500 | -17% |
8 Properties |
| 2007 | £183,836 | 9% |
30 Properties |
| 2006 | £167,931 | -10% |
40 Properties |
| 2005 | £185,121 | 4% |
23 Properties |
| 2004 | £176,838 | 15% |
22 Properties |
| 2003 | £150,942 | 46% |
20 Properties |
| 2002 | £81,683 | 8% |
20 Properties |
| 2001 | £75,112 | 11% |
20 Properties |
| 2000 | £66,709 | 20% |
16 Properties |
| 1999 | £53,263 | -5% |
22 Properties |
| 1998 | £56,030 | -14% |
18 Properties |
| 1997 | £64,045 | 1% |
11 Properties |
| 1996 | £63,611 | 27% |
18 Properties |
| 1995 | £46,700 | - |
12 Properties |
Property Price per Property Type in North Holderness
Here you can find historic sold price data in order to help with your property search.
The average Property Paid Price for specific property types in the last three years are:
| Property Type | Average Sold Price | Sold Properties |
|---|---|---|
| Semi Detached House | £217,250.00 | 8 Semi Detached Houses |
| Detached House | £312,307.00 | 13 Detached Houses |
| Terraced House | £134,075.00 | 17 Terraced Houses |

