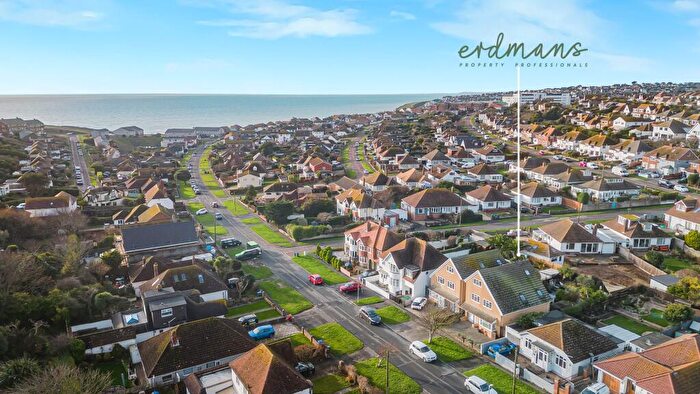
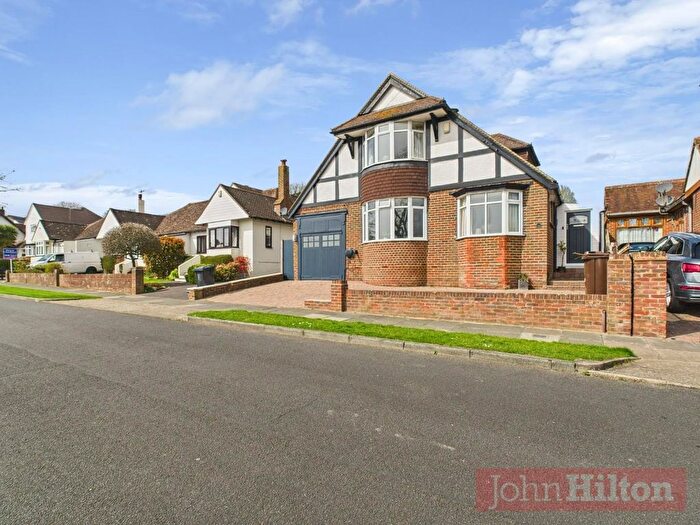
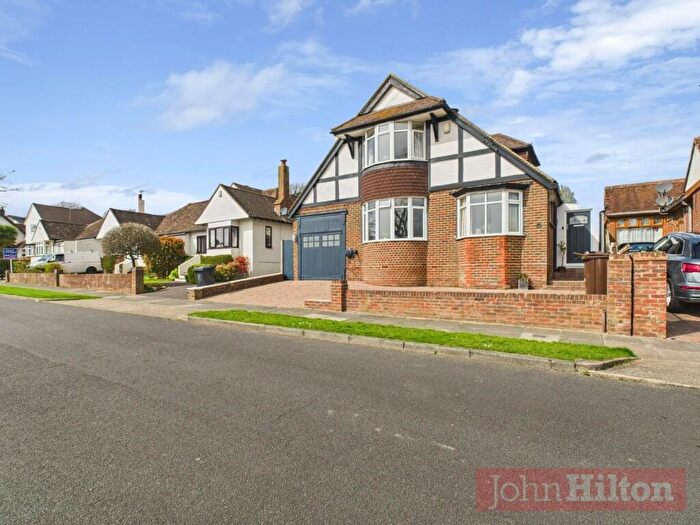
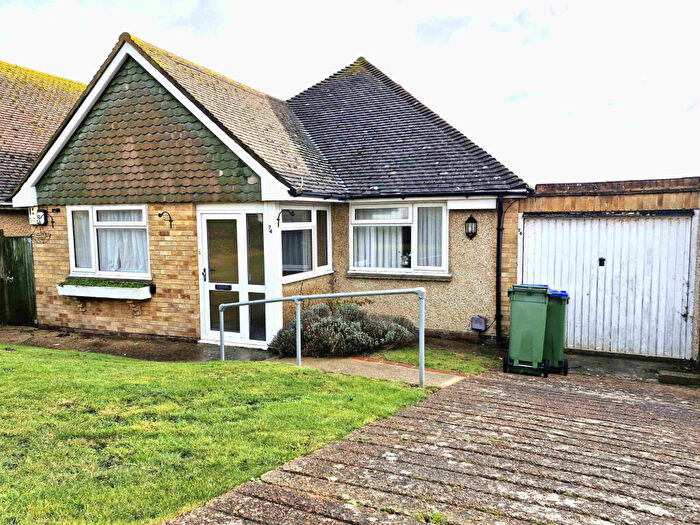
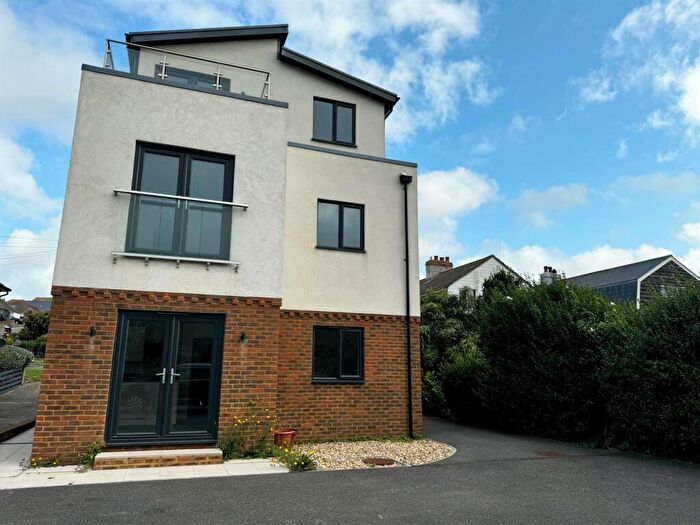
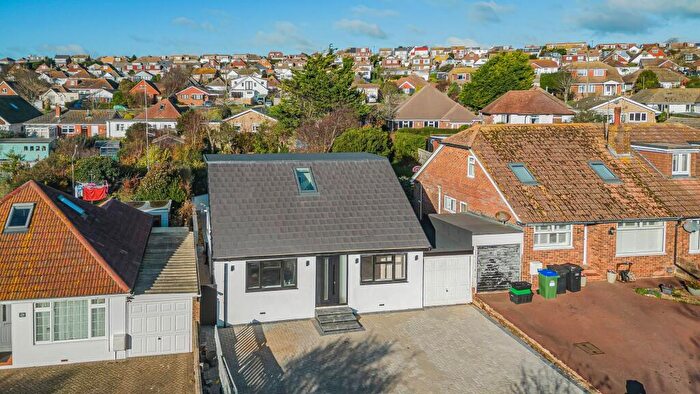
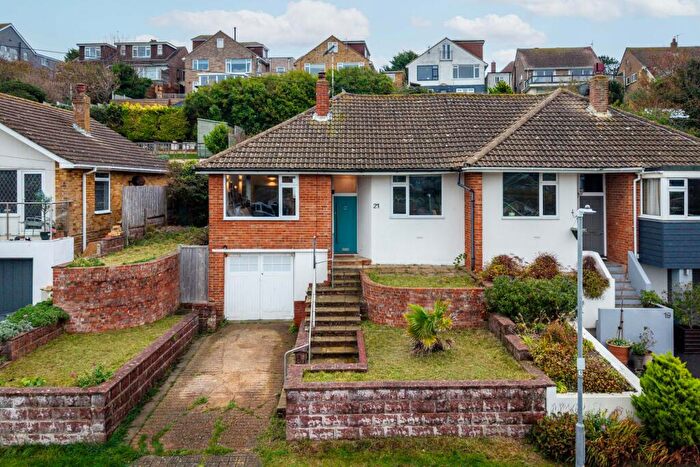
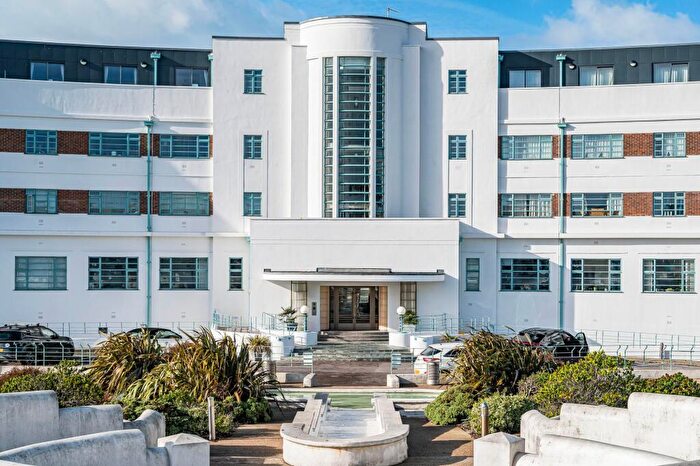
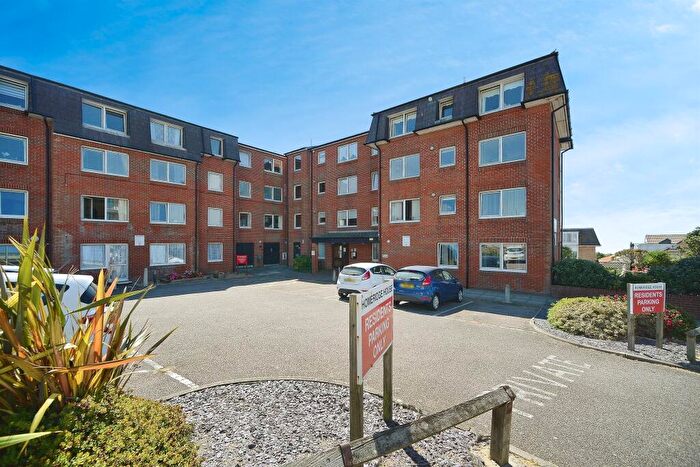
Houses for sale & to rent in East Saltdean And Telscombe Cliffs, Brighton
House Prices in East Saltdean And Telscombe Cliffs
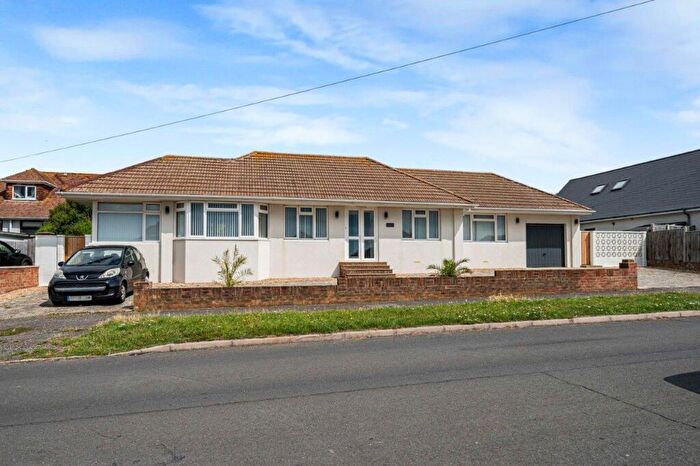
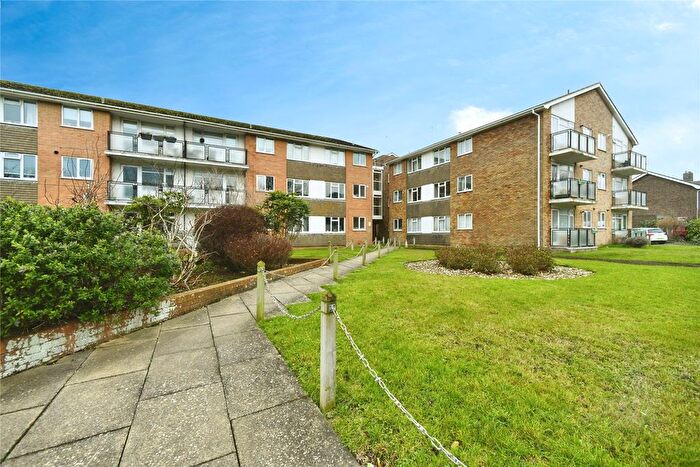
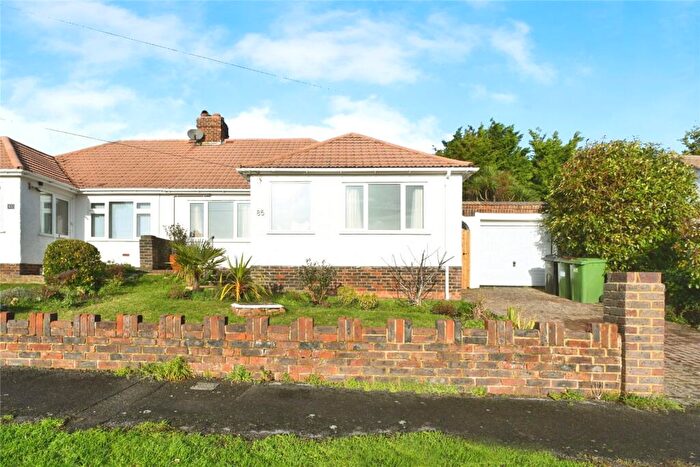
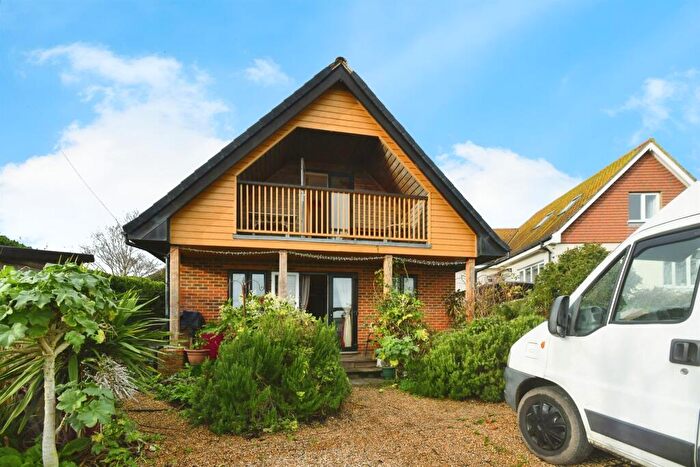
Properties in East Saltdean And Telscombe Cliffs have an average house price of £450,650.00 and had 186 Property Transactions within the last 3 years¹.
East Saltdean And Telscombe Cliffs is an area in Brighton, East Sussex with 1,258 households², where the most expensive property was sold for £1,050,000.00.
Properties for sale in East Saltdean And Telscombe Cliffs
Roads and Postcodes in East Saltdean And Telscombe Cliffs
Navigate through our locations to find the location of your next house in East Saltdean And Telscombe Cliffs, Brighton for sale or to rent.
| Streets | Postcodes |
|---|---|
| Ardingly Road | BN2 8EG |
| Ashurst Avenue | BN2 8DR |
| Bannings Vale | BN2 8DB BN2 8DF BN2 8DG BN2 8DH BN2 8DJ BN2 8DU BN2 8PL BN2 8RL |
| Bevendean Avenue | BN2 8DQ BN2 8PE BN2 8PF |
| Brambletyne Avenue | BN2 8EJ BN2 8EL |
| Chailey Crescent | BN2 8DP |
| Cissbury Crescent | BN2 8EN BN2 8PN BN2 8RH BN2 8RJ |
| Cowden Road | BN2 8DD |
| Crowborough Road | BN2 8EA |
| Findon Avenue | BN2 8RF |
| Hamsey Road | BN2 8DE BN2 8EH |
| Hartfield Road | BN2 8RE |
| Homebush Avenue | BN2 8RD |
| Ifield Close | BN2 8DL |
| Lewes Close | BN2 8DN |
| Longridge Avenue | BN2 8LH BN2 8LJ BN2 8LX BN2 8LY BN2 8RQ |
| Lynwood Road | BN2 8EE BN2 8ER |
| Marine Drive | BN2 8DA |
| Northwood Avenue | BN2 8RG |
| Nutley Avenue | BN2 8EB BN2 8ED |
| Oaklands Avenue | BN2 8PA BN2 8PB BN2 8PD |
| Rodmell Avenue | BN2 8PG BN2 8PH BN2 8PJ |
| Rye Close | BN2 8PP |
| Tye Close | BN2 8DY |
| Walesbeech Road | BN2 8EF |
| Wicklands Avenue | BN2 8EP BN2 8EQ |
Transport near East Saltdean And Telscombe Cliffs
- FAQ
- Price Paid By Year
- Property Type Price
Frequently asked questions about East Saltdean And Telscombe Cliffs
What is the average price for a property for sale in East Saltdean And Telscombe Cliffs?
The average price for a property for sale in East Saltdean And Telscombe Cliffs is £450,650. This amount is 0.84% higher than the average price in Brighton. There are 835 property listings for sale in East Saltdean And Telscombe Cliffs.
What streets have the most expensive properties for sale in East Saltdean And Telscombe Cliffs?
The streets with the most expensive properties for sale in East Saltdean And Telscombe Cliffs are Marine Drive at an average of £847,500, Walesbeech Road at an average of £631,500 and Oaklands Avenue at an average of £548,050.
What streets have the most affordable properties for sale in East Saltdean And Telscombe Cliffs?
The streets with the most affordable properties for sale in East Saltdean And Telscombe Cliffs are Longridge Avenue at an average of £119,839, Lewes Close at an average of £315,000 and Rye Close at an average of £378,750.
Which train stations are available in or near East Saltdean And Telscombe Cliffs?
Some of the train stations available in or near East Saltdean And Telscombe Cliffs are Southease, Newhaven Town and Newhaven Harbour.
Property Price Paid in East Saltdean And Telscombe Cliffs by Year
The average sold property price by year was:
| Year | Average Sold Price | Price Change |
Sold Properties
|
|---|---|---|---|
| 2025 | £427,441 | -13% |
43 Properties |
| 2024 | £481,790 | 7% |
44 Properties |
| 2023 | £447,498 | 0,3% |
46 Properties |
| 2022 | £446,363 | 7% |
53 Properties |
| 2021 | £414,156 | 19% |
83 Properties |
| 2020 | £336,166 | -11% |
59 Properties |
| 2019 | £373,895 | -1% |
54 Properties |
| 2018 | £378,618 | 11% |
56 Properties |
| 2017 | £336,322 | -5% |
55 Properties |
| 2016 | £351,783 | 12% |
56 Properties |
| 2015 | £309,851 | 5% |
81 Properties |
| 2014 | £294,741 | 10% |
79 Properties |
| 2013 | £265,670 | 3% |
60 Properties |
| 2012 | £256,560 | 9% |
51 Properties |
| 2011 | £232,828 | -11% |
56 Properties |
| 2010 | £257,717 | 17% |
48 Properties |
| 2009 | £212,628 | -14% |
45 Properties |
| 2008 | £241,629 | -2% |
34 Properties |
| 2007 | £245,276 | 9% |
86 Properties |
| 2006 | £222,681 | 4% |
101 Properties |
| 2005 | £214,281 | 7% |
72 Properties |
| 2004 | £200,139 | 10% |
88 Properties |
| 2003 | £180,555 | 14% |
88 Properties |
| 2002 | £155,880 | 13% |
106 Properties |
| 2001 | £135,161 | 5% |
97 Properties |
| 2000 | £128,395 | 29% |
66 Properties |
| 1999 | £90,835 | 10% |
106 Properties |
| 1998 | £82,187 | 4% |
83 Properties |
| 1997 | £78,631 | 7% |
85 Properties |
| 1996 | £73,065 | 15% |
71 Properties |
| 1995 | £62,117 | - |
62 Properties |
Property Price per Property Type in East Saltdean And Telscombe Cliffs
Here you can find historic sold price data in order to help with your property search.
The average Property Paid Price for specific property types in the last three years are:
| Property Type | Average Sold Price | Sold Properties |
|---|---|---|
| Semi Detached House | £461,311.00 | 49 Semi Detached Houses |
| Detached House | £536,051.00 | 96 Detached Houses |
| Terraced House | £386,846.00 | 13 Terraced Houses |
| Flat | £168,814.00 | 28 Flats |

