
Houses for sale & to rent in East Sussex, England
House Prices in East Sussex
Properties in East Sussex have
an average house price of
£384k
and had 25,701 Property Transactions
within the last 3 years.¹
East Sussex is a location in
England with
231,934 households², where the most expensive property was sold for £5.02M.
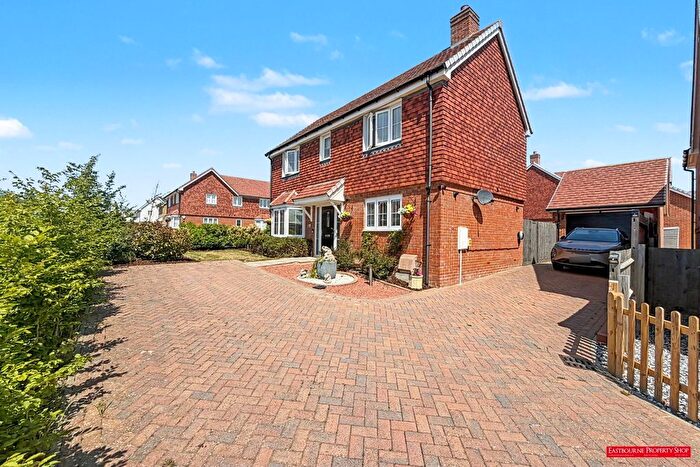
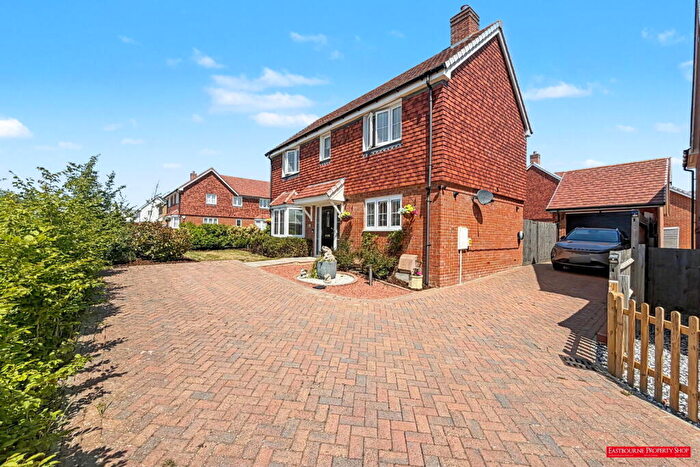
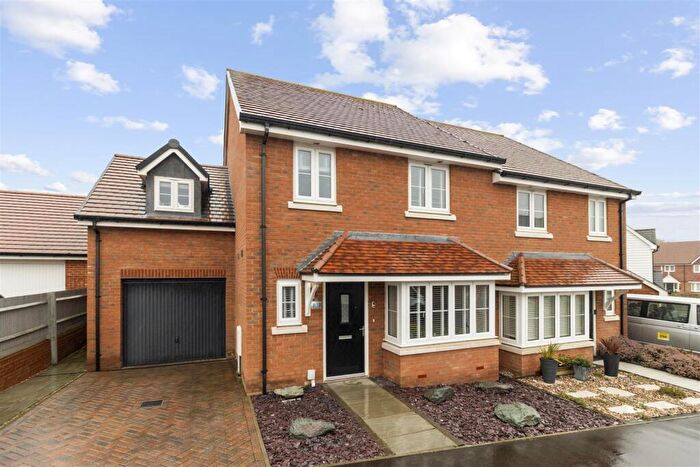
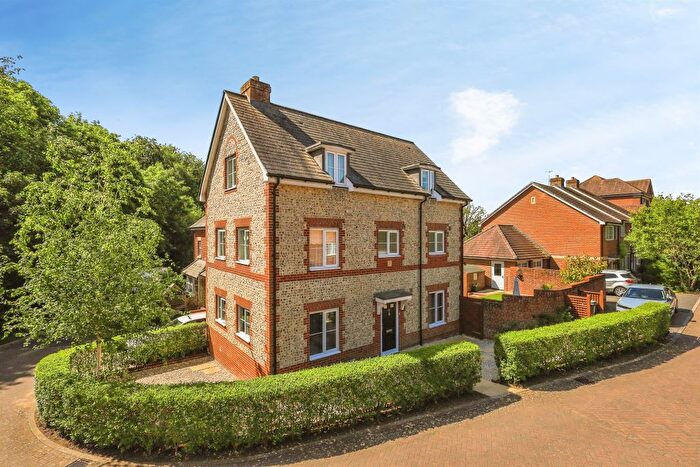
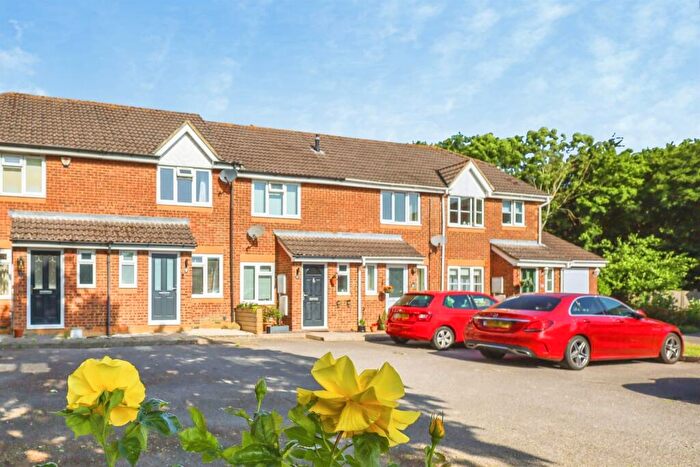
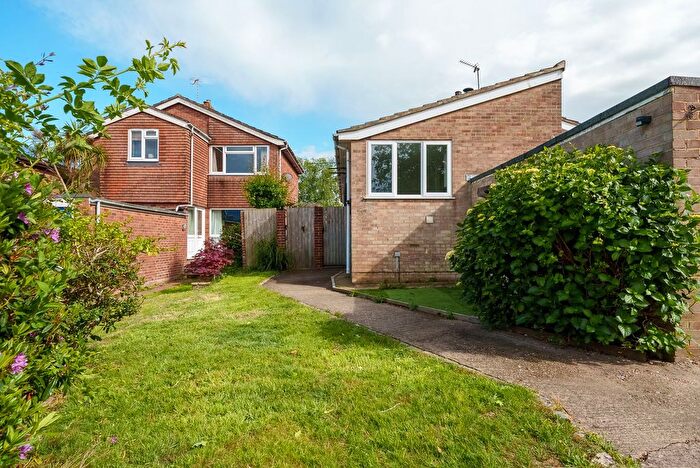
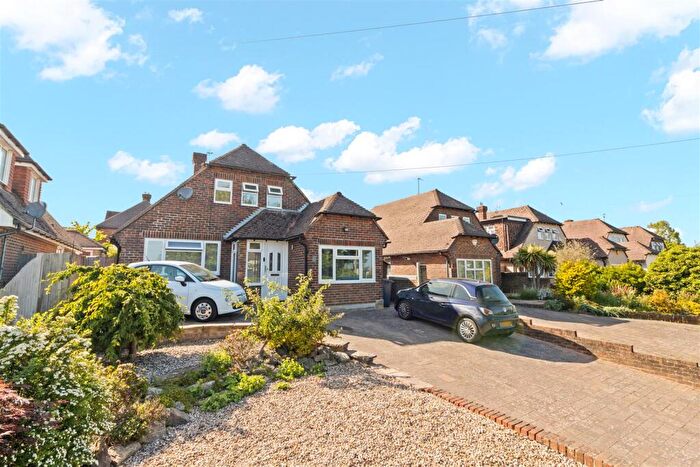
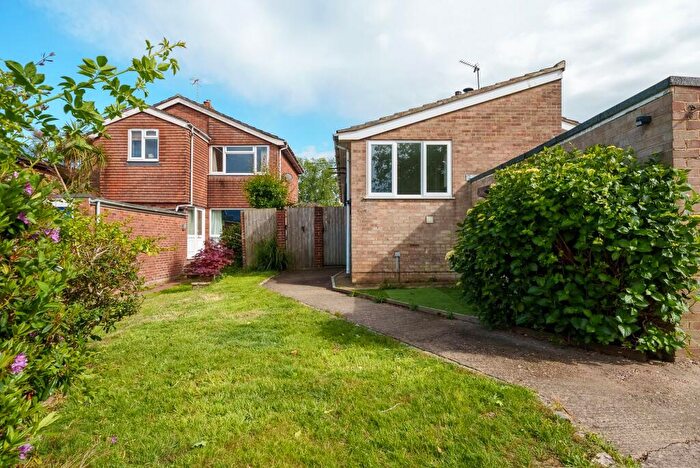
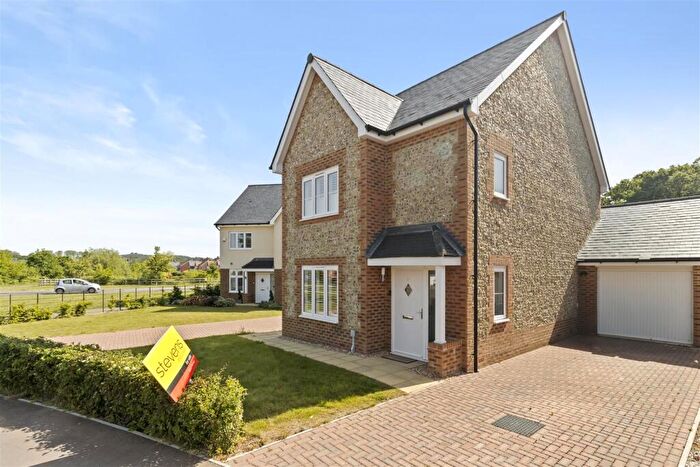
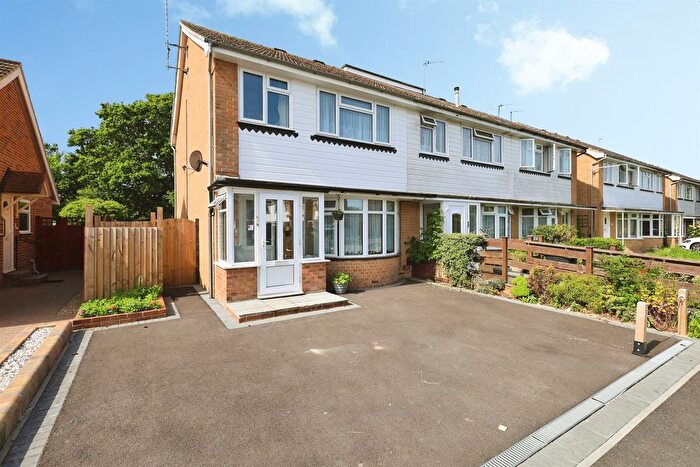
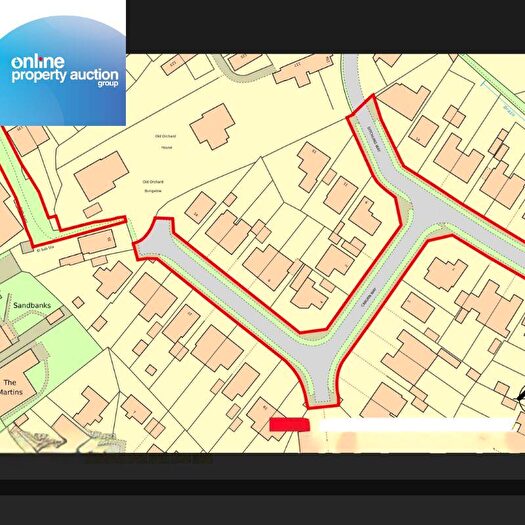
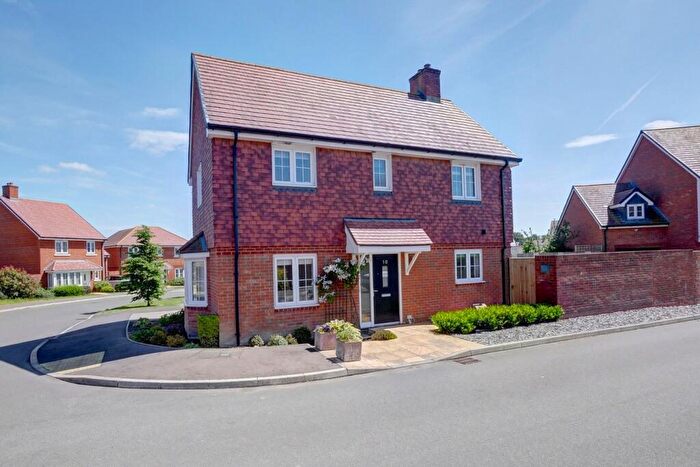
Properties for sale in East Sussex
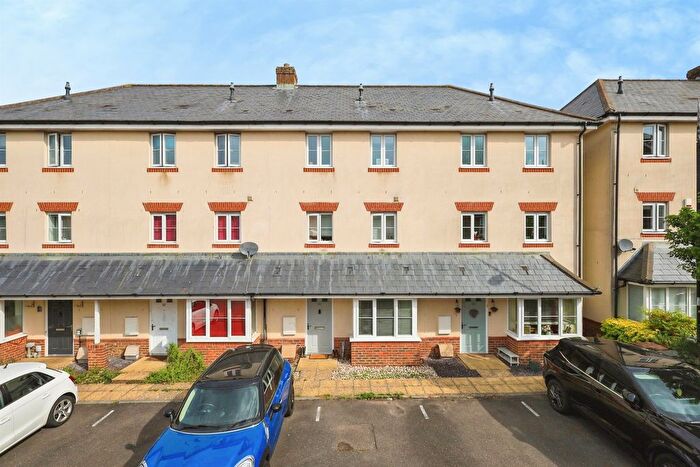

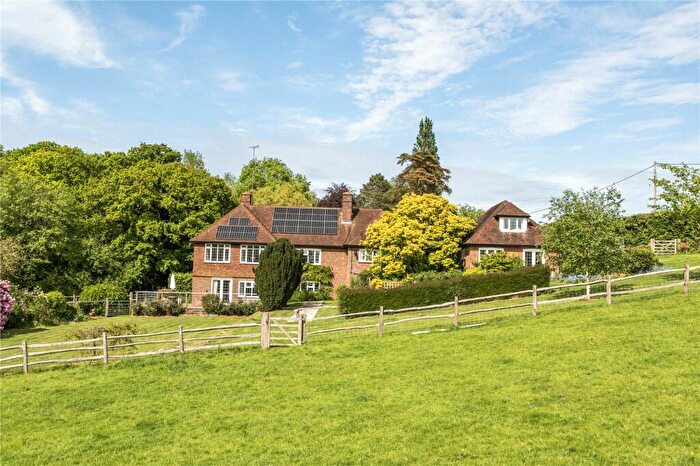
![]()
If you are looking to sell your house, let it out, or receive a property valuation, an expert can help you.
Click the button below to get started.

Towns in East Sussex
Navigate through our locations to find the location of your next house in East Sussex, England for sale or to rent.
- Battle
- Bexhill-on-sea
- Brighton
- Burgess Hill
- Cranbrook
- Crowborough
- East Grinstead
- Eastbourne
- Edenbridge
- Etchingham
- Forest Row
- Hailsham
- Hartfield
- Hassocks
- Hastings
- Haywards Heath
- Heathfield
- Lewes
- Mayfield
- Newhaven
- Peacehaven
- Pevensey
- Polegate
- Robertsbridge
- Rye
- Seaford
- St Leonards-on-sea
- Tunbridge Wells
- Uckfield
- Wadhurst
- Winchelsea
- Hove
Transport in East Sussex
Please see below transportation links in this area:
-
 Polegate Station
 -
Pevensey and Westham Station
-
Pevensey Bay Station
-
Berwick (Sussex) Station
-
Hampden Park Station
-
Normans Bay Station
-
Cooden Beach Station
-
Eastbourne Station
-
Collington Station
-
Bexhill Station
- FAQ
- Price Paid By Year
- Property Type Price
Frequently asked questions about East Sussex
What is the average price for a property for sale in East Sussex?
The average price for a property for sale in East Sussex is £383,625. This amount is 7% higher than the average price in England. There are more than 10,000 property listings for sale in East Sussex.
What locations have the most expensive properties for sale in East Sussex?
The locations with the most expensive properties for sale in East Sussex are Edenbridge at an average of £1,058,544, Hassocks at an average of £894,812 and Hartfield at an average of £820,520.
What locations have the most affordable properties for sale in East Sussex?
The locations with the most affordable properties for sale in East Sussex are St Leonards-on-sea at an average of £287,998, Newhaven at an average of £304,333 and Hastings at an average of £310,469.
Which train stations are available in or near East Sussex?
Some of the train stations available in or near East Sussex are Polegate, Pevensey and Westham and Pevensey Bay.
Property Price Paid in East Sussex by Year
The average sold property price by year was:
| Year | Average Sold Price | Price Change |
Sold Properties
|
|---|---|---|---|
| 2026 | £372,458 | -2% |
1,101 Properties |
| 2025 | £380,033 | -2% |
8,177 Properties |
| 2024 | £386,888 | 0,4% |
8,630 Properties |
| 2023 | £385,358 | -4% |
7,793 Properties |
| 2022 | £399,404 | 5% |
10,332 Properties |
| 2021 | £380,831 | 8% |
13,402 Properties |
| 2020 | £349,102 | 8% |
9,154 Properties |
| 2019 | £320,814 | 1% |
9,817 Properties |
| 2018 | £317,568 | 4% |
10,305 Properties |
| 2017 | £306,293 | 5% |
10,989 Properties |
| 2016 | £291,124 | 7% |
11,611 Properties |
| 2015 | £269,657 | 3% |
11,826 Properties |
| 2014 | £262,902 | 7% |
12,146 Properties |
| 2013 | £245,558 | -0,1% |
10,176 Properties |
| 2012 | £245,825 | 3% |
8,531 Properties |
| 2011 | £238,727 | -4% |
8,376 Properties |
| 2010 | £248,392 | 9% |
8,148 Properties |
| 2009 | £226,141 | -5% |
8,270 Properties |
| 2008 | £237,940 | 2% |
7,213 Properties |
| 2007 | £232,986 | 8% |
15,093 Properties |
| 2006 | £215,073 | 5% |
15,070 Properties |
| 2005 | £204,308 | 4% |
11,857 Properties |
| 2004 | £195,204 | 9% |
14,270 Properties |
| 2003 | £177,119 | 14% |
13,723 Properties |
| 2002 | £152,003 | 17% |
16,524 Properties |
| 2001 | £126,238 | 10% |
15,237 Properties |
| 2000 | £113,403 | 14% |
13,824 Properties |
| 1999 | £97,330 | 10% |
15,677 Properties |
| 1998 | £87,931 | 9% |
13,483 Properties |
| 1997 | £79,578 | 8% |
13,979 Properties |
| 1996 | £73,165 | 3% |
12,548 Properties |
| 1995 | £70,806 | - |
9,683 Properties |
Property Price per Property Type in East Sussex
Here you can find historic sold price data in order to help with your property search.
The average Property Paid Price for specific property types in the last three years are:
| Property Type | Average Sold Price | Sold Properties |
|---|---|---|
| Semi Detached House | £379,232.00 | 5,901 Semi Detached Houses |
| Terraced House | £327,938.00 | 5,594 Terraced Houses |
| Detached House | £583,676.00 | 7,518 Detached Houses |
| Flat | £209,201.00 | 6,688 Flats |