Houses for sale & to rent in Crowborough St. Johns, Crowborough
House Prices in Crowborough St. Johns
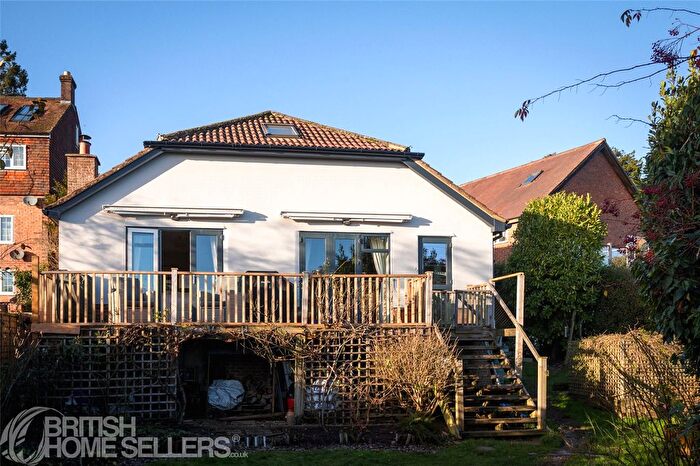
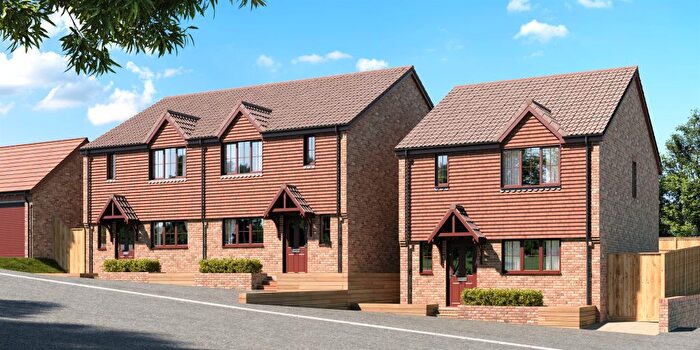
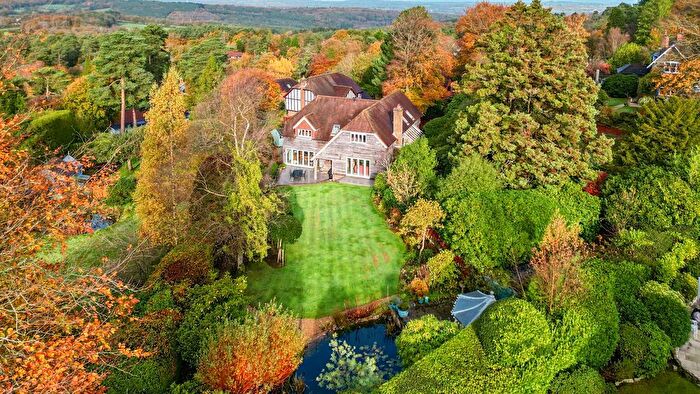
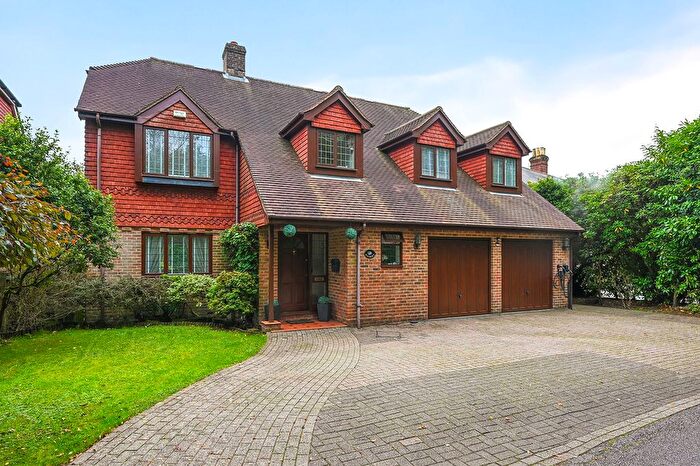
Properties in Crowborough St. Johns have an average house price of £756,236.00 and had 134 Property Transactions within the last 3 years¹.
Crowborough St. Johns is an area in Crowborough, East Sussex with 925 households², where the most expensive property was sold for £1,600,000.00.
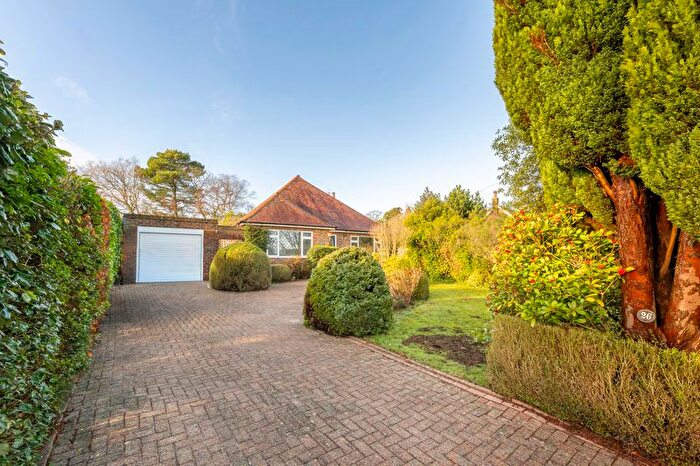
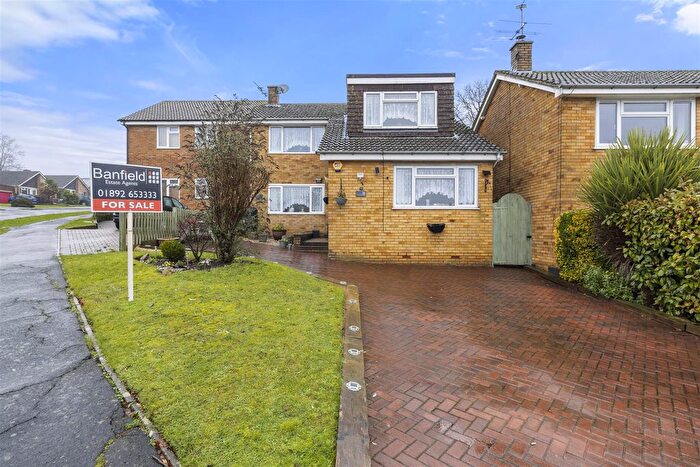
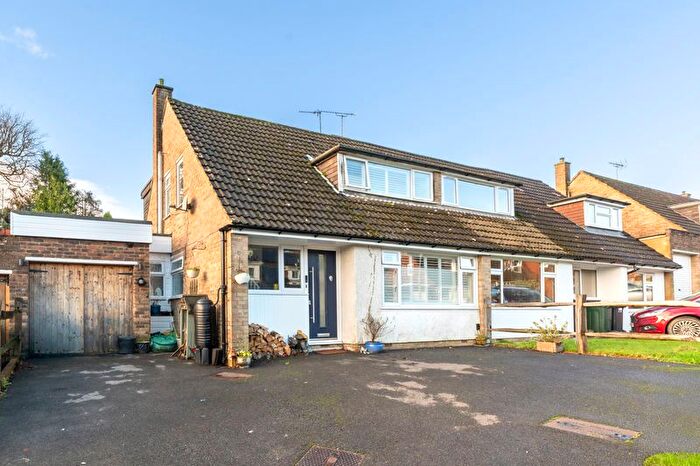
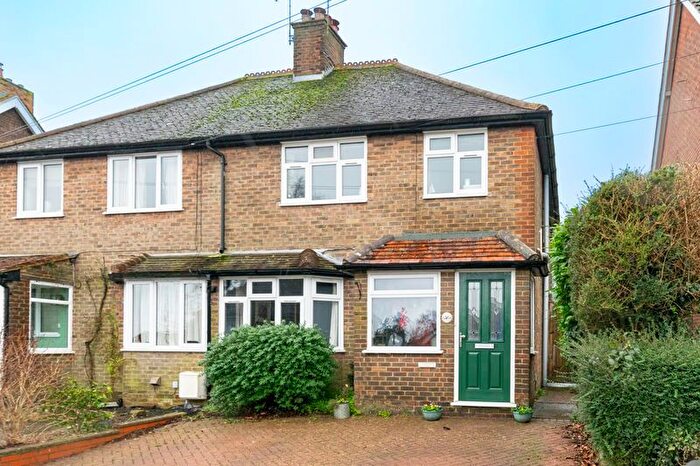
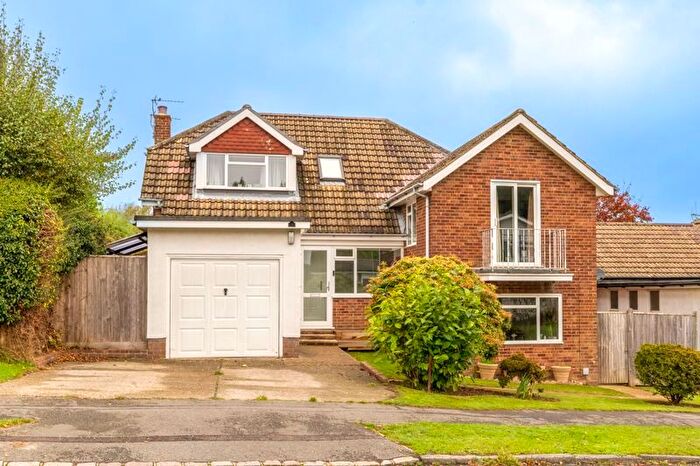
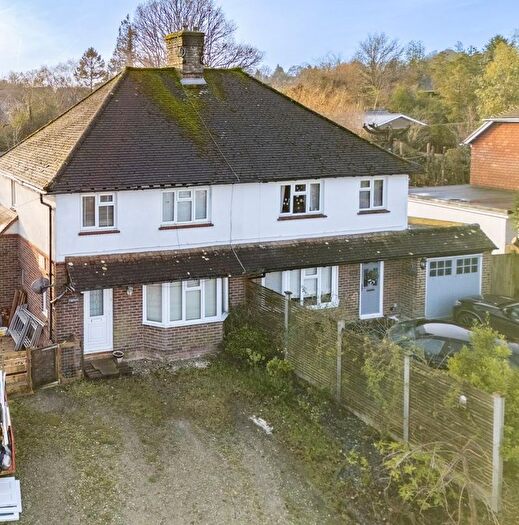
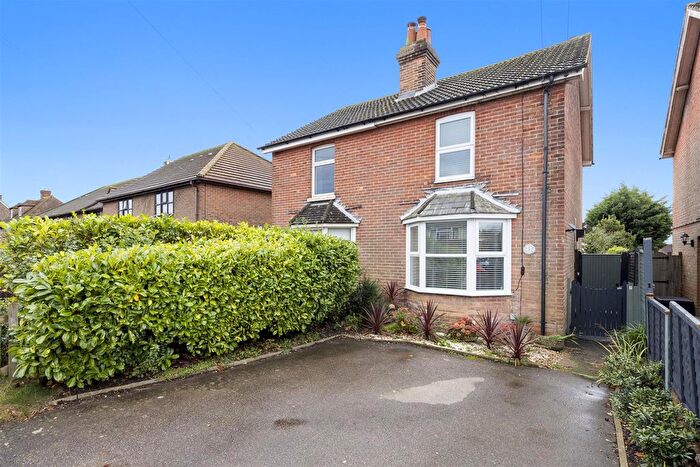
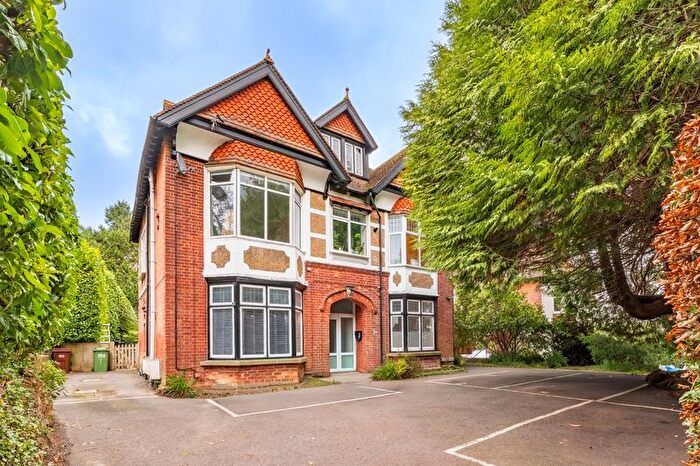
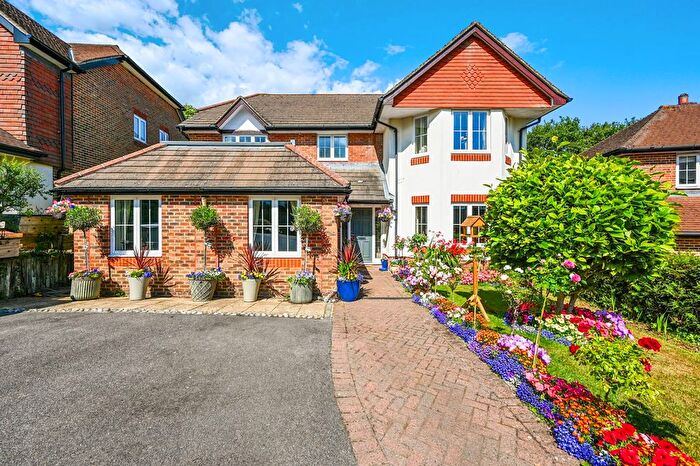
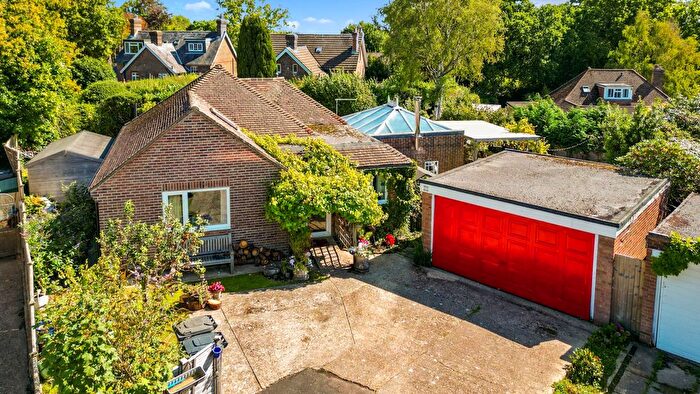
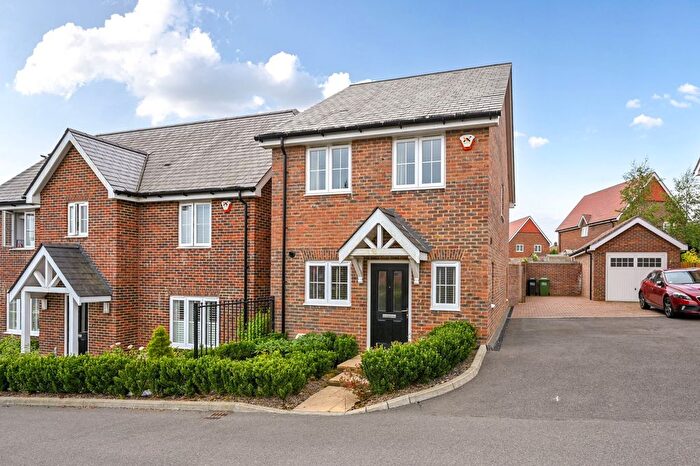
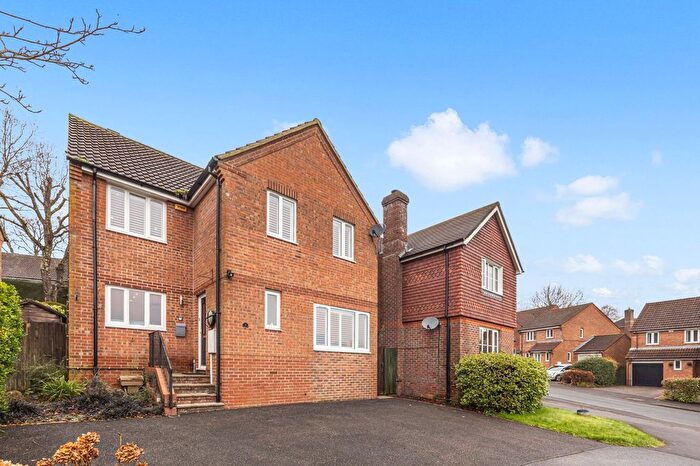
Properties for sale in Crowborough St. Johns
Roads and Postcodes in Crowborough St. Johns
Navigate through our locations to find the location of your next house in Crowborough St. Johns, Crowborough for sale or to rent.
| Streets | Postcodes |
|---|---|
| Ashleigh Gardens | TN6 1YW |
| Aviemore Road | TN6 1QU TN6 1QX |
| Badgers Close | TN6 1RL |
| Beacon Road | TN6 1UD TN6 1UG TN6 1UQ TN6 1AL TN6 1AU TN6 1FD TN6 1UH |
| Boxgate | TN6 1SF |
| Brook Terrace | TN6 1SG |
| Coopers Lane | TN6 1SJ TN6 1SN TN6 1SQ |
| Coopers Wood | TN6 1SH TN6 1SP TN6 1SW |
| Elim Court Gardens | TN6 1BP TN6 1BS |
| Ellison Close | TN6 1LZ |
| Fairview Lane | TN6 1BT |
| Fielden Lane | TN6 1TL |
| Fielden Road | TN6 1TP TN6 1TR TN6 1TS |
| Ghyll Road | TN6 1RY TN6 1ST TN6 1SU TN6 1SZ |
| Glenmore Road | TN6 1TN |
| Glenmore Road East | TN6 1RE |
| Goldsmiths Avenue | TN6 1RJ TN6 1RG |
| Gorsedene Close | TN6 1FJ |
| Heavegate Road | TN6 1UA |
| Innhams Wood | TN6 1TE |
| Kings Chase | TN6 1RQ |
| Langridge Close | TN6 1XT |
| London Road | TN6 1SR TN6 1SS TN6 1TA TN6 1TB TN6 2TR TN6 2TS TN6 2TP |
| Melfort Road | TN6 1QT |
| Nevill Close | TN6 1UW |
| Norbury Close | TN6 1SX |
| Old Lane | TN6 1RD TN6 1RX TN6 1FS |
| Pinewood Chase | TN6 1TY |
| Rannoch Road | TN6 1RA TN6 1RB |
| Rannoch Road West | TN6 1RF |
| St Johns Road | TN6 1RP TN6 1RT TN6 1RU TN6 1SA |
| The Hindleap | TN6 1SL |
| The Warren | TN6 1UB |
| Uckfield Road | TN6 3SX |
| Warren Road | TN6 1QR TN6 1QS TN6 1TT |
Transport near Crowborough St. Johns
- FAQ
- Price Paid By Year
- Property Type Price
Frequently asked questions about Crowborough St. Johns
What is the average price for a property for sale in Crowborough St. Johns?
The average price for a property for sale in Crowborough St. Johns is £756,236. This amount is 51% higher than the average price in Crowborough. There are 1,016 property listings for sale in Crowborough St. Johns.
What streets have the most expensive properties for sale in Crowborough St. Johns?
The streets with the most expensive properties for sale in Crowborough St. Johns are Goldsmiths Avenue at an average of £1,162,500, Pinewood Chase at an average of £1,125,000 and Melfort Road at an average of £1,025,000.
What streets have the most affordable properties for sale in Crowborough St. Johns?
The streets with the most affordable properties for sale in Crowborough St. Johns are Nevill Close at an average of £175,000, Elim Court Gardens at an average of £452,750 and Coopers Wood at an average of £525,625.
Which train stations are available in or near Crowborough St. Johns?
Some of the train stations available in or near Crowborough St. Johns are Crowborough, Eridge and Ashurst.
Property Price Paid in Crowborough St. Johns by Year
The average sold property price by year was:
| Year | Average Sold Price | Price Change |
Sold Properties
|
|---|---|---|---|
| 2025 | £629,616 | -11% |
21 Properties |
| 2024 | £695,962 | -17% |
41 Properties |
| 2023 | £816,739 | -2% |
23 Properties |
| 2022 | £832,535 | 15% |
49 Properties |
| 2021 | £709,535 | 5% |
58 Properties |
| 2020 | £674,052 | 21% |
38 Properties |
| 2019 | £533,158 | -14% |
36 Properties |
| 2018 | £608,637 | -9% |
44 Properties |
| 2017 | £666,355 | 16% |
34 Properties |
| 2016 | £558,171 | 17% |
51 Properties |
| 2015 | £462,677 | -26% |
32 Properties |
| 2014 | £584,487 | 16% |
53 Properties |
| 2013 | £492,344 | -6% |
45 Properties |
| 2012 | £523,276 | 16% |
46 Properties |
| 2011 | £441,691 | -3% |
35 Properties |
| 2010 | £456,860 | 4% |
38 Properties |
| 2009 | £437,409 | 4% |
26 Properties |
| 2008 | £418,083 | -1% |
18 Properties |
| 2007 | £421,720 | 6% |
49 Properties |
| 2006 | £398,052 | -3% |
47 Properties |
| 2005 | £408,794 | 16% |
34 Properties |
| 2004 | £344,680 | 3% |
40 Properties |
| 2003 | £334,247 | -2% |
36 Properties |
| 2002 | £339,773 | 21% |
51 Properties |
| 2001 | £269,036 | 7% |
47 Properties |
| 2000 | £251,012 | 11% |
48 Properties |
| 1999 | £223,920 | 19% |
57 Properties |
| 1998 | £181,653 | 21% |
40 Properties |
| 1997 | £144,019 | 2% |
40 Properties |
| 1996 | £141,275 | -7% |
44 Properties |
| 1995 | £150,784 | - |
38 Properties |
Property Price per Property Type in Crowborough St. Johns
Here you can find historic sold price data in order to help with your property search.
The average Property Paid Price for specific property types in the last three years are:
| Property Type | Average Sold Price | Sold Properties |
|---|---|---|
| Semi Detached House | £588,631.00 | 19 Semi Detached Houses |
| Detached House | £859,049.00 | 100 Detached Houses |
| Terraced House | £314,687.00 | 8 Terraced Houses |
| Flat | £247,035.00 | 7 Flats |

