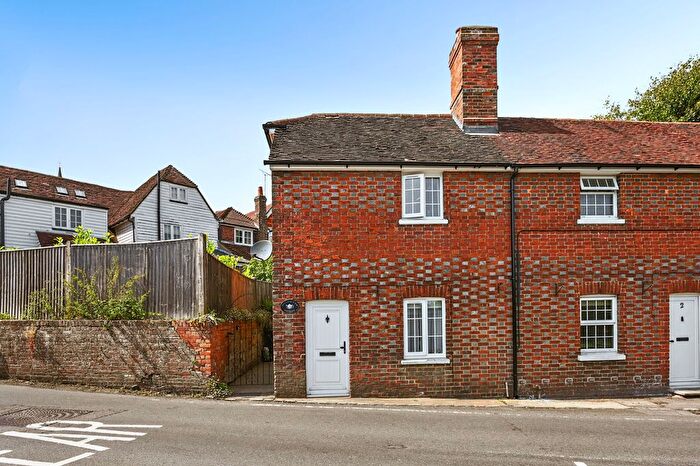
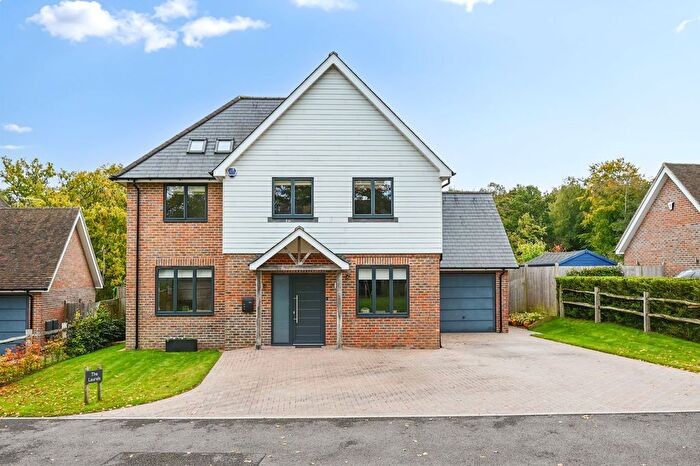
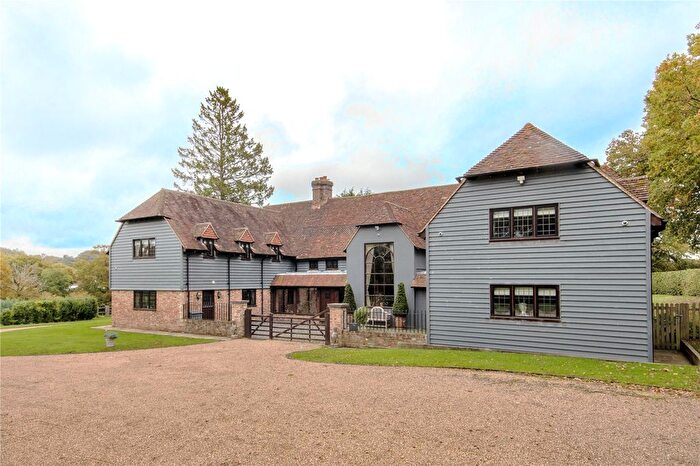
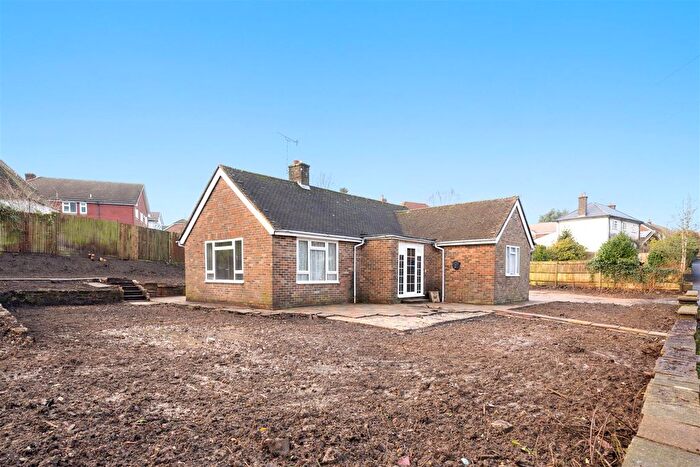
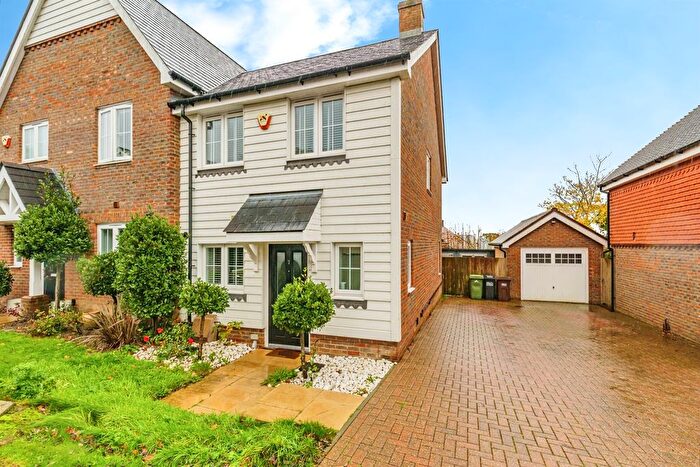
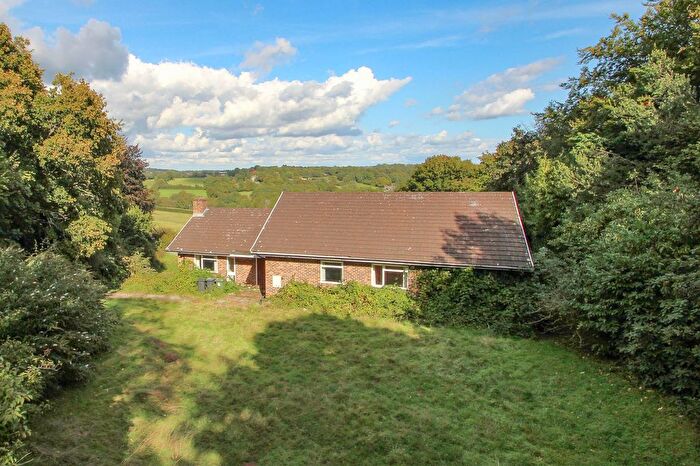
Houses for sale & to rent in Rotherfield, Crowborough
House Prices in Rotherfield
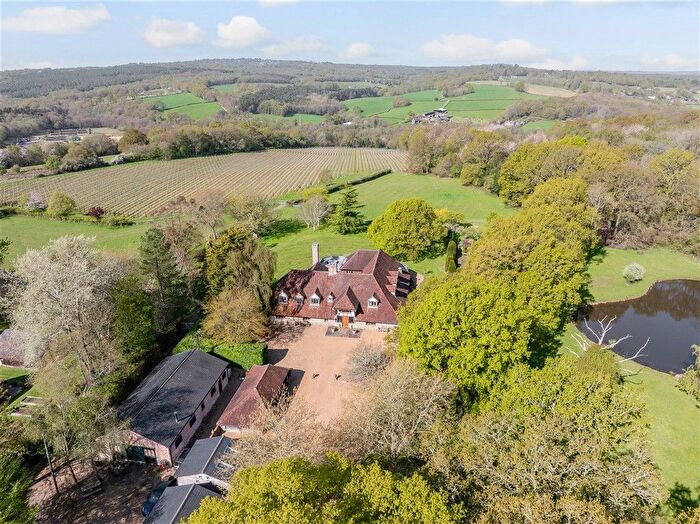
Properties in Rotherfield have an average house price of £623,992.00 and had 110 Property Transactions within the last 3 years¹.
Rotherfield is an area in Crowborough, East Sussex with 956 households², where the most expensive property was sold for £2,350,000.00.
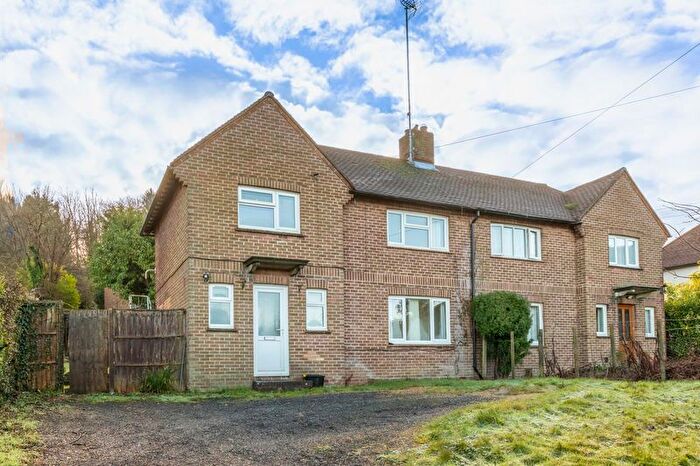
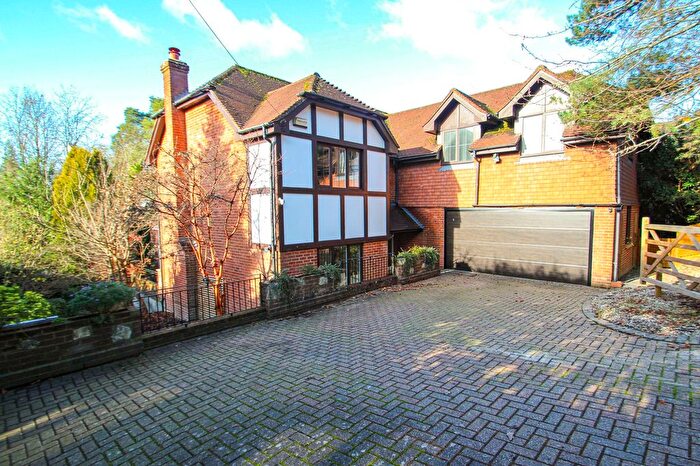
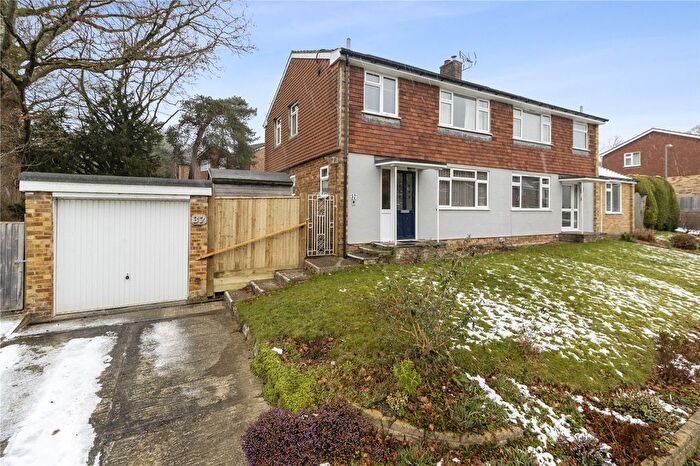
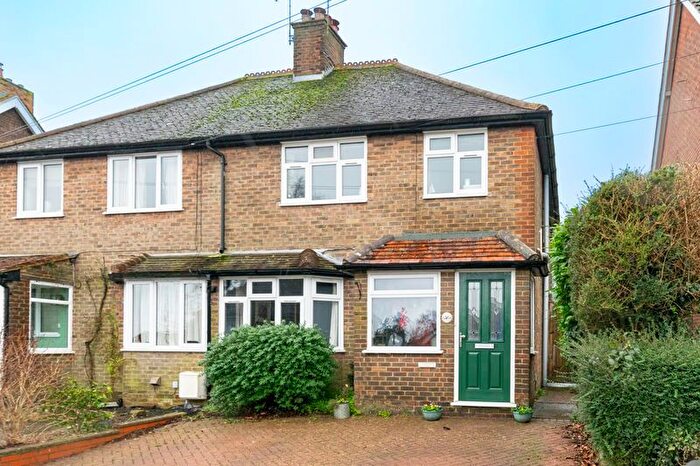
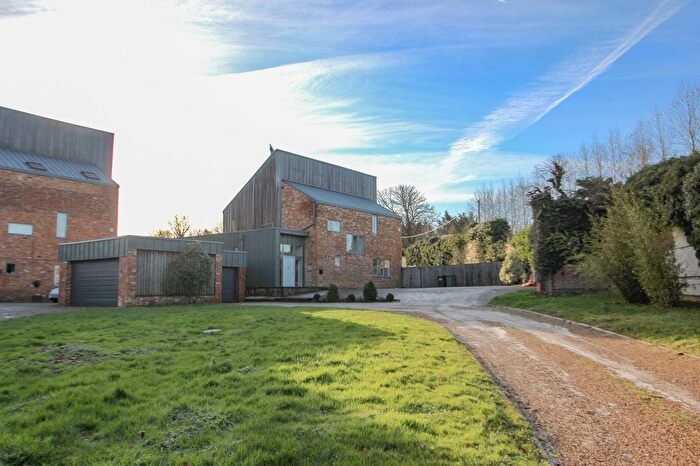
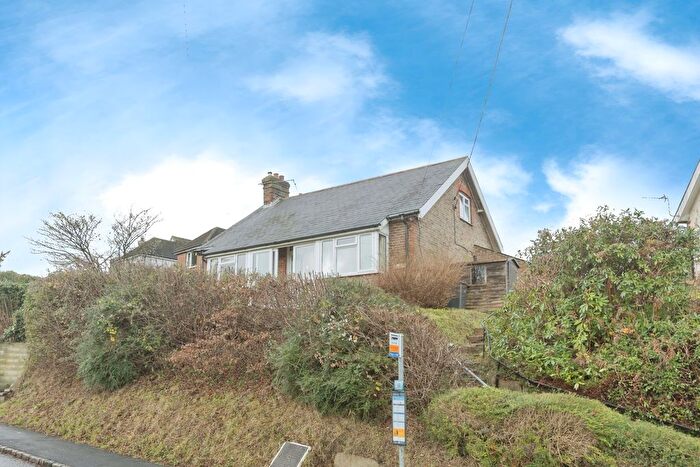
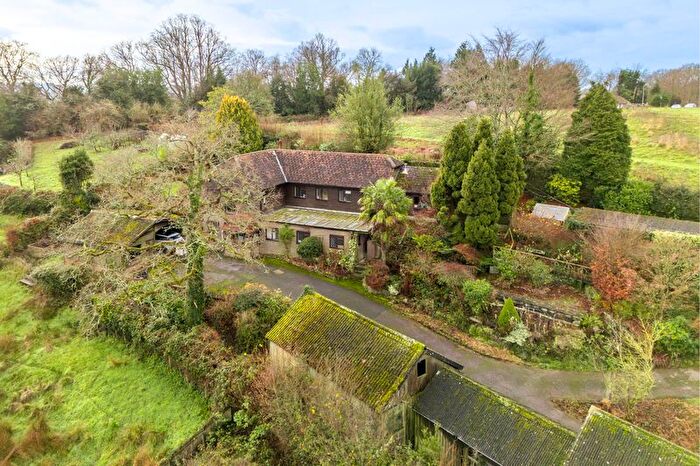
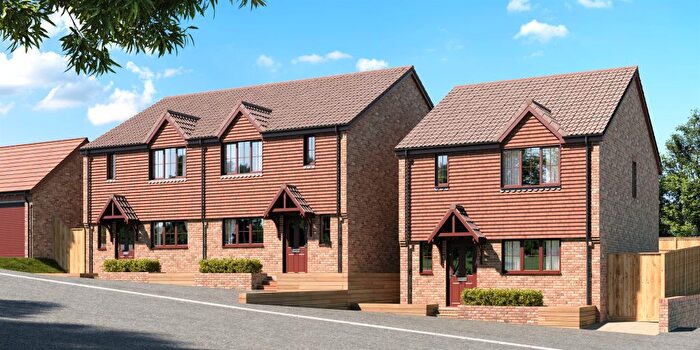
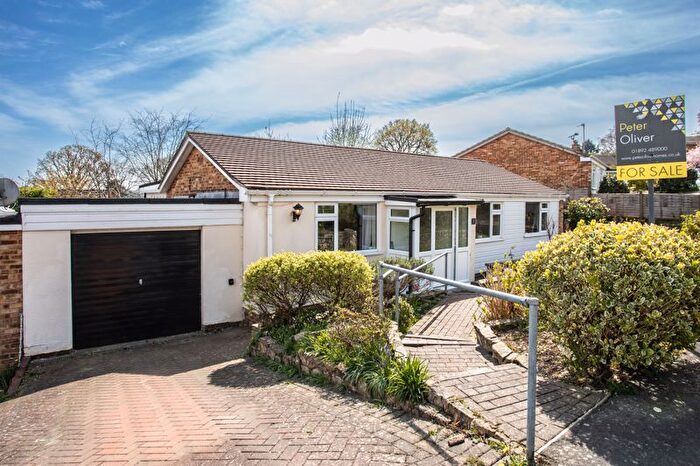
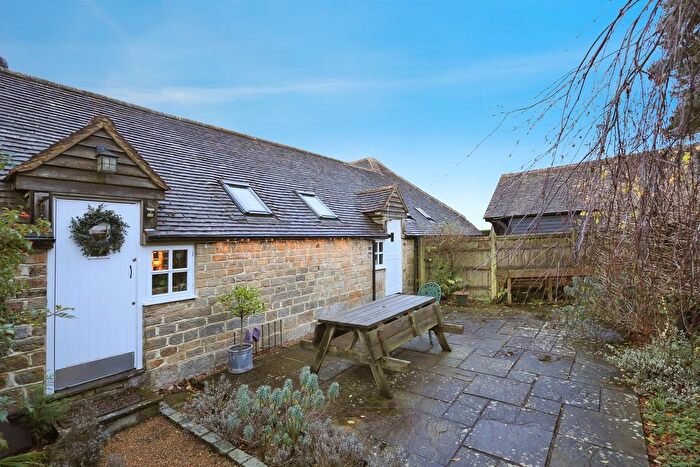
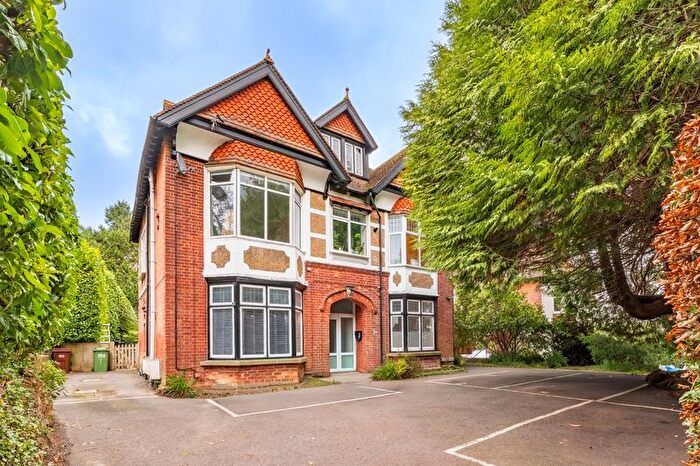
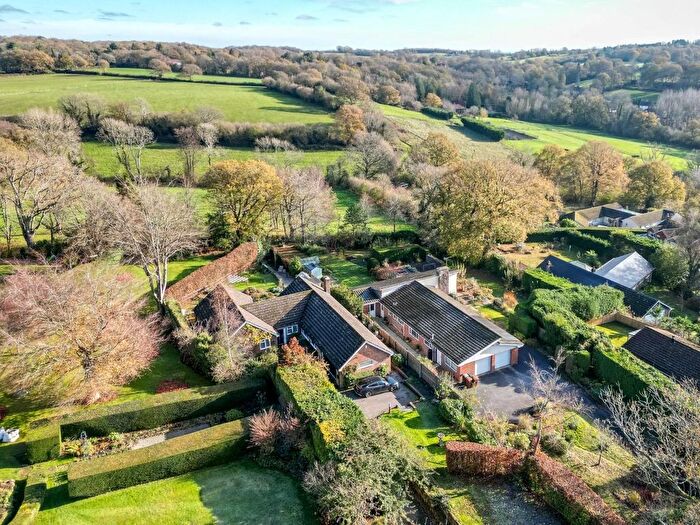
Properties for sale in Rotherfield
Previously listed properties in Rotherfield
Roads and Postcodes in Rotherfield
Navigate through our locations to find the location of your next house in Rotherfield, Crowborough for sale or to rent.
| Streets | Postcodes |
|---|---|
| Argos Hill | TN6 3QF TN6 3QG TN6 3QH |
| Ashley Road | TN6 3PW |
| Bainden Close | TN6 3QR |
| Baldock Villas | TN6 3HX |
| Bicycle Arms Road | TN6 3QE |
| Bletchinglye Lane | TN6 3NN |
| Brecon Terrace | TN6 3LE |
| Burnt Oak Road | TN6 3SD |
| Castle Hill | TN6 3RR TN6 3RT |
| Catts Corner Cottages | TN6 3NF |
| Catts Hill | TN6 3NQ |
| Chant Lane | TN6 3HQ |
| Church Road | TN6 3LA TN6 3LB TN6 3LD TN6 3LF TN6 3LG |
| Clackhams Lane | TN6 3RN |
| Cottage Hill | TN6 3JJ TN6 3JL TN6 3JN TN6 3JW |
| Court Meadow | TN6 3LQ |
| Court Meadow Close | TN6 3LW |
| Dewlands Hill | TN6 3RU |
| Douglas Road | TN6 3QT |
| Eridge Lane | TN6 3JU |
| Fordbrook Hill | TN6 3SB |
| Hadlow Down Road | TN6 3RG TN6 3RQ |
| High Cross | TN6 3PX TN6 3PY TN6 3PZ TN6 3QA TN6 3QB |
| High Street | TN6 3LH TN6 3LL TN6 3LN |
| Hornshurst Road | TN6 3ND |
| Horsegrove Lane | TN6 3JX |
| Hosmers Field | TN6 3JD |
| Mayfield Road | TN6 3LS TN6 3LU |
| Monastery Gardens | TN6 3NB |
| Moons Yard | TN6 3NX |
| New Road | TN6 3JP TN6 3JR TN6 3JS TN6 3JT |
| North Street | TN6 3LX TN6 3LY TN6 3LZ |
| Peeps Lane | TN6 3JH |
| Providence Cottages | TN6 3LJ |
| Redbridge Lane | TN6 3SR |
| Rotherfield Road | TN6 3HH |
| Rotherhurst Lane | TN6 3JG |
| Sheriffs Lane | TN6 3JE TN6 3JF |
| South Street | TN6 3LP TN6 3LR |
| Sparrow Cottages | TN6 3SA |
| Spout Hill | TN6 3QX |
| Station Close | TN6 3JQ |
| Station Road | TN6 3HL TN6 3HN TN6 3HP TN6 3HR TN6 3HS TN6 3HT TN6 3HU TN6 3HW |
| Steep Road | TN6 3RX |
| Stone Cross | TN6 3SJ |
| Sunny Mount | TN6 3HJ |
| Town Row | TN6 3NG TN6 3NL TN6 3QS |
| Town Row Green | TN6 3QU TN6 3QZ |
| Treblers Road | TN6 3RL |
| Tubwell Lane | TN6 3RJ |
| Vine Cottages | TN6 3LT |
| Westwood Cottages | TN6 3NA |
| Yew Tree Lane | TN6 3JA TN6 3JB TN6 3QP |
Transport near Rotherfield
- FAQ
- Price Paid By Year
- Property Type Price
Frequently asked questions about Rotherfield
What is the average price for a property for sale in Rotherfield?
The average price for a property for sale in Rotherfield is £623,992. This amount is 25% higher than the average price in Crowborough. There are 579 property listings for sale in Rotherfield.
What streets have the most expensive properties for sale in Rotherfield?
The streets with the most expensive properties for sale in Rotherfield are Clackhams Lane at an average of £1,022,500, Stone Cross at an average of £976,666 and Bletchinglye Lane at an average of £947,916.
What streets have the most affordable properties for sale in Rotherfield?
The streets with the most affordable properties for sale in Rotherfield are High Cross at an average of £300,000, Hornshurst Road at an average of £331,666 and Cottage Hill at an average of £350,000.
Which train stations are available in or near Rotherfield?
Some of the train stations available in or near Rotherfield are Crowborough, Eridge and Wadhurst.
Property Price Paid in Rotherfield by Year
The average sold property price by year was:
| Year | Average Sold Price | Price Change |
Sold Properties
|
|---|---|---|---|
| 2025 | £601,965 | 7% |
20 Properties |
| 2024 | £560,814 | -20% |
35 Properties |
| 2023 | £671,783 | -0,1% |
26 Properties |
| 2022 | £672,586 | 0,1% |
29 Properties |
| 2021 | £671,620 | 14% |
71 Properties |
| 2020 | £577,742 | 17% |
39 Properties |
| 2019 | £477,328 | -19% |
38 Properties |
| 2018 | £567,471 | -8% |
30 Properties |
| 2017 | £610,966 | 19% |
33 Properties |
| 2016 | £492,390 | 5% |
37 Properties |
| 2015 | £467,337 | -12% |
40 Properties |
| 2014 | £523,371 | 17% |
36 Properties |
| 2013 | £431,954 | 5% |
35 Properties |
| 2012 | £409,283 | 11% |
39 Properties |
| 2011 | £364,587 | -20% |
33 Properties |
| 2010 | £438,710 | 4% |
44 Properties |
| 2009 | £422,825 | 28% |
40 Properties |
| 2008 | £305,460 | -47% |
19 Properties |
| 2007 | £448,091 | 15% |
37 Properties |
| 2006 | £381,663 | 4% |
46 Properties |
| 2005 | £366,580 | 8% |
42 Properties |
| 2004 | £337,711 | 15% |
36 Properties |
| 2003 | £288,169 | -7% |
54 Properties |
| 2002 | £307,228 | 17% |
51 Properties |
| 2001 | £254,397 | 29% |
45 Properties |
| 2000 | £179,797 | 6% |
47 Properties |
| 1999 | £168,130 | -11% |
35 Properties |
| 1998 | £187,016 | 29% |
49 Properties |
| 1997 | £133,483 | 14% |
51 Properties |
| 1996 | £115,177 | -5% |
54 Properties |
| 1995 | £120,654 | - |
32 Properties |
Property Price per Property Type in Rotherfield
Here you can find historic sold price data in order to help with your property search.
The average Property Paid Price for specific property types in the last three years are:
| Property Type | Average Sold Price | Sold Properties |
|---|---|---|
| Semi Detached House | £500,250.00 | 24 Semi Detached Houses |
| Detached House | £810,916.00 | 58 Detached Houses |
| Terraced House | £346,111.00 | 27 Terraced Houses |
| Flat | £255,000.00 | 1 Flat |

