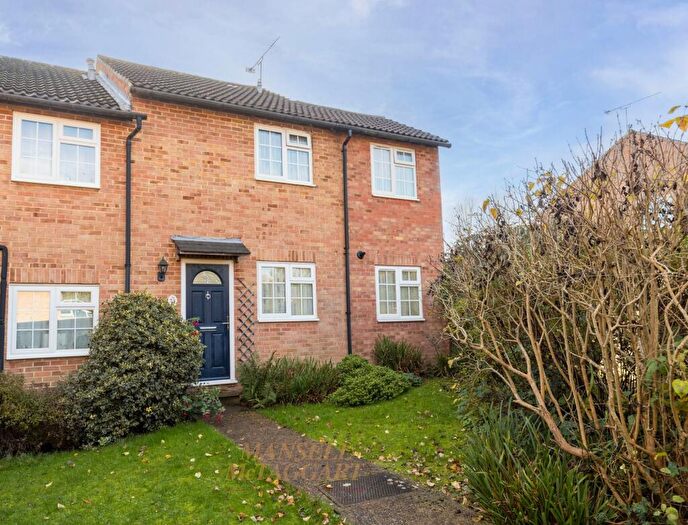
Houses for sale & to rent in Hartfield, Forest Row
House Prices in Hartfield
Properties in Hartfield have an average house price of £370,823.00 and had 11 Property Transactions within the last 3 years¹.
Hartfield is an area in Forest Row, East Sussex with 100 households², where the most expensive property was sold for £900,000.00.
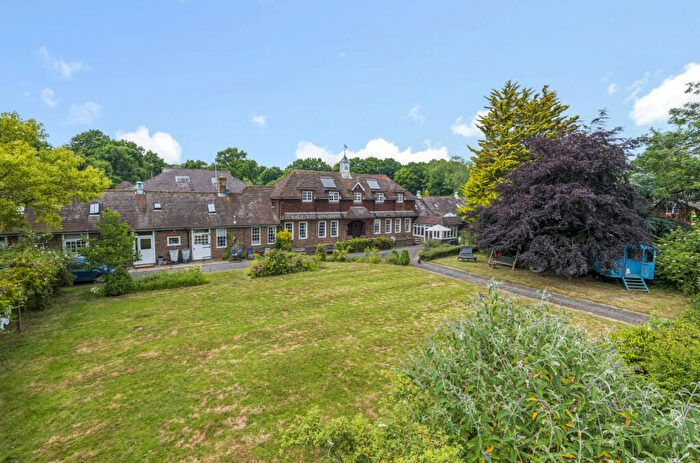
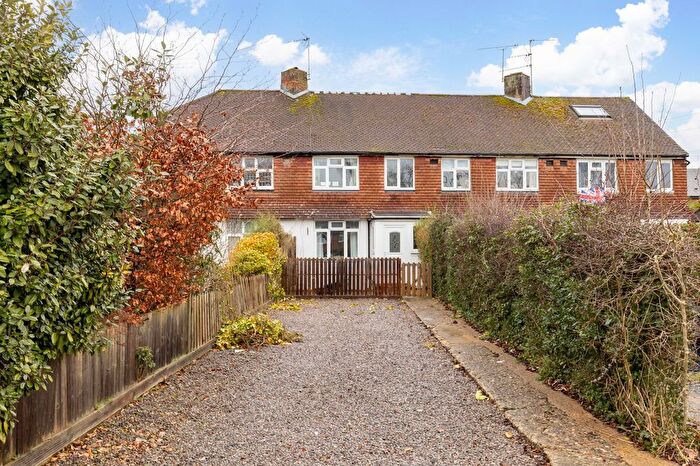
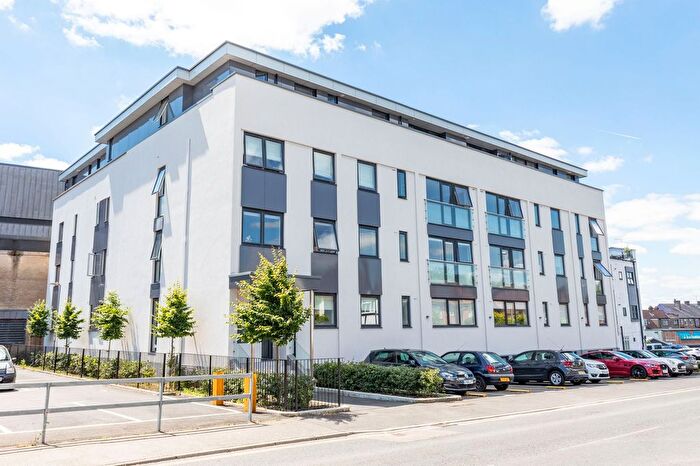
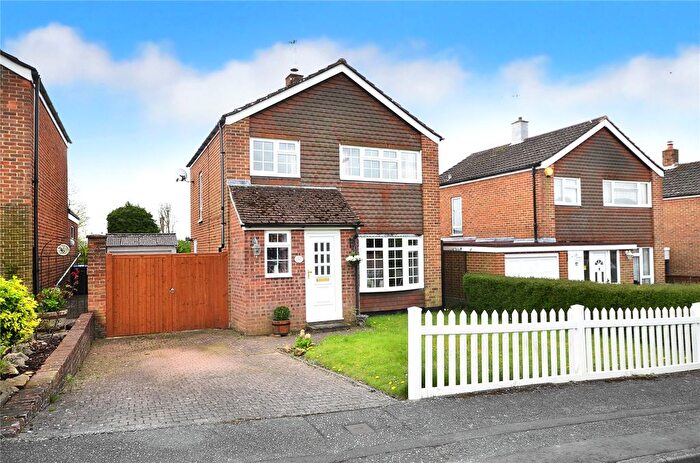
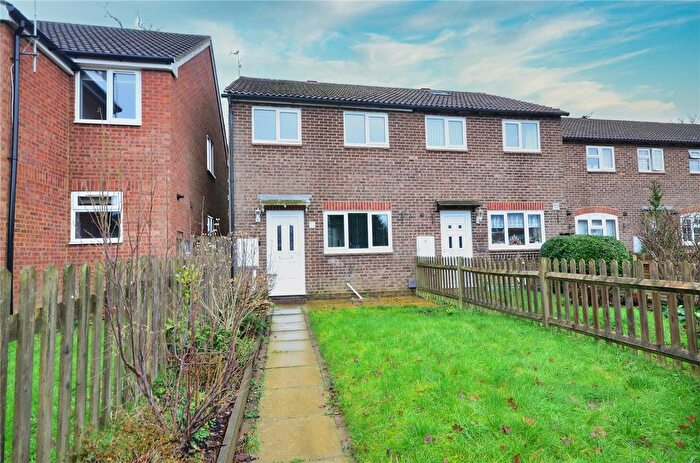
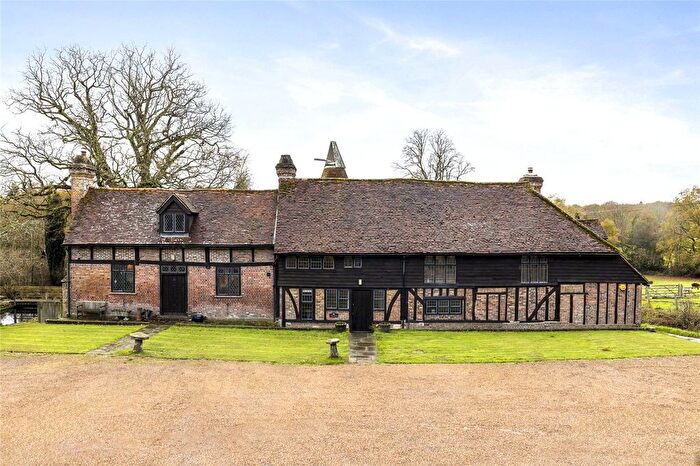
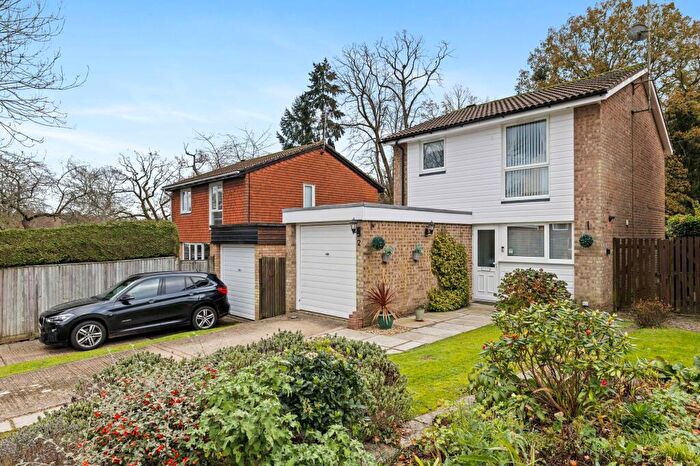
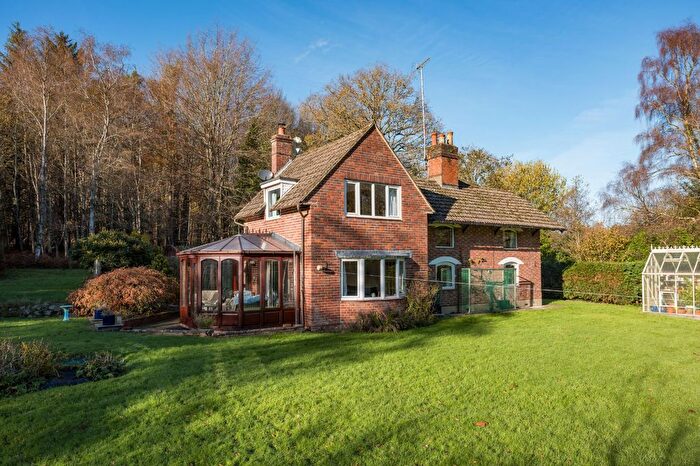
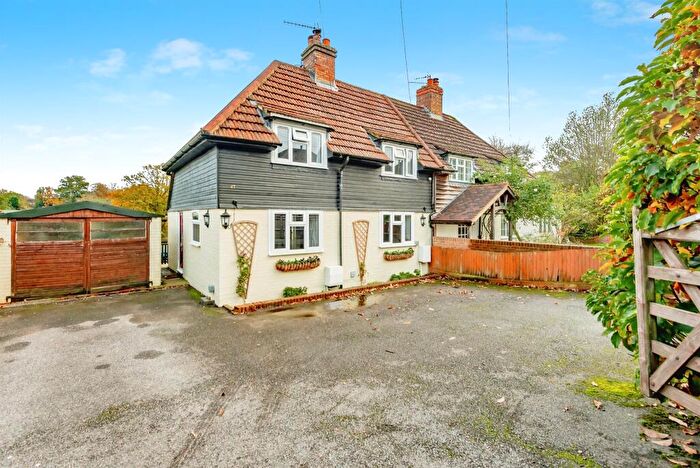
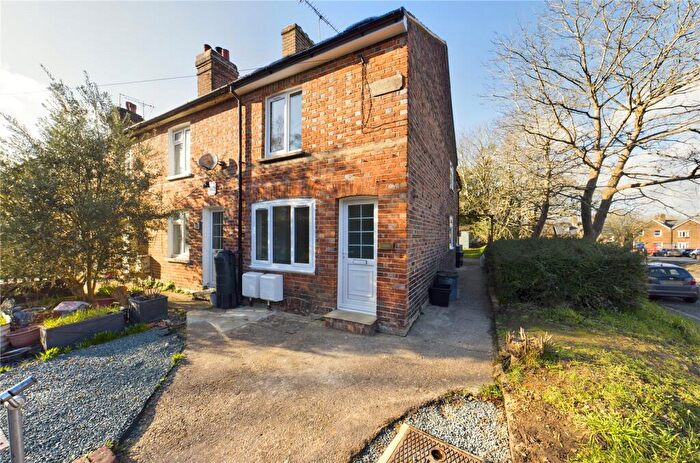
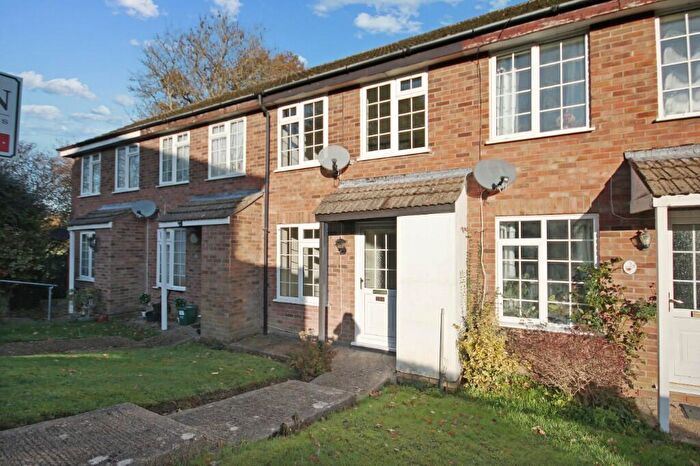
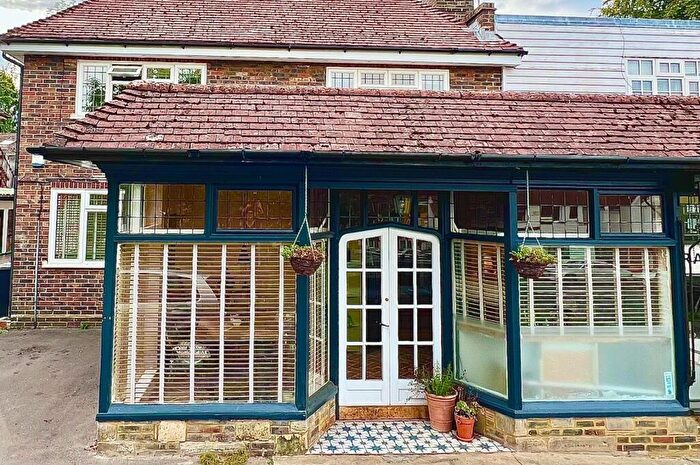
Properties for sale in Hartfield
Roads and Postcodes in Hartfield
Navigate through our locations to find the location of your next house in Hartfield, Forest Row for sale or to rent.
| Streets | Postcodes |
|---|---|
| Ashdown Park | RH18 5JR |
| Colestock Cross | TN8 7EA |
| Colestock Road | TN8 7AY |
| Glenmore Road | TN6 1TW |
| Gotwick Manor | RH19 3PY |
| Hartfield Road | RH18 5FU RH18 5JX |
| Holtye Hill | TN8 7EL |
| Holtye Road | RH19 3PW |
| Homefield Cottages | RH19 3SJ |
| Hubbards Hill | TN6 1XG |
| Lines Close | RH18 5GE |
| London Road | RH18 5EE TN6 1TQ |
| Lye Green | TN6 1UY |
| Pixton Hill | RH18 5JU |
| Shepherds Grove Lane | RH19 3PZ |
| Shovelstrode Lane | RH19 3PN |
| St Johns Road | TN6 1XP |
| Wych Cross | RH18 5JP |
| RH18 5JY RH19 3PE RH19 3PQ RH19 3QB RH19 3QD |
Transport near Hartfield
- FAQ
- Price Paid By Year
- Property Type Price
Frequently asked questions about Hartfield
What is the average price for a property for sale in Hartfield?
The average price for a property for sale in Hartfield is £370,823. This amount is 39% lower than the average price in Forest Row. There are 3,090 property listings for sale in Hartfield.
Which train stations are available in or near Hartfield?
Some of the train stations available in or near Hartfield are Cowden, Ashurst and East Grinstead.
Property Price Paid in Hartfield by Year
The average sold property price by year was:
| Year | Average Sold Price | Price Change |
Sold Properties
|
|---|---|---|---|
| 2024 | £660,000 | 48% |
2 Properties |
| 2023 | £341,343 | 31% |
6 Properties |
| 2022 | £237,000 | -90% |
3 Properties |
| 2021 | £450,000 | 21% |
2 Properties |
| 2020 | £357,500 | 36% |
2 Properties |
| 2019 | £230,000 | -97% |
1 Property |
| 2018 | £453,333 | 35% |
3 Properties |
| 2017 | £296,666 | -86% |
3 Properties |
| 2016 | £552,500 | -8% |
2 Properties |
| 2015 | £599,166 | -194% |
3 Properties |
| 2014 | £1,763,525 | 8% |
2 Properties |
| 2007 | £1,622,000 | 79% |
1 Property |
| 1999 | £333,000 | -11% |
1 Property |
| 1998 | £370,000 | 28% |
1 Property |
| 1997 | £265,000 | - |
1 Property |
Property Price per Property Type in Hartfield
Here you can find historic sold price data in order to help with your property search.
The average Property Paid Price for specific property types in the last three years are:
| Property Type | Average Sold Price | Sold Properties |
|---|---|---|
| Semi Detached House | £453,500.00 | 2 Semi Detached Houses |
| Flat | £284,007.00 | 8 Flats |
| Detached House | £900,000.00 | 1 Detached House |

