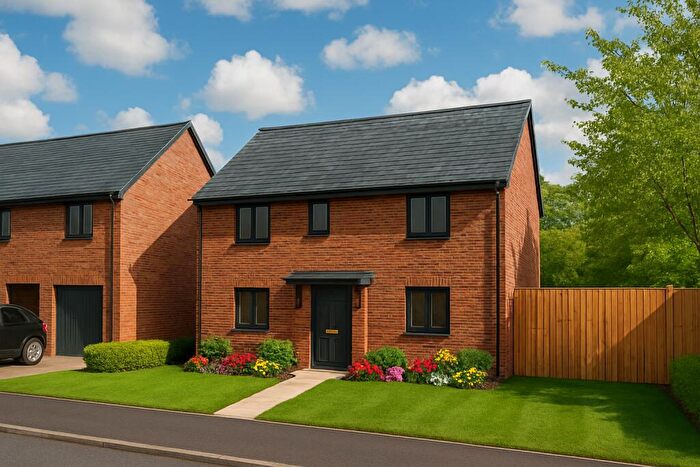
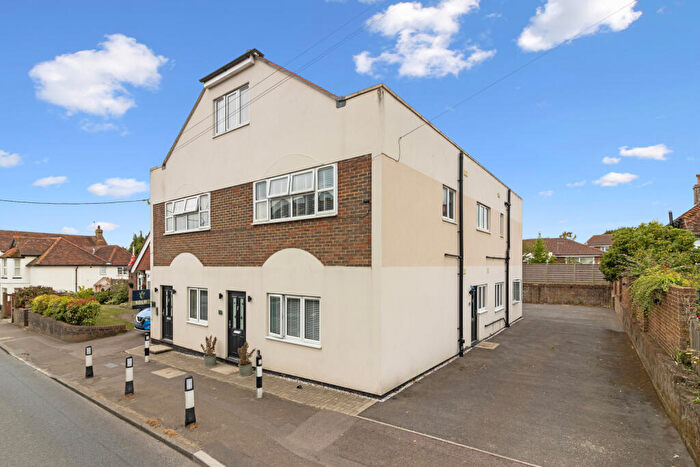
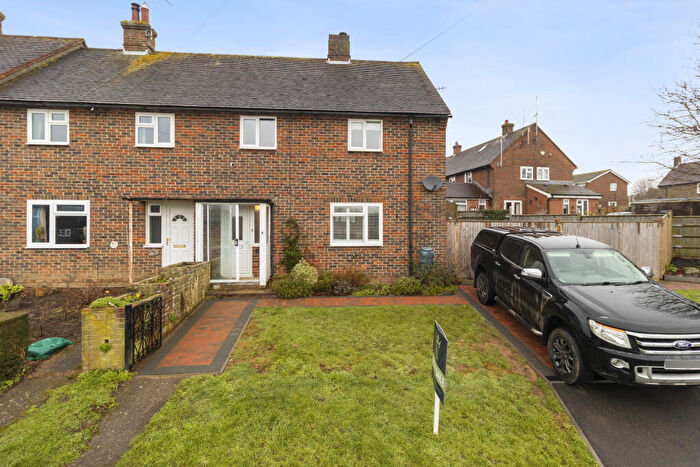
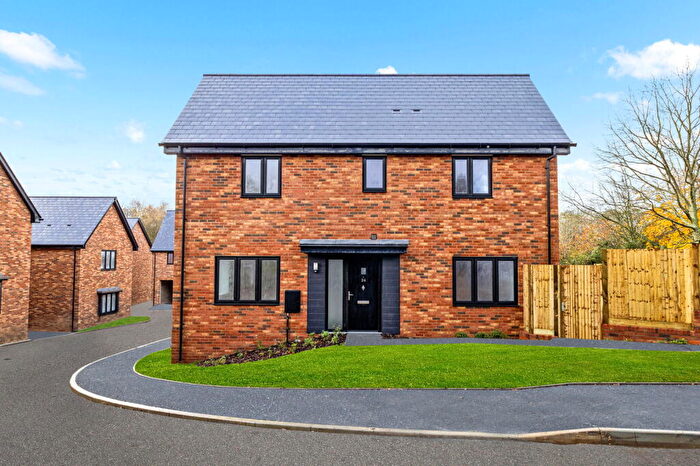
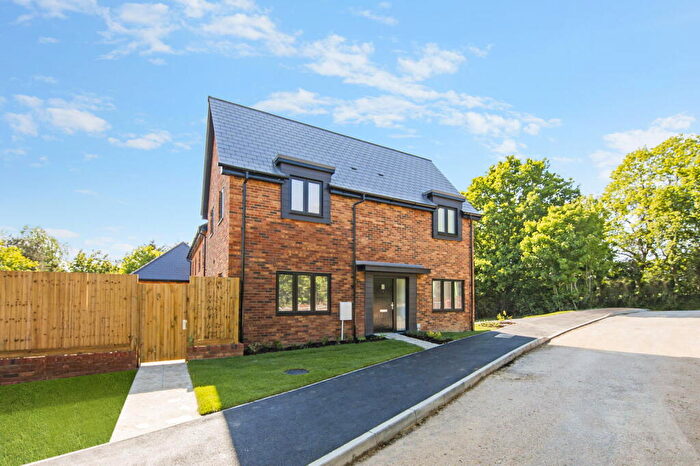
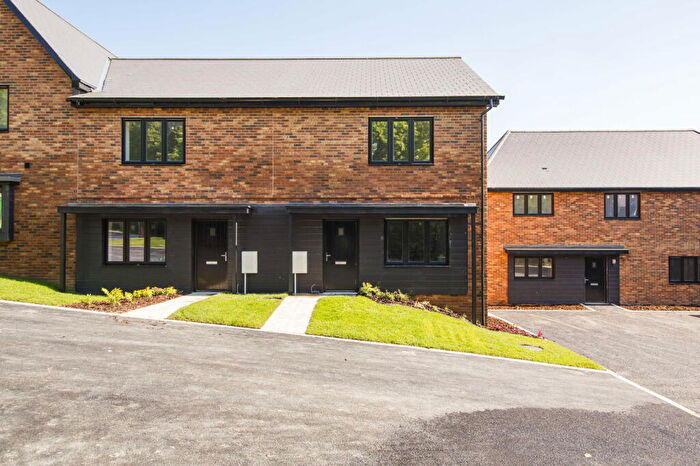
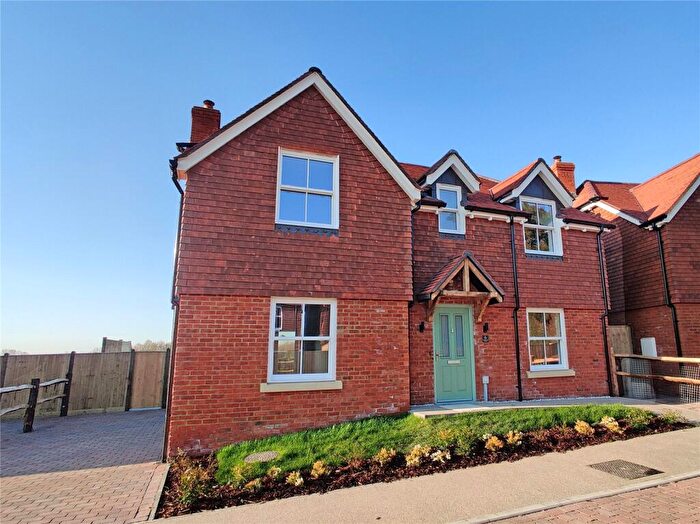
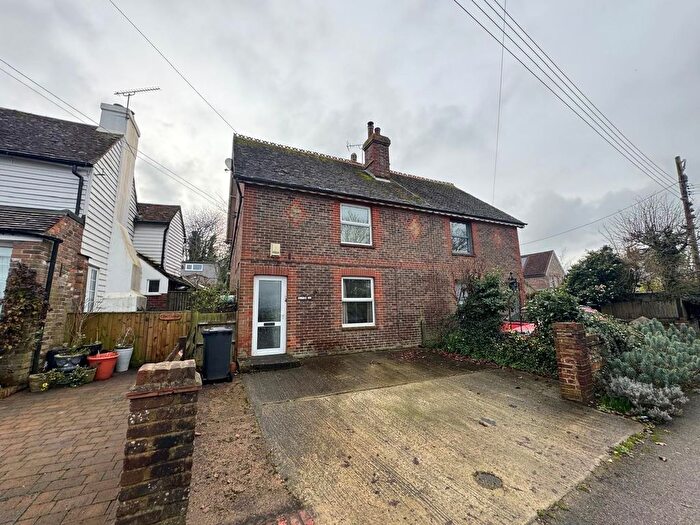
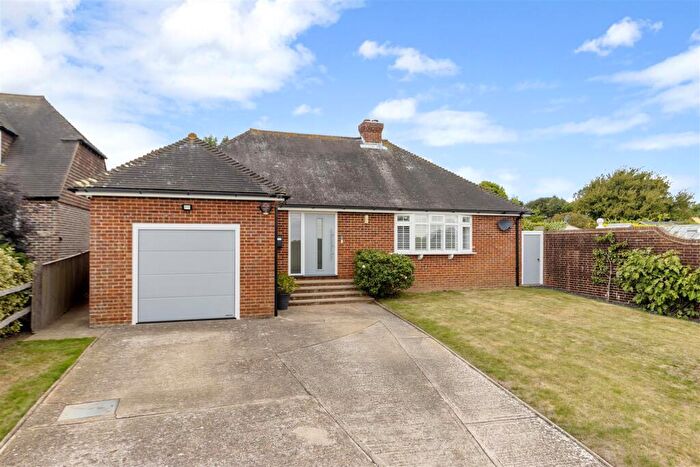
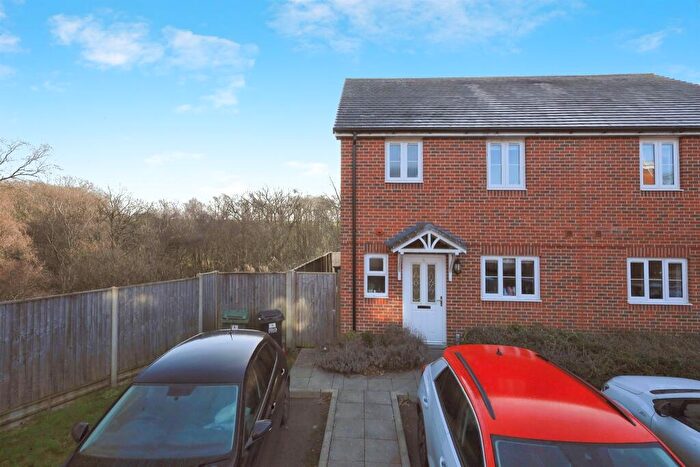
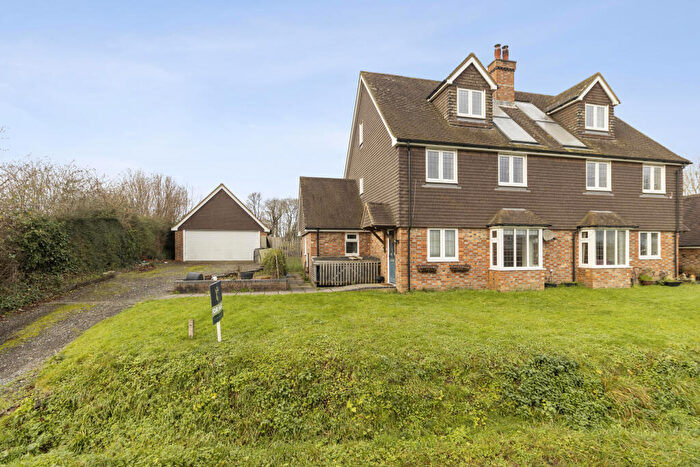
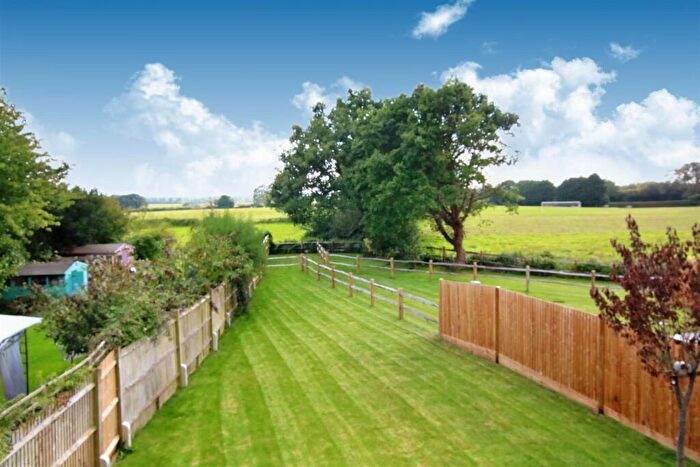
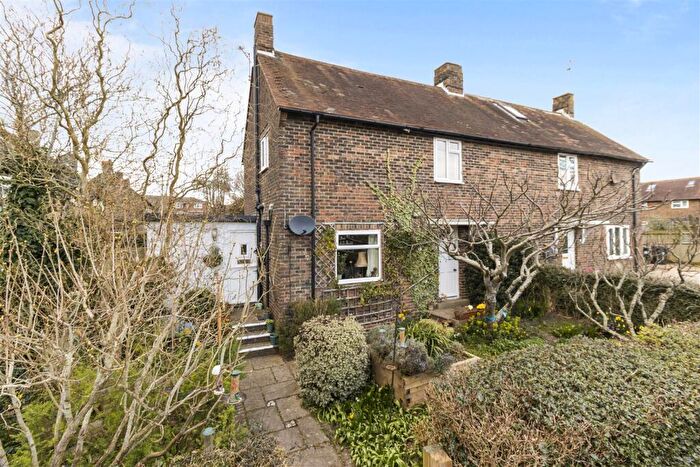
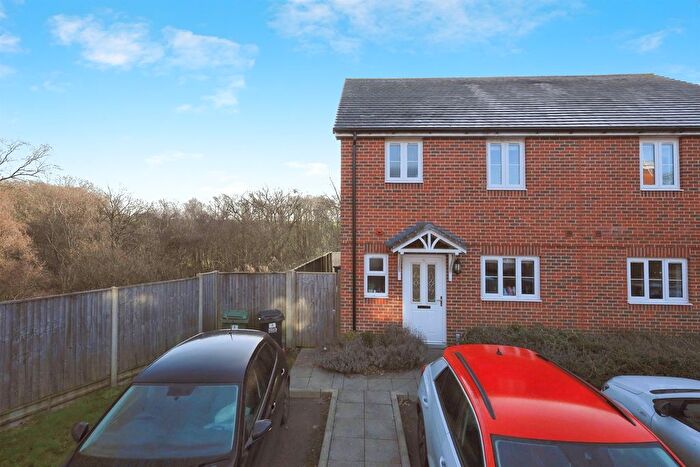
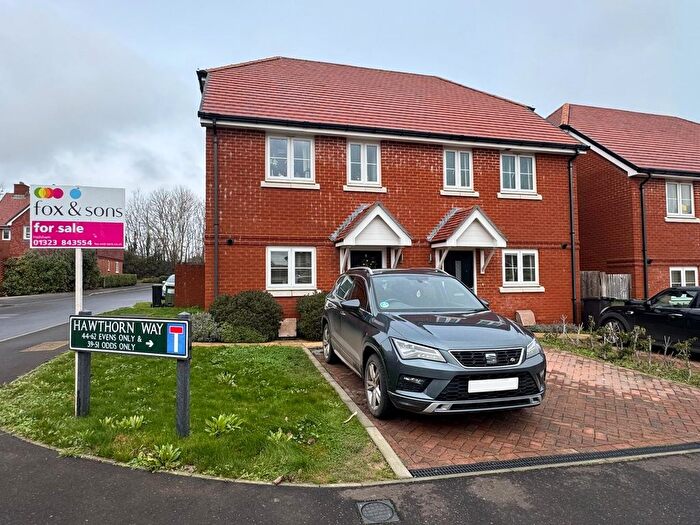
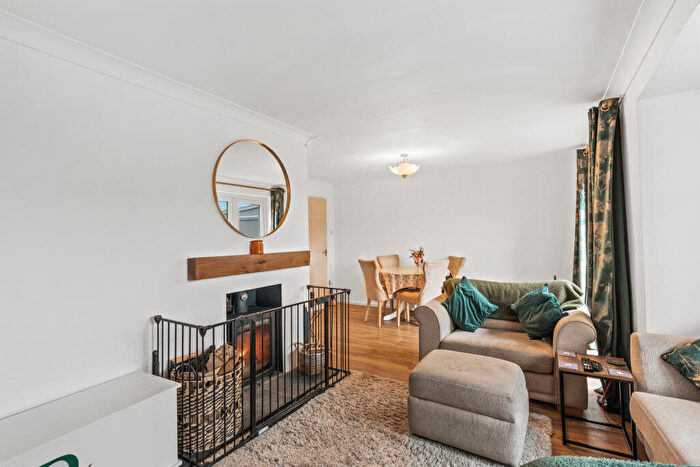
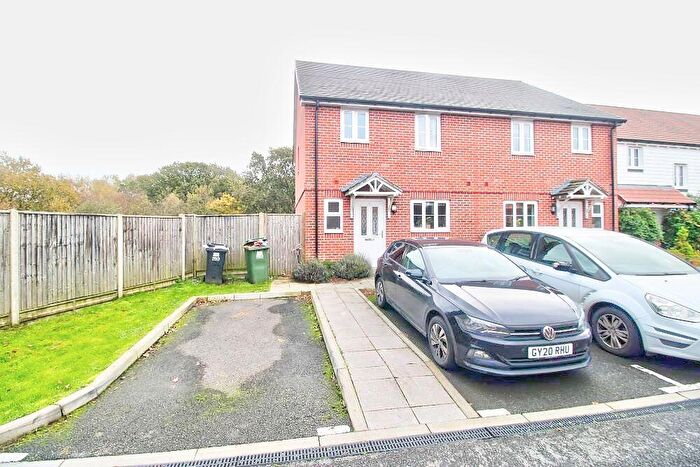
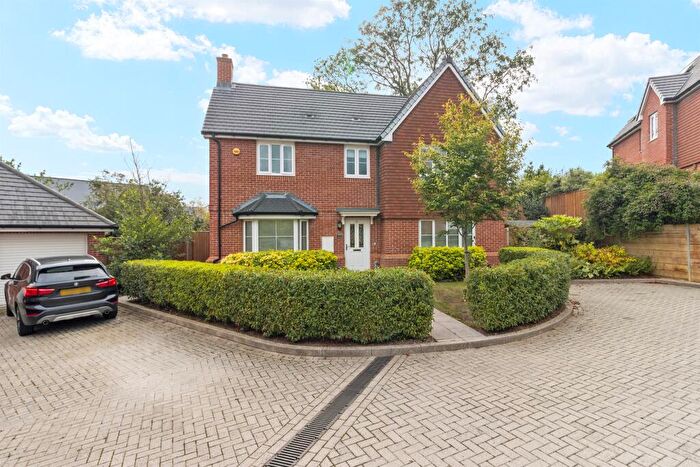
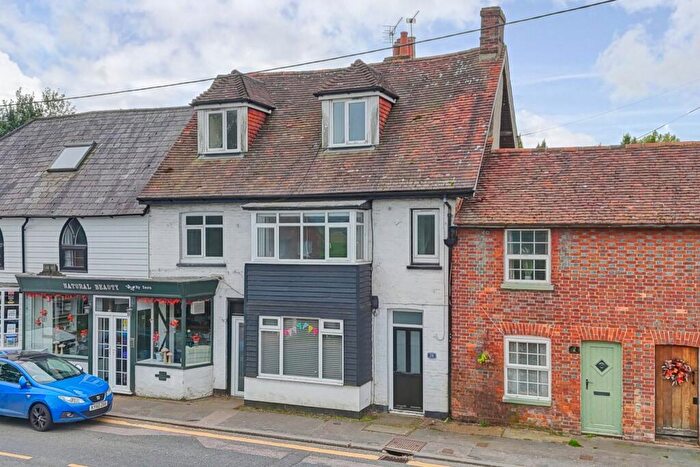
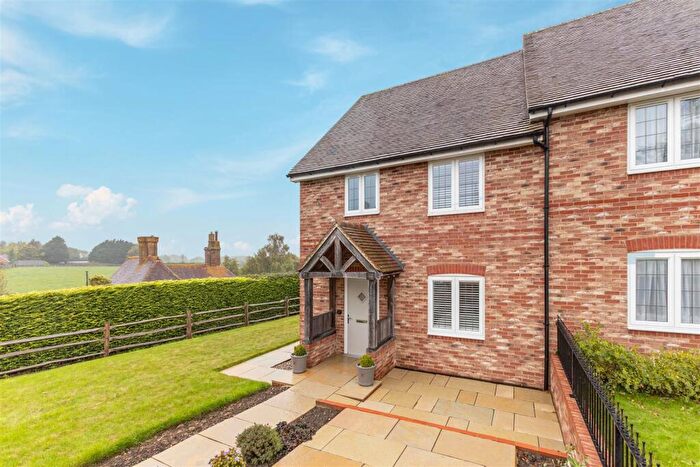
Houses for sale & to rent in Herstmonceux, Hailsham
House Prices in Herstmonceux
Properties in Herstmonceux have an average house price of £479,340.00 and had 178 Property Transactions within the last 3 years¹.
Herstmonceux is an area in Hailsham, East Sussex with 1,136 households², where the most expensive property was sold for £1,725,000.00.
Properties for sale in Herstmonceux
Roads and Postcodes in Herstmonceux
Navigate through our locations to find the location of your next house in Herstmonceux, Hailsham for sale or to rent.
Transport near Herstmonceux
-
Pevensey Bay Station
-
Pevensey and Westham Station
-
Normans Bay Station
-
Polegate Station
-
Cooden Beach Station
-
Hampden Park Station
-
Collington Station
-
Bexhill Station
-
Battle Station
-
Berwick (Sussex) Station
- FAQ
- Price Paid By Year
- Property Type Price
Frequently asked questions about Herstmonceux
What is the average price for a property for sale in Herstmonceux?
The average price for a property for sale in Herstmonceux is £479,340. This amount is 35% higher than the average price in Hailsham. There are 599 property listings for sale in Herstmonceux.
What streets have the most expensive properties for sale in Herstmonceux?
The streets with the most expensive properties for sale in Herstmonceux are Chilsham Lane at an average of £951,250, Bodle Street Green at an average of £950,000 and Bodle Street at an average of £870,000.
What streets have the most affordable properties for sale in Herstmonceux?
The streets with the most affordable properties for sale in Herstmonceux are Buckwell Rise at an average of £271,812, James Avenue at an average of £275,750 and Fairlawns Drive at an average of £276,875.
Which train stations are available in or near Herstmonceux?
Some of the train stations available in or near Herstmonceux are Pevensey Bay, Pevensey and Westham and Normans Bay.
Property Price Paid in Herstmonceux by Year
The average sold property price by year was:
| Year | Average Sold Price | Price Change |
Sold Properties
|
|---|---|---|---|
| 2025 | £425,203 | -14% |
32 Properties |
| 2024 | £483,822 | 0,3% |
48 Properties |
| 2023 | £482,256 | -4% |
37 Properties |
| 2022 | £502,446 | 15% |
61 Properties |
| 2021 | £428,139 | 8% |
66 Properties |
| 2020 | £392,045 | 13% |
52 Properties |
| 2019 | £340,486 | 10% |
37 Properties |
| 2018 | £305,010 | -9% |
50 Properties |
| 2017 | £333,897 | 3% |
41 Properties |
| 2016 | £323,037 | 15% |
54 Properties |
| 2015 | £276,086 | -9% |
45 Properties |
| 2014 | £300,210 | 9% |
42 Properties |
| 2013 | £271,932 | 1% |
43 Properties |
| 2012 | £269,907 | -23% |
41 Properties |
| 2011 | £333,209 | -1% |
38 Properties |
| 2010 | £335,284 | 17% |
36 Properties |
| 2009 | £279,394 | 3% |
27 Properties |
| 2008 | £270,031 | 6% |
31 Properties |
| 2007 | £253,151 | -11% |
78 Properties |
| 2006 | £280,315 | -1% |
70 Properties |
| 2005 | £283,964 | 12% |
46 Properties |
| 2004 | £248,999 | 3% |
65 Properties |
| 2003 | £241,571 | 15% |
48 Properties |
| 2002 | £205,458 | 25% |
67 Properties |
| 2001 | £155,076 | 24% |
56 Properties |
| 2000 | £117,865 | -17% |
56 Properties |
| 1999 | £137,517 | 26% |
68 Properties |
| 1998 | £102,123 | 12% |
56 Properties |
| 1997 | £90,093 | 17% |
62 Properties |
| 1996 | £74,645 | -30% |
40 Properties |
| 1995 | £97,215 | - |
64 Properties |
Property Price per Property Type in Herstmonceux
Here you can find historic sold price data in order to help with your property search.
The average Property Paid Price for specific property types in the last three years are:
| Property Type | Average Sold Price | Sold Properties |
|---|---|---|
| Semi Detached House | £378,349.00 | 58 Semi Detached Houses |
| Detached House | £666,127.00 | 74 Detached Houses |
| Terraced House | £358,983.00 | 31 Terraced Houses |
| Flat | £197,100.00 | 15 Flats |

