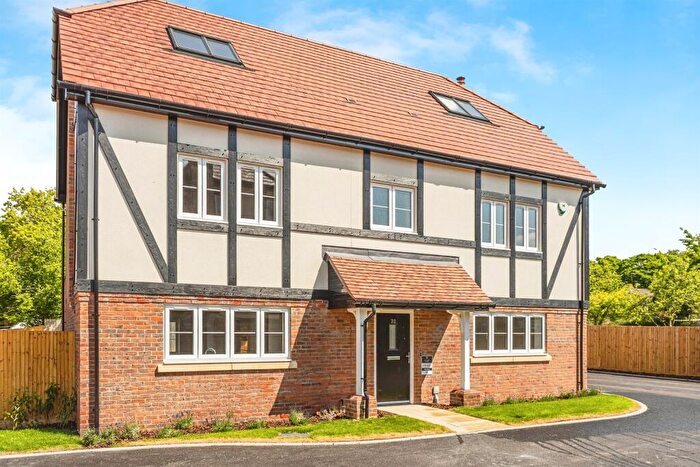
Houses for sale & to rent in Ditchling And Westmeston, Hassocks
House Prices in Ditchling And Westmeston
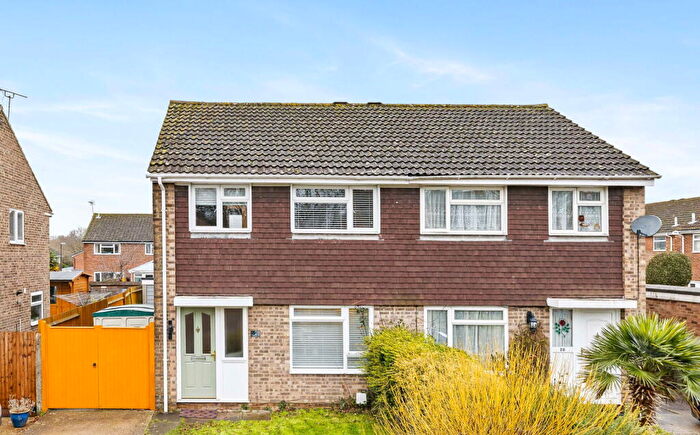
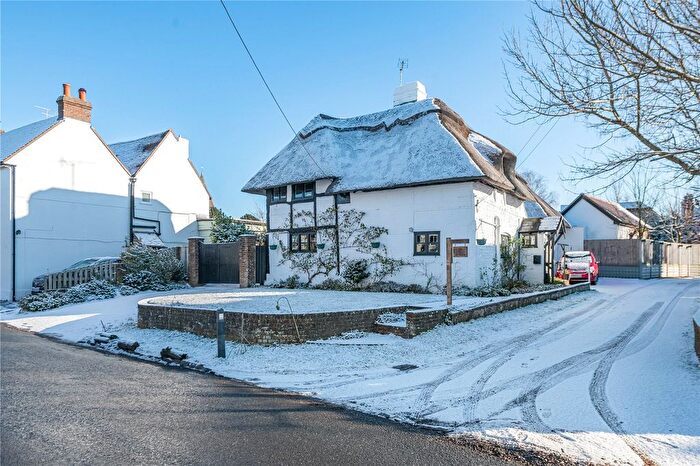
Properties in Ditchling And Westmeston have an average house price of £889,270.00 and had 82 Property Transactions within the last 3 years¹.
Ditchling And Westmeston is an area in Hassocks, East Sussex with 812 households², where the most expensive property was sold for £3,250,000.00.
Properties for sale in Ditchling And Westmeston
Roads and Postcodes in Ditchling And Westmeston
Navigate through our locations to find the location of your next house in Ditchling And Westmeston, Hassocks for sale or to rent.
| Streets | Postcodes |
|---|---|
| Barnfield Gardens | BN6 8UE |
| Beacon Road | BN6 8UL BN6 8UZ BN6 8XB |
| Boddingtons Lane | BN6 8SS |
| Brangwyns Acre | BN6 8UG |
| Charlton Gardens | BN6 8WA |
| Church Lane | BN6 8TB |
| Clayton Road | BN6 8UY |
| Common Lane | BN6 8TJ BN6 8TN |
| Ditchling Common | BN6 8SF BN6 8SG BN6 8TP BN6 8XN |
| Dumbrells Court Road | BN6 8GT |
| East End Lane | BN6 8SX BN6 8UP BN6 8UR |
| East Gardens | BN6 8ST |
| Emett Gardens | BN6 8FB |
| Farm Lane | BN6 8UN |
| Fieldway | BN6 8UA |
| High Street | BN6 8SY BN6 8TA |
| Hundred Acre Lane | BN6 8SH |
| Lewes Road | BN6 8RH BN6 8RL BN6 8TT BN6 8TU BN6 8TY BN6 8TZ |
| Lodge Hill Lane | BN6 8SP BN6 8SR |
| Long Park Corner | BN6 8UX |
| Mulberry Lane | BN6 8UH |
| Nevill Cottages | BN6 8UT |
| North End | BN6 8TD BN6 8TE BN6 8TF BN6 8TG |
| Orchard Lane | BN6 8TH |
| Shirleys | BN6 8UD |
| South Street | BN6 8UQ |
| Southview | BN6 8TQ |
| Spatham Lane | BN6 8XH BN6 8XJ BN6 8XL |
| St Helena Lane | BN6 8SD |
| Streat Lane | BN6 8RU |
| The Drove | BN6 8TR |
| The Dymocks | BN6 8SU |
| The Potteries | BN6 8SJ |
| The Street | BN6 8RJ |
| The Twitten | BN6 8UJ |
| Underhill Lane | BN6 8XE BN6 8XG |
| Upper Beacon Road | BN6 8XD |
| West Street | BN6 8TS |
Transport near Ditchling And Westmeston
- FAQ
- Price Paid By Year
- Property Type Price
Frequently asked questions about Ditchling And Westmeston
What is the average price for a property for sale in Ditchling And Westmeston?
The average price for a property for sale in Ditchling And Westmeston is £889,270. This amount is 2% lower than the average price in Hassocks. There are 408 property listings for sale in Ditchling And Westmeston.
What streets have the most expensive properties for sale in Ditchling And Westmeston?
The streets with the most expensive properties for sale in Ditchling And Westmeston are Underhill Lane at an average of £3,250,000, West Street at an average of £2,041,970 and Common Lane at an average of £1,558,000.
What streets have the most affordable properties for sale in Ditchling And Westmeston?
The streets with the most affordable properties for sale in Ditchling And Westmeston are Nevill Cottages at an average of £396,666, North End at an average of £477,875 and Southview at an average of £500,000.
Which train stations are available in or near Ditchling And Westmeston?
Some of the train stations available in or near Ditchling And Westmeston are Hassocks, Plumpton and Burgess Hill.
Property Price Paid in Ditchling And Westmeston by Year
The average sold property price by year was:
| Year | Average Sold Price | Price Change |
Sold Properties
|
|---|---|---|---|
| 2025 | £981,979 | 11% |
11 Properties |
| 2024 | £878,459 | -0,1% |
26 Properties |
| 2023 | £879,603 | 2% |
23 Properties |
| 2022 | £865,797 | 5% |
22 Properties |
| 2021 | £819,771 | 8% |
42 Properties |
| 2020 | £755,511 | -12% |
27 Properties |
| 2019 | £846,306 | 15% |
22 Properties |
| 2018 | £719,837 | -2% |
40 Properties |
| 2017 | £736,255 | 15% |
20 Properties |
| 2016 | £622,451 | -7% |
26 Properties |
| 2015 | £663,578 | 7% |
30 Properties |
| 2014 | £619,511 | -11% |
34 Properties |
| 2013 | £684,999 | 3% |
42 Properties |
| 2012 | £665,412 | -6% |
24 Properties |
| 2011 | £703,625 | 20% |
20 Properties |
| 2010 | £559,677 | -6% |
26 Properties |
| 2009 | £592,740 | 12% |
25 Properties |
| 2008 | £523,805 | 13% |
17 Properties |
| 2007 | £458,121 | 5% |
40 Properties |
| 2006 | £437,377 | 18% |
33 Properties |
| 2005 | £358,906 | -20% |
33 Properties |
| 2004 | £429,248 | 21% |
42 Properties |
| 2003 | £339,450 | -1% |
31 Properties |
| 2002 | £343,351 | 12% |
27 Properties |
| 2001 | £301,694 | -3% |
36 Properties |
| 2000 | £310,110 | 31% |
37 Properties |
| 1999 | £214,499 | 17% |
44 Properties |
| 1998 | £177,544 | -1% |
41 Properties |
| 1997 | £179,805 | 8% |
26 Properties |
| 1996 | £164,917 | 10% |
34 Properties |
| 1995 | £148,312 | - |
36 Properties |
Property Price per Property Type in Ditchling And Westmeston
Here you can find historic sold price data in order to help with your property search.
The average Property Paid Price for specific property types in the last three years are:
| Property Type | Average Sold Price | Sold Properties |
|---|---|---|
| Semi Detached House | £690,992.00 | 19 Semi Detached Houses |
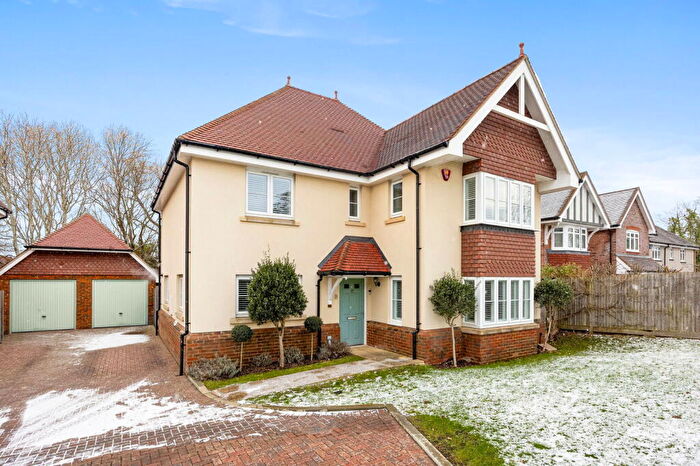
| Detached House | £1,190,973.00 | 43 Detached Houses |
| Terraced House | £481,296.00 | 15 Terraced Houses |
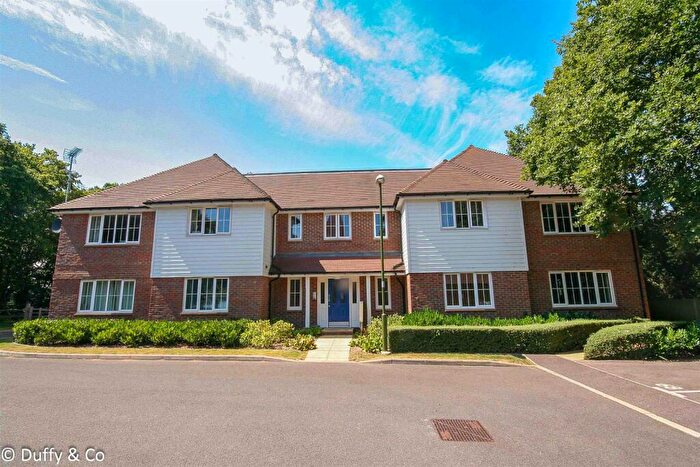
| Flat | £272,000.00 | 5 Flats |

