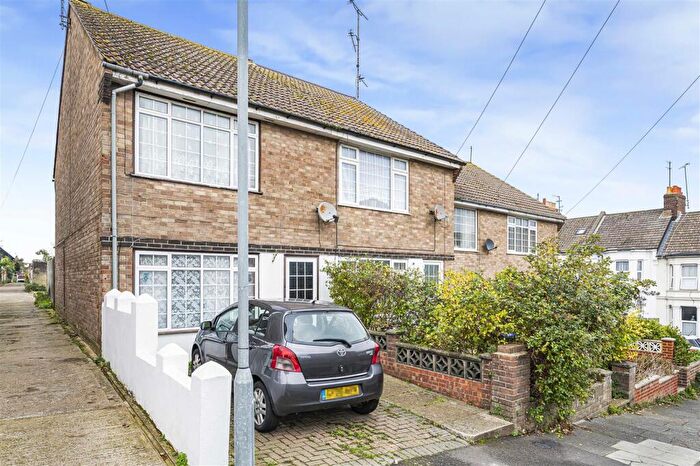
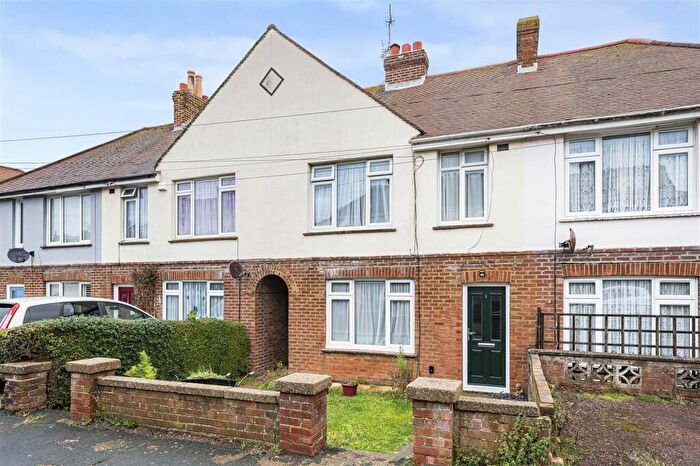
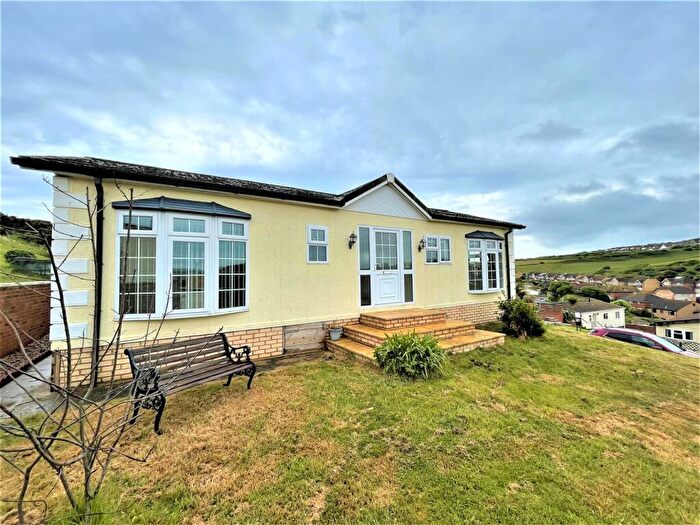
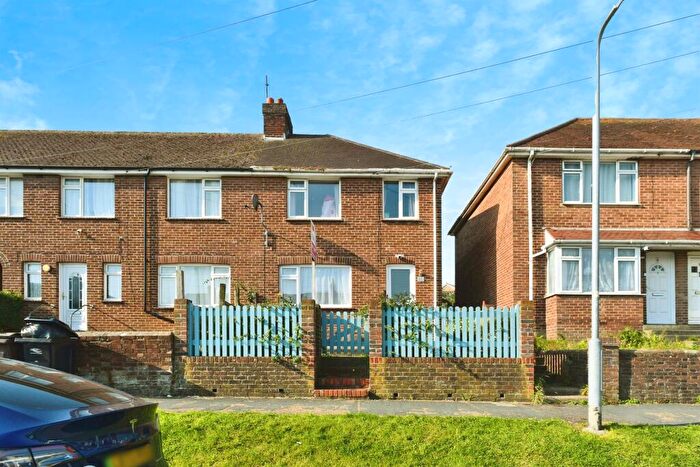
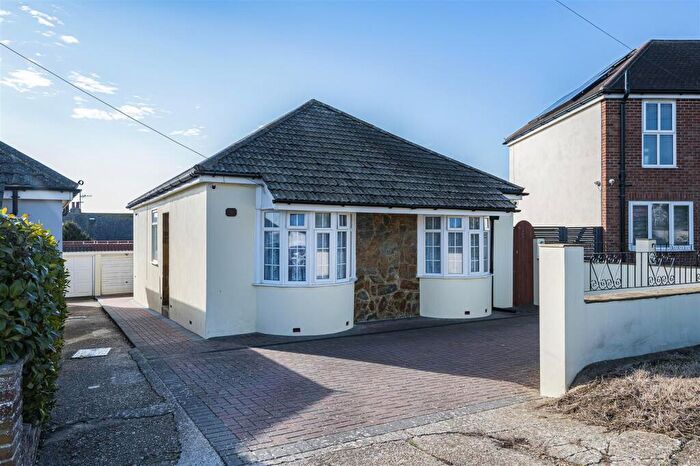
Houses for sale & to rent in Newhaven South, Newhaven
House Prices in Newhaven South
Properties in Newhaven South have an average house price of £279,438.00 and had 9 Property Transactions within the last 3 years¹.
Newhaven South is an area in Newhaven, East Sussex with 350 households², where the most expensive property was sold for £380,000.00.
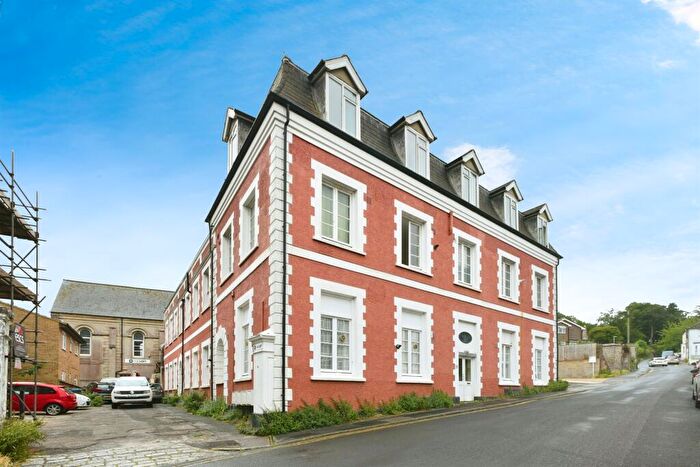
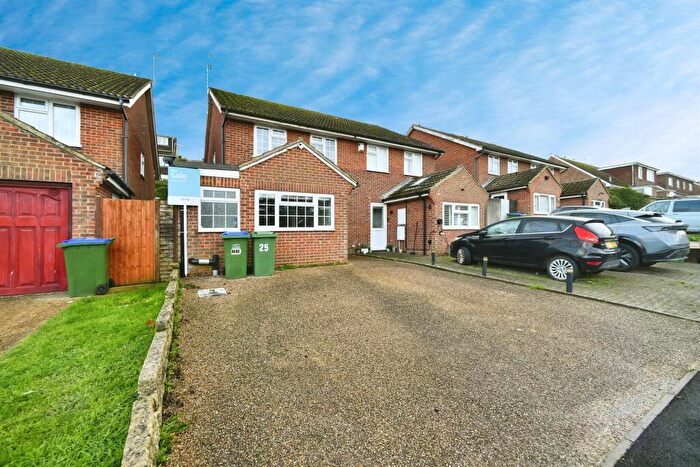
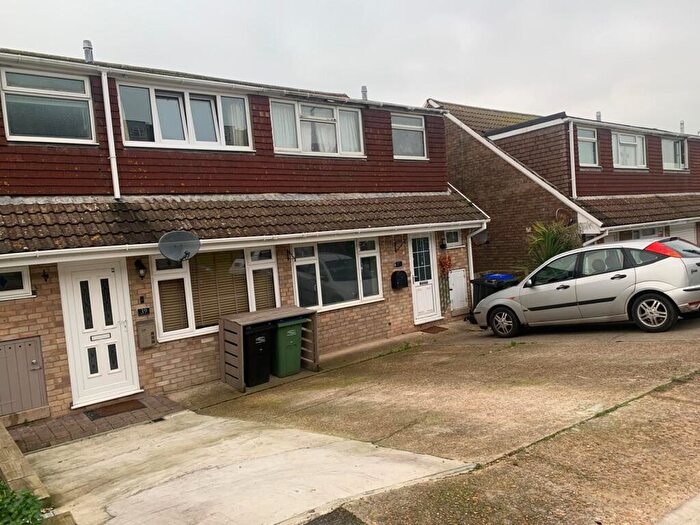
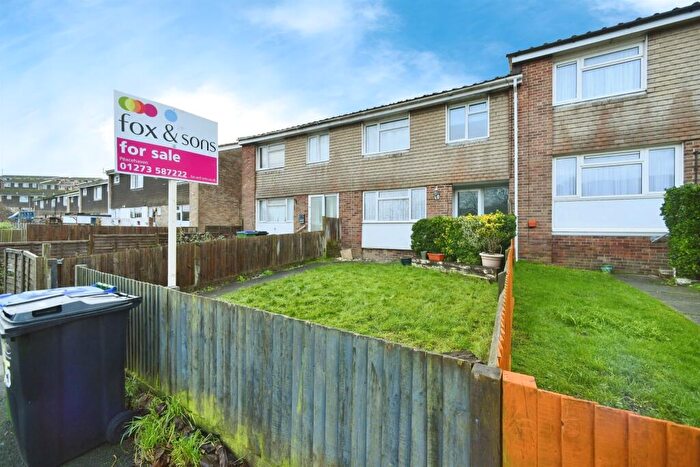
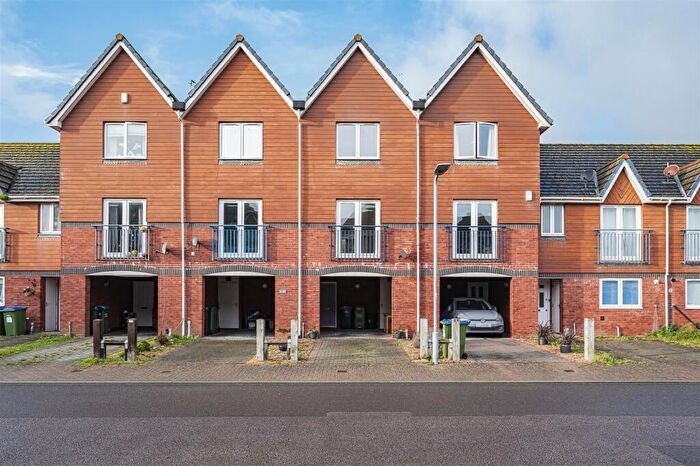
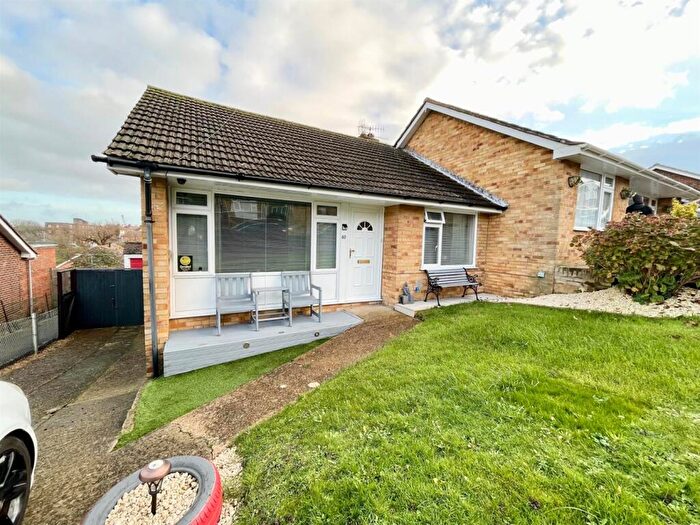
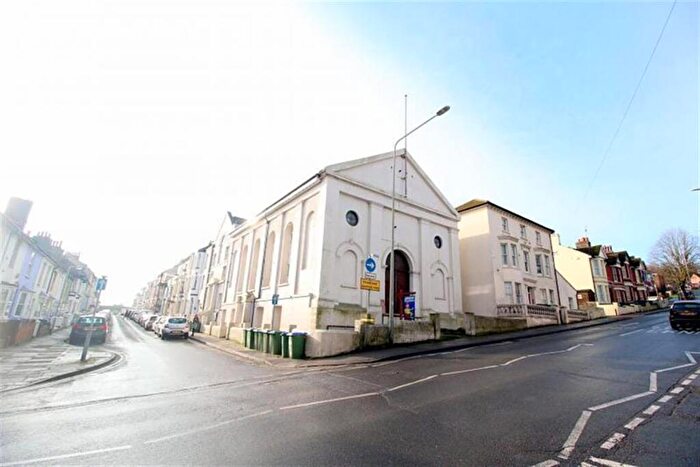
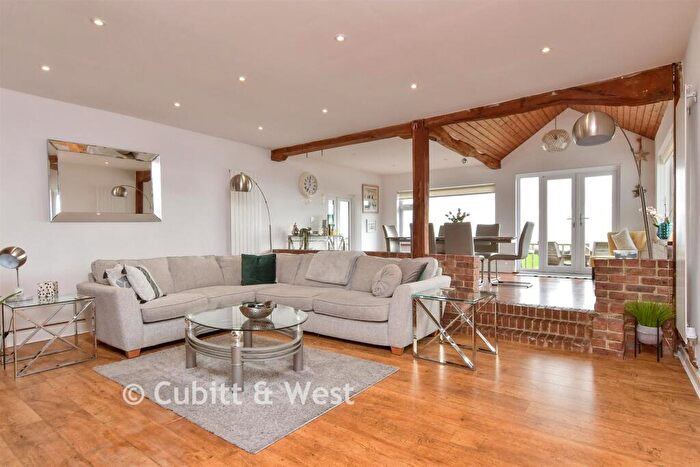
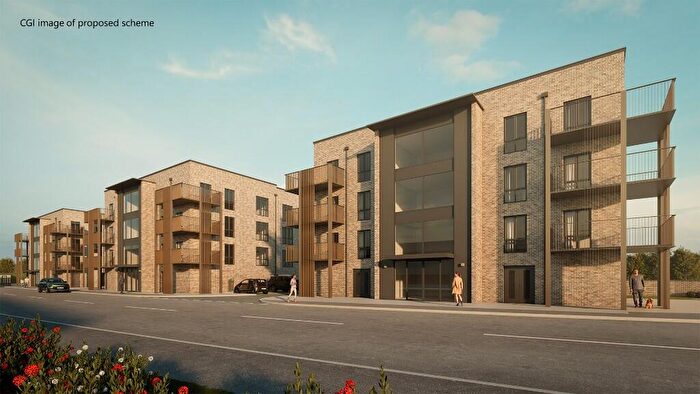
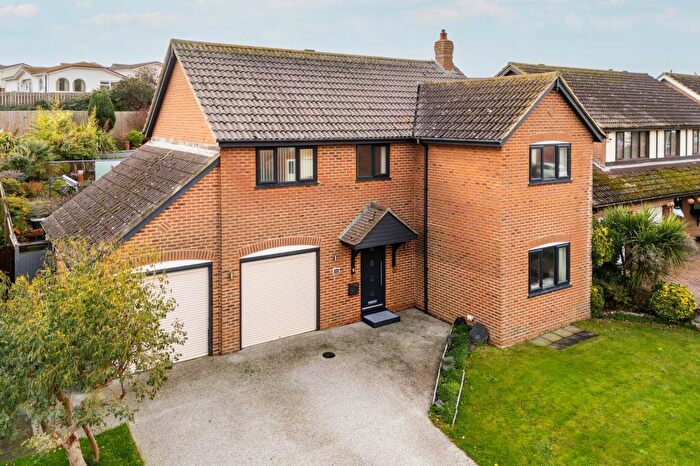
Properties for sale in Newhaven South
Roads and Postcodes in Newhaven South
Navigate through our locations to find the location of your next house in Newhaven South, Newhaven for sale or to rent.
| Streets | Postcodes |
|---|---|
| Newfield Road | BN9 9NE |
| Arrow Lane | BN9 0FG BN9 0FL |
| Artex Avenue | BN9 9DD |
| Beach Close | BN9 0BY BN9 0FP |
| Beach Road | BN9 0BX BN9 0FB |
| Brighton Road | BN9 9UG |
| Chapel Street | BN9 9PW |
| Charlston Avenue | BN9 9UB |
| Church Hill | BN9 9FJ |
| Cuckmere Road | BN9 9UA |
| Dacre Road | BN9 9FA |
| Drove Road | BN9 0AD |
| East Quay | BN9 0BH BN9 0BN |
| Estate Road | BN9 0AL |
| Ferryfield Industrial Estate | BN9 0JF |
| Fort Road | BN9 9DA BN9 9DL BN9 9QQ BN9 9FH |
| Fountain Row | BN9 0FF |
| High Street | BN9 9PD BN9 9PQ BN9 9PU BN9 9QU |
| Hillcrest Road | BN9 9FB |
| Lewes Road | BN9 9RT BN9 9RZ |
| Lorraine Road | BN9 9QB |
| Lower Place | BN9 9BH |
| Mckinley Way | BN9 0FA |
| Neills Close | BN9 9LF |
| Newhaven Fort | BN9 9DS |
| Newhaven Heights | BN9 9HD BN9 9HE BN9 9HF |
| Newhaven Square | BN9 9QS |
| Nore Road | BN9 9TL |
| North Lane | BN9 9BF |
| Norton Road | BN9 0BZ BN9 0EW BN9 0FN |
| Parker Drive | BN9 0FD BN9 0FH BN9 0FJ |
| Pevensey Road | BN9 9TU |
| Port Offices | BN9 0BG |
| Quarry Road | BN9 9DB BN9 9DG |
| Railway Approach | BN9 0BD BN9 0DF |
| Railway Quay | BN9 0ER |
| Railway Road | BN9 0AA BN9 0AP BN9 0AY |
| Riverside | BN9 9BG BN9 9BQ |
| Seaford Road | BN9 0EF |
| Sonnet Way | BN9 0FE |
| Southdown Road | BN9 9FD BN9 9JG BN9 9JL |
| The Drive | BN9 9DJ |
| The Drove | BN9 0LA |
| The Highway | BN9 9TP |
| Union Close | BN9 9LZ BN9 9NZ |
| West Pier | BN9 9DN |
| West Quay | BN9 9BP BN9 9BT BN9 9BX BN9 9BY BN9 9GB |
| Western Road | BN9 9JU |
| BN9 1AG BN9 1AJ BN9 1AX BN9 1AY BN9 1BJ BN9 1BP BN9 1BR BN9 1BS BN9 9FE BN9 9WE BN9 9WZ BN9 1BU BN9 1BX |
Transport near Newhaven South
-
Newhaven Harbour Station
-
Newhaven Town Station
-
Bishopstone Station
-
Seaford Station
-
Southease Station
- FAQ
- Price Paid By Year
- Property Type Price
Frequently asked questions about Newhaven South
What is the average price for a property for sale in Newhaven South?
The average price for a property for sale in Newhaven South is £279,438. This amount is 8% lower than the average price in Newhaven. There are 998 property listings for sale in Newhaven South.
Which train stations are available in or near Newhaven South?
Some of the train stations available in or near Newhaven South are Newhaven Harbour, Newhaven Town and Bishopstone.
Property Price Paid in Newhaven South by Year
The average sold property price by year was:
| Year | Average Sold Price | Price Change |
Sold Properties
|
|---|---|---|---|
| 2025 | £300,000 | 18% |
3 Properties |
| 2024 | £247,500 | 16% |
2 Properties |
| 2023 | £207,475 | -70% |
2 Properties |
| 2022 | £352,500 | 6% |
2 Properties |
| 2021 | £331,350 | -2% |
11 Properties |
| 2020 | £338,931 | 41% |
8 Properties |
| 2019 | £198,500 | -18% |
1 Property |
| 2018 | £234,950 | -6% |
1 Property |
| 2017 | £250,000 | 10% |
1 Property |
| 2016 | £225,000 | 10% |
1 Property |
| 2015 | £201,763 | 62% |
19 Properties |
| 2011 | £77,000 | -1% |
1 Property |
| 2008 | £78,000 | -117% |
1 Property |
| 2007 | £169,000 | 46% |
3 Properties |
| 2003 | £91,000 | 31% |
2 Properties |
| 2001 | £63,000 | 16% |
2 Properties |
| 1999 | £52,750 | 62% |
2 Properties |
| 1998 | £20,000 | - |
1 Property |
Property Price per Property Type in Newhaven South
Here you can find historic sold price data in order to help with your property search.
The average Property Paid Price for specific property types in the last three years are:
| Property Type | Average Sold Price | Sold Properties |
|---|---|---|
| Semi Detached House | £325,000.00 | 3 Semi Detached Houses |
| Flat | £232,990.00 | 5 Flats |
| Detached House | £375,000.00 | 1 Detached House |

