
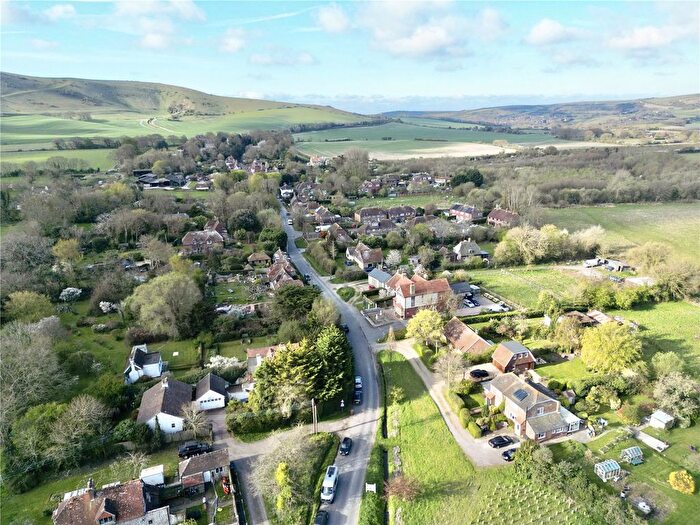
Houses for sale & to rent in Hellingly, Polegate
House Prices in Hellingly
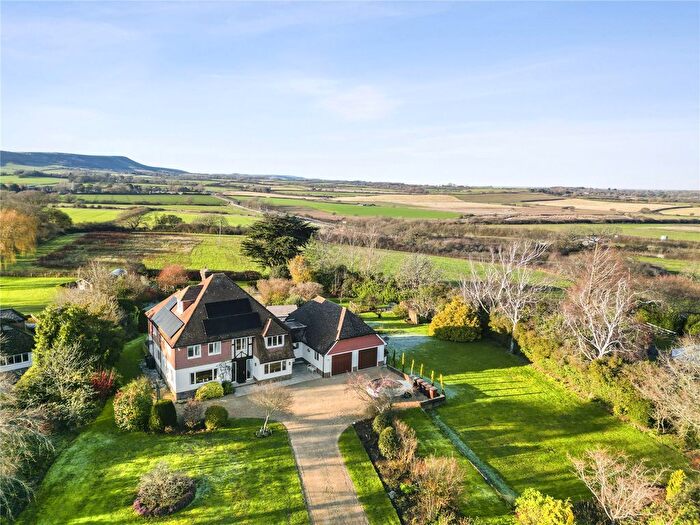
Properties in Hellingly have an average house price of £613k and had 2 Property Transactions within the last 3 years¹.
Hellingly is an area in Polegate, East Sussex with 64 households², where the most expensive property was sold for £725k.
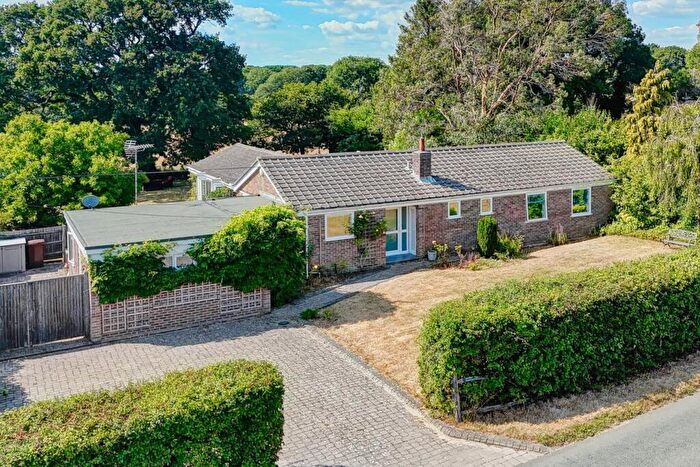
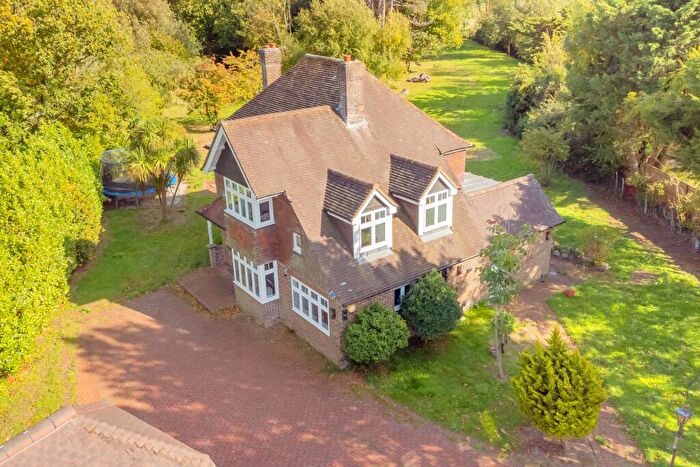
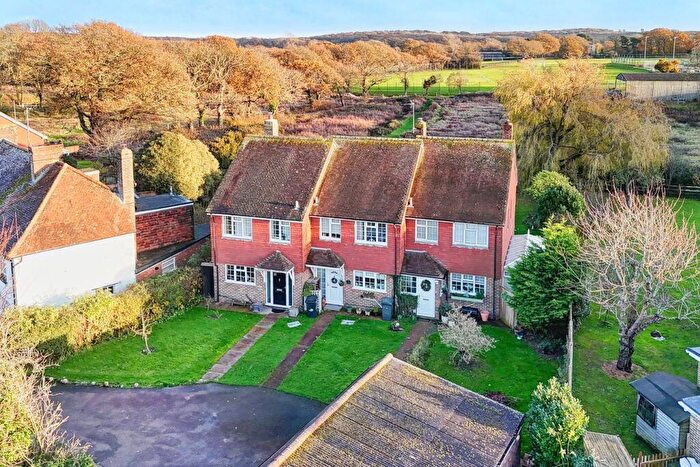
Properties for sale in Hellingly
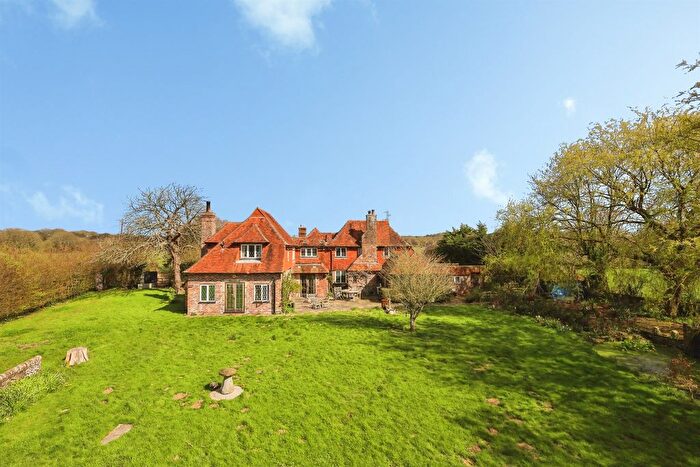
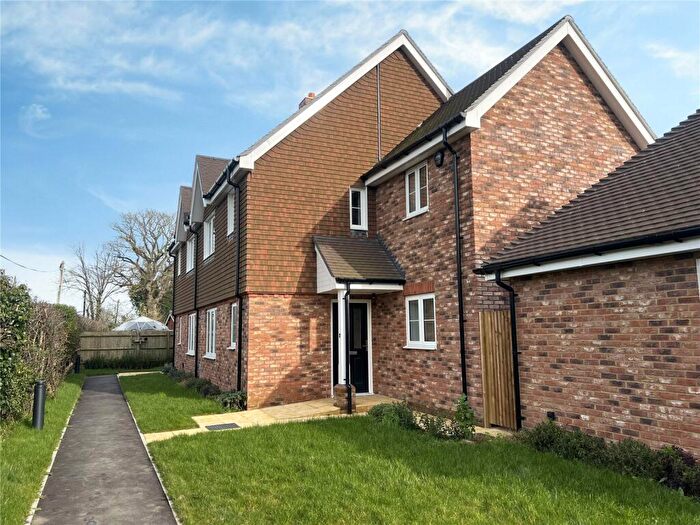
![]()
If you are looking to sell your house, let it out, or receive a property valuation, an expert can help you.
Click the button below to get started.


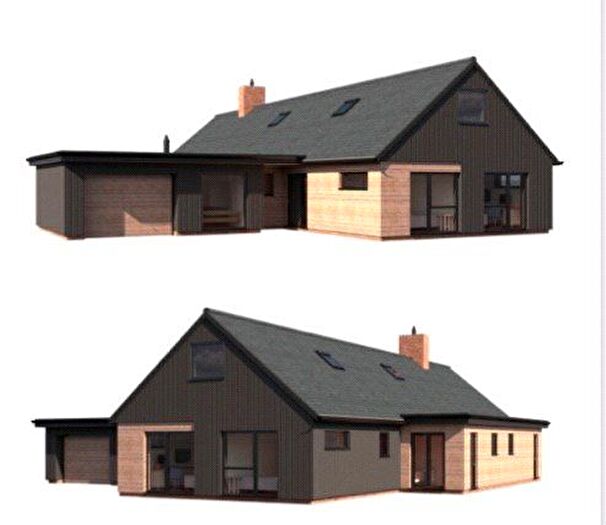
Previously listed properties in Hellingly
Roads and Postcodes in Hellingly
Navigate through our locations to find the location of your next house in Hellingly, Polegate for sale or to rent.
| Streets | Postcodes |
|---|---|
| Station Road | BN26 6TF |
| The Street | BN26 6RX BN26 6RY BN26 6SE |
| Tye Hill Lane | BN26 6SF |
| Tye Hill Road | BN26 6SG BN26 6SH |
| Waterworks Cottages | BN26 6UX |
| Wilbees Road | BN26 6RU |
| BN26 6SJ BN26 6SL BN26 6TN |
Transport near Hellingly
-
 Berwick (Sussex) Station
 -
Polegate Station
-
Hampden Park Station
-
Glynde Station
-
Pevensey and Westham Station
-
Seaford Station
-
Eastbourne Station
-
Bishopstone Station
-
Pevensey Bay Station
-
Newhaven Town Station
- FAQ
- Price Paid By Year
- Property Type Price
Frequently asked questions about Hellingly
What is the average price for a property for sale in Hellingly?
The average price for a property for sale in Hellingly is £612,500. This amount is 64% higher than the average price in Polegate. There are 110 property listings for sale in Hellingly.
Which train stations are available in or near Hellingly?
Some of the train stations available in or near Hellingly are Berwick (Sussex), Polegate and Hampden Park.
Property Price Paid in Hellingly by Year
The average sold property price by year was:
| Year | Average Sold Price | Price Change |
Sold Properties
|
|---|---|---|---|
| 2024 | £500,000 | -45% |
1 Property |
| 2023 | £725,000 | 32% |
1 Property |
| 2022 | £490,000 | -49% |
2 Properties |
| 2021 | £732,500 | 34% |
5 Properties |
| 2020 | £485,000 | -15% |
1 Property |
| 2019 | £560,000 | -76% |
1 Property |
| 2018 | £985,000 | 37% |
2 Properties |
| 2017 | £620,000 | 11% |
1 Property |
| 2016 | £550,000 | 27% |
2 Properties |
| 2015 | £400,000 | -21% |
1 Property |
| 2014 | £482,333 | 16% |
3 Properties |
| 2013 | £405,000 | -23% |
5 Properties |
| 2012 | £500,000 | 15% |
3 Properties |
| 2011 | £427,500 | -11% |
1 Property |
| 2010 | £475,000 | 39% |
1 Property |
| 2008 | £290,000 | -52% |
1 Property |
| 2007 | £440,000 | 21% |
1 Property |
| 2006 | £349,400 | -55% |
5 Properties |
| 2005 | £540,000 | 1% |
1 Property |
| 2004 | £534,000 | 30% |
3 Properties |
| 2003 | £376,250 | -23% |
2 Properties |
| 2002 | £462,500 | 52% |
2 Properties |
| 2001 | £222,916 | -10% |
3 Properties |
| 2000 | £245,357 | 37% |
7 Properties |
| 1999 | £153,400 | -12% |
3 Properties |
| 1998 | £171,500 | 38% |
2 Properties |
| 1997 | £106,000 | -8% |
2 Properties |
| 1996 | £115,000 | -34% |
1 Property |
| 1995 | £154,500 | - |
3 Properties |
Property Price per Property Type in Hellingly
Here you can find historic sold price data in order to help with your property search.
The average Property Paid Price for specific property types in the last three years are:
| Property Type | Average Sold Price | Sold Properties |
|---|---|---|
| Semi Detached House | £725,000.00 | 1 Semi Detached House |
| Detached House | £500,000.00 | 1 Detached House |