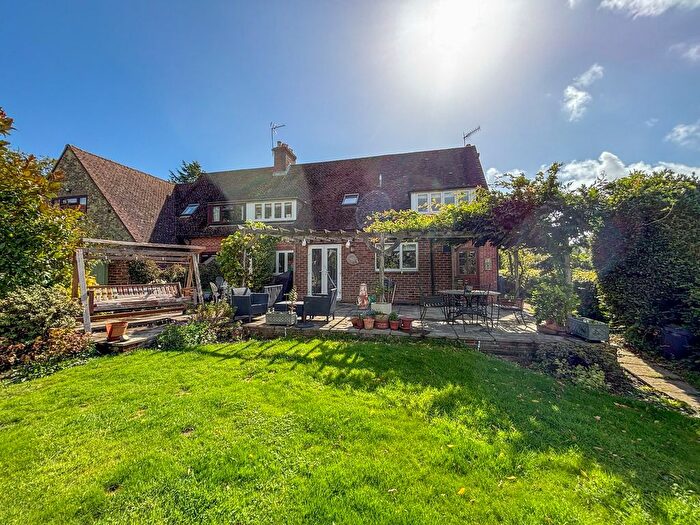
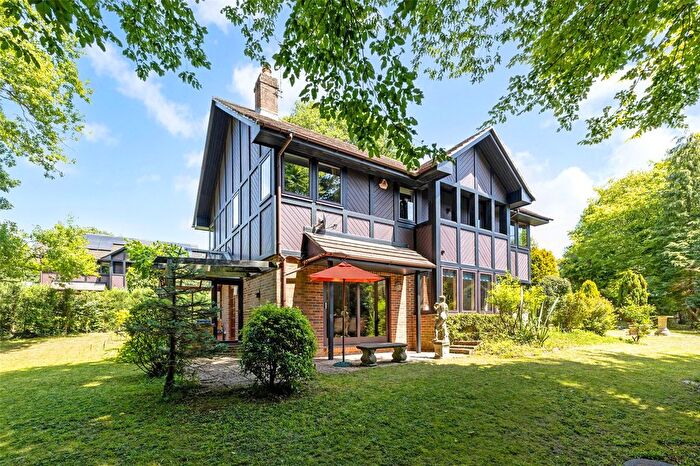
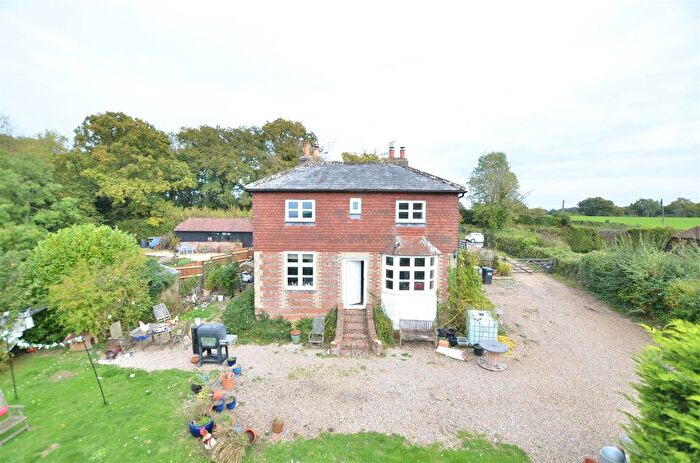
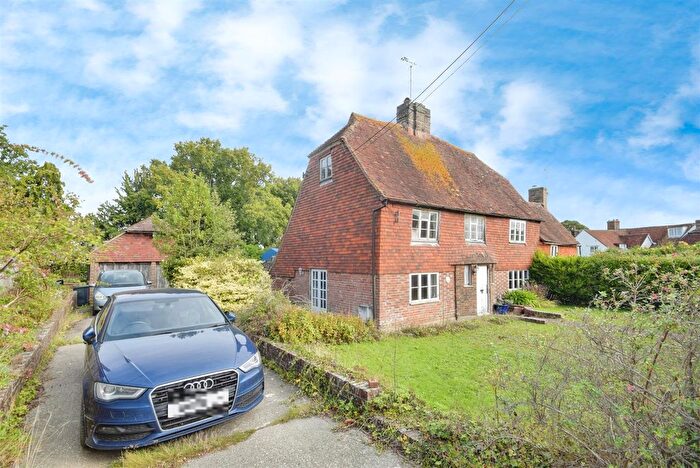
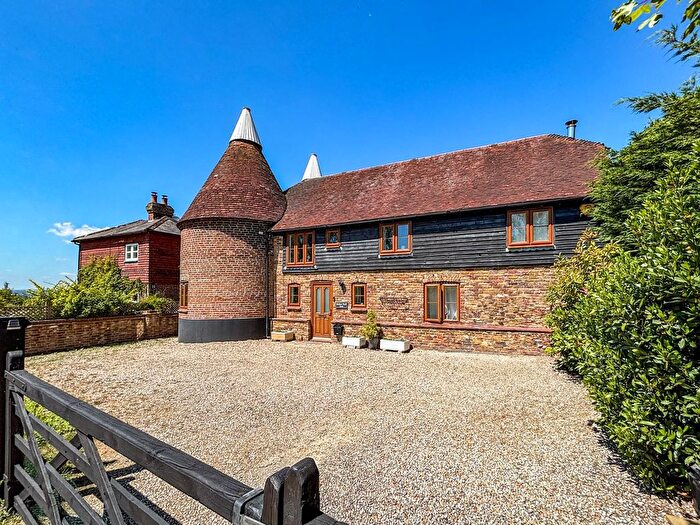
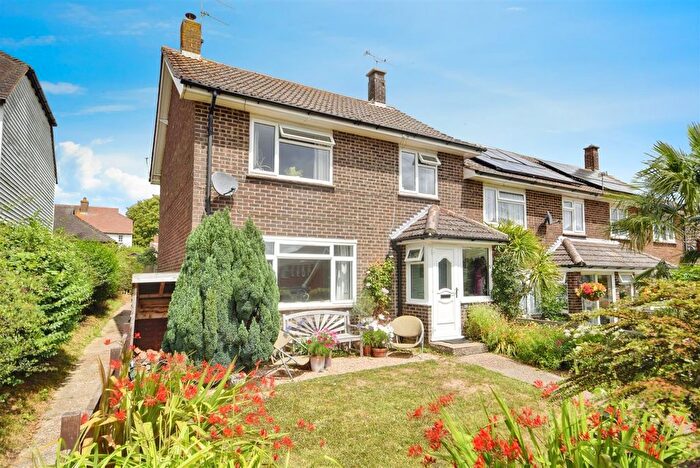
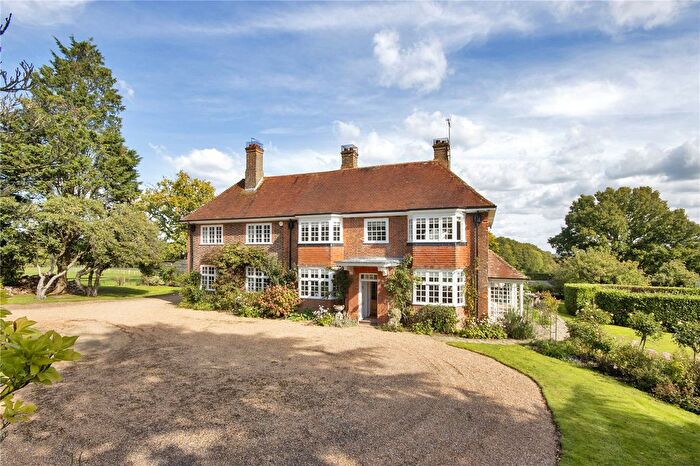
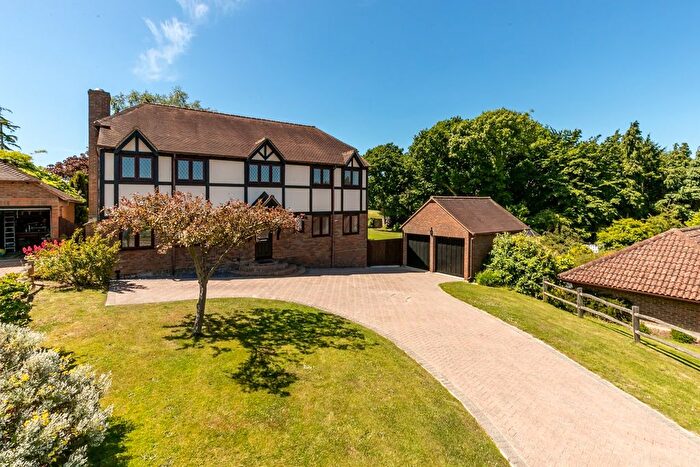
Houses for sale & to rent in Ewhurst And Sedlescombe, Robertsbridge
House Prices in Ewhurst And Sedlescombe
Properties in Ewhurst And Sedlescombe have an average house price of £618,008.00 and had 47 Property Transactions within the last 3 years¹.
Ewhurst And Sedlescombe is an area in Robertsbridge, East Sussex with 480 households², where the most expensive property was sold for £2,980,000.00.
Properties for sale in Ewhurst And Sedlescombe
Previously listed properties in Ewhurst And Sedlescombe
Roads and Postcodes in Ewhurst And Sedlescombe
Navigate through our locations to find the location of your next house in Ewhurst And Sedlescombe, Robertsbridge for sale or to rent.
| Streets | Postcodes |
|---|---|
| Alma Cottages | TN32 5QB |
| Battle Road | TN32 5QT TN32 5QU |
| Beacon Lane | TN32 5QP TN32 5RX |
| Church Cottages | TN32 5TE |
| Compasses Lane | TN32 5SE |
| Cricketers Field | TN32 5QQ |
| Cripps Corner Road | TN32 5QA TN32 5QR TN32 5QS |
| Dagg Lane | TN32 5RD |
| Ellenwhorne Lane | TN32 5RS TN32 5RT |
| Ewhurst Green | TN32 5RE TN32 5RG TN32 5RJ TN32 5TA TN32 5TB TN32 5TD |
| Forge Close | TN32 5QF |
| Forge Lane | TN32 5QE |
| Hop Gardens | TN32 5BF |
| Junction Road | TN32 5SG TN32 5SH TN32 5XB |
| Lordine Court Drive | TN32 5TF |
| Lordine Lane | TN32 5TJ TN32 5TL TN32 5TR TN32 5TS |
| Mill Close | TN32 5HA |
| Northiam Road | TN32 5QG TN32 5QH TN32 5QJ TN32 5QL TN32 5QN TN32 5RP |
| Padgham Cottages | TN32 5TH |
| Poppinghole Lane | TN32 5BN TN32 5QY |
| Rock Hill | TN32 5RL |
| Sempstead Lane | TN32 5TP |
| Sheringham Close | TN32 5PZ |
| Staplecross | TN32 5QD TN32 5RY TN32 5SA |
| Stockwood Farm Cottages | TN32 5RR |
| The Tollgate | TN32 5SF |
| Weald View | TN32 5QW |
| TN32 5RA |
Transport near Ewhurst And Sedlescombe
- FAQ
- Price Paid By Year
- Property Type Price
Frequently asked questions about Ewhurst And Sedlescombe
What is the average price for a property for sale in Ewhurst And Sedlescombe?
The average price for a property for sale in Ewhurst And Sedlescombe is £618,008. This amount is 11% higher than the average price in Robertsbridge. There are 207 property listings for sale in Ewhurst And Sedlescombe.
What streets have the most expensive properties for sale in Ewhurst And Sedlescombe?
The streets with the most expensive properties for sale in Ewhurst And Sedlescombe are Ellenwhorne Lane at an average of £822,000, Weald View at an average of £800,000 and Cripps Corner Road at an average of £663,800.
What streets have the most affordable properties for sale in Ewhurst And Sedlescombe?
The streets with the most affordable properties for sale in Ewhurst And Sedlescombe are Cricketers Field at an average of £296,200, The Tollgate at an average of £311,250 and Battle Road at an average of £498,333.
Which train stations are available in or near Ewhurst And Sedlescombe?
Some of the train stations available in or near Ewhurst And Sedlescombe are Robertsbridge, Battle and Etchingham.
Property Price Paid in Ewhurst And Sedlescombe by Year
The average sold property price by year was:
| Year | Average Sold Price | Price Change |
Sold Properties
|
|---|---|---|---|
| 2025 | £597,000 | 11% |
5 Properties |
| 2024 | £530,846 | -12% |
13 Properties |
| 2023 | £594,044 | -16% |
9 Properties |
| 2022 | £690,700 | -2% |
20 Properties |
| 2021 | £702,366 | 44% |
15 Properties |
| 2020 | £396,340 | -14% |
21 Properties |
| 2019 | £453,411 | 4% |
17 Properties |
| 2018 | £435,116 | -1% |
9 Properties |
| 2017 | £441,020 | -2% |
20 Properties |
| 2016 | £449,875 | 8% |
20 Properties |
| 2015 | £414,365 | -5% |
23 Properties |
| 2014 | £435,286 | 20% |
19 Properties |
| 2013 | £347,390 | 6% |
21 Properties |
| 2012 | £328,181 | -0,3% |
11 Properties |
| 2011 | £329,166 | -5% |
6 Properties |
| 2010 | £345,464 | -24% |
14 Properties |
| 2009 | £429,285 | 18% |
7 Properties |
| 2008 | £353,436 | -11% |
11 Properties |
| 2007 | £392,065 | 3% |
22 Properties |
| 2006 | £378,495 | -10% |
22 Properties |
| 2005 | £415,535 | 33% |
14 Properties |
| 2004 | £276,656 | 11% |
26 Properties |
| 2003 | £245,084 | -3% |
23 Properties |
| 2002 | £252,291 | 25% |
43 Properties |
| 2001 | £189,312 | -21% |
33 Properties |
| 2000 | £229,924 | 37% |
34 Properties |
| 1999 | £145,009 | 6% |
26 Properties |
| 1998 | £136,820 | -11% |
17 Properties |
| 1997 | £151,657 | 19% |
27 Properties |
| 1996 | £122,553 | 6% |
15 Properties |
| 1995 | £115,291 | - |
16 Properties |
Property Price per Property Type in Ewhurst And Sedlescombe
Here you can find historic sold price data in order to help with your property search.
The average Property Paid Price for specific property types in the last three years are:
| Property Type | Average Sold Price | Sold Properties |
|---|---|---|
| Semi Detached House | £381,044.00 | 9 Semi Detached Houses |
| Detached House | £864,360.00 | 25 Detached Houses |
| Terraced House | £308,307.00 | 13 Terraced Houses |


