
Houses for sale & to rent in BN25 2RN, Hawth Rise, Seaford West, Seaford
House Prices in BN25 2RN, Hawth Rise, Seaford West
Properties in BN25 2RN have no sales history available within the last 3 years. BN25 2RN is a postcode in Hawth Rise located in Seaford West, an area in Seaford, East Sussex, with 5 households².
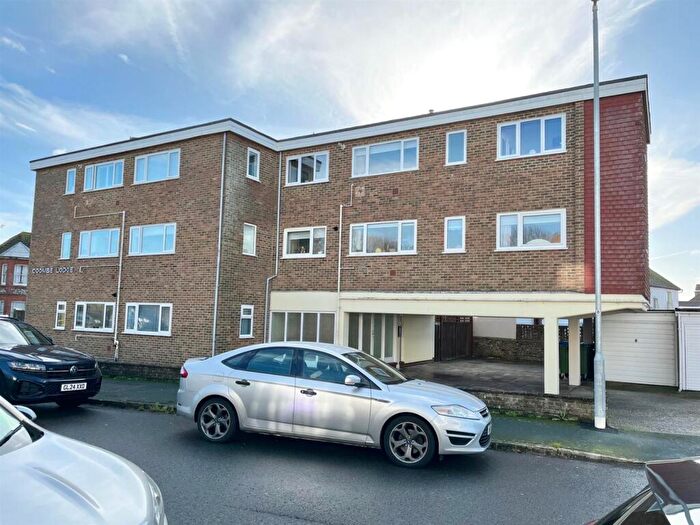
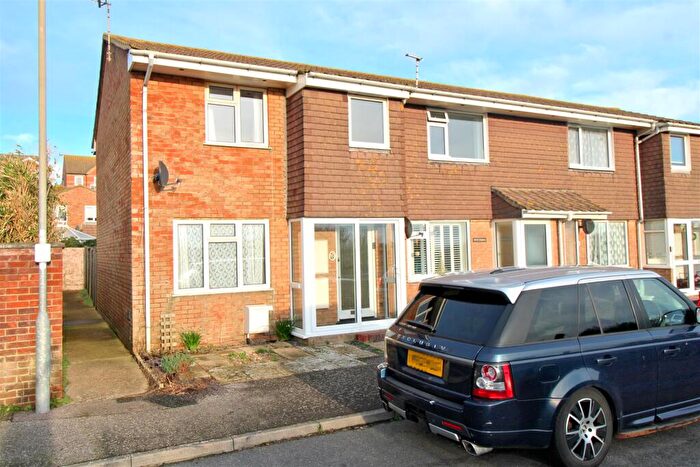
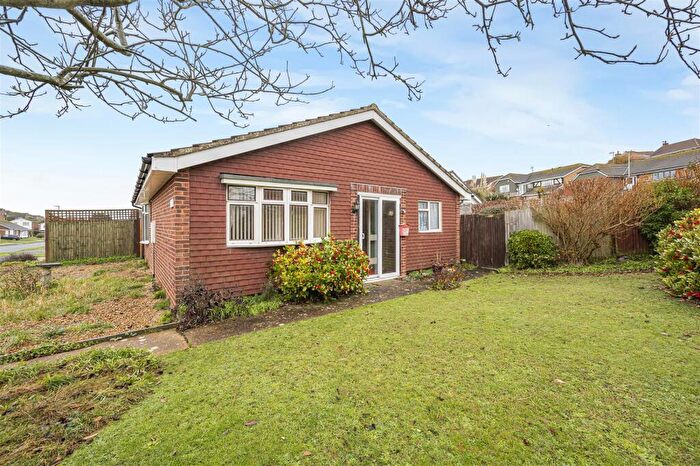
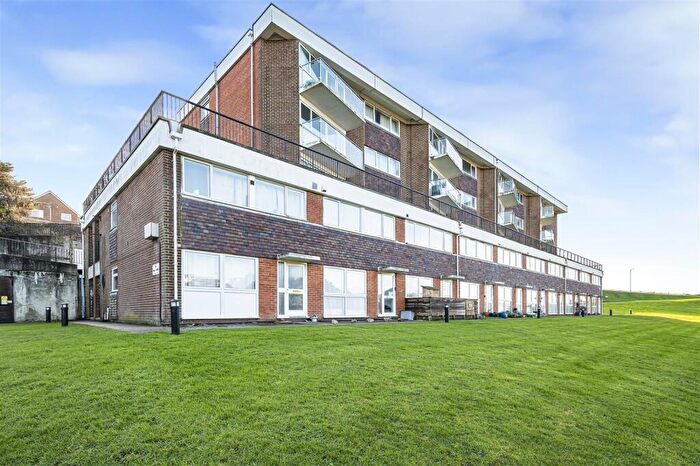
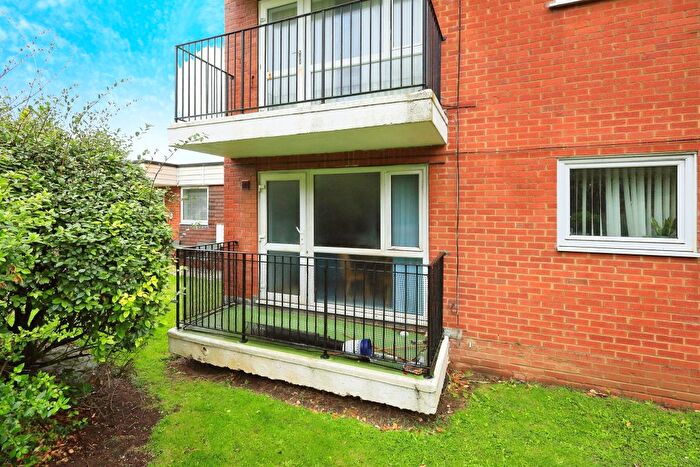
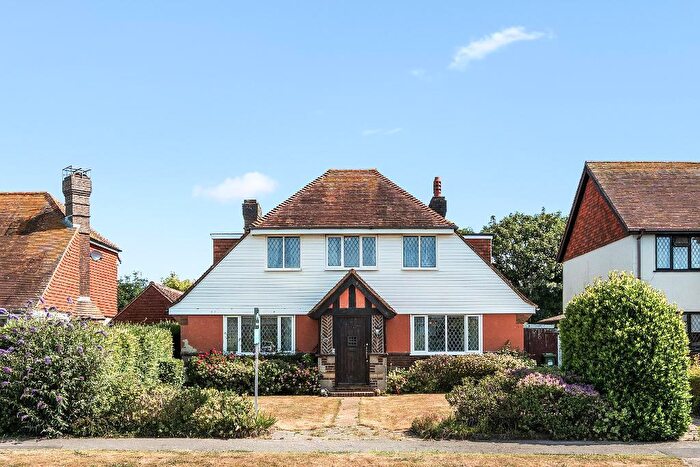
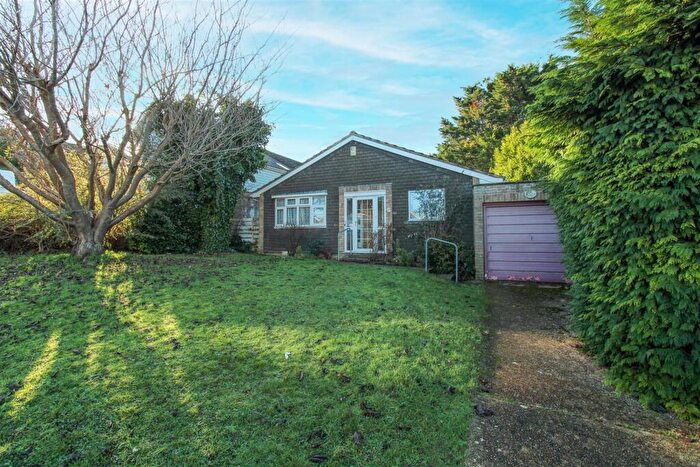
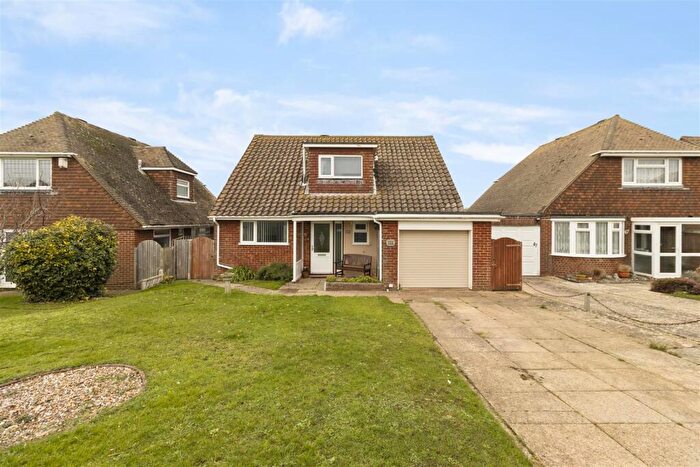
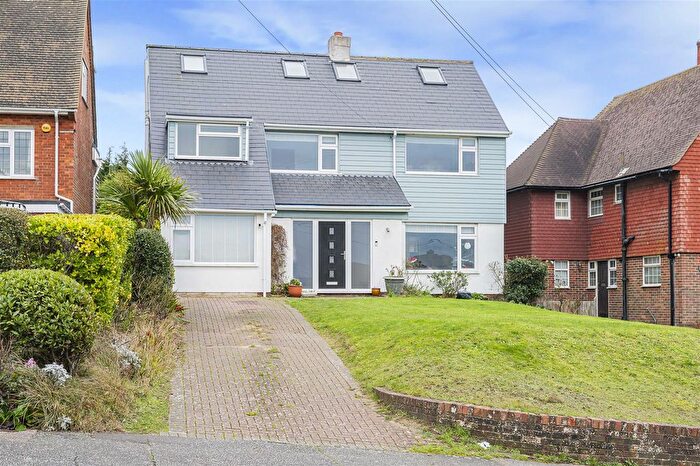
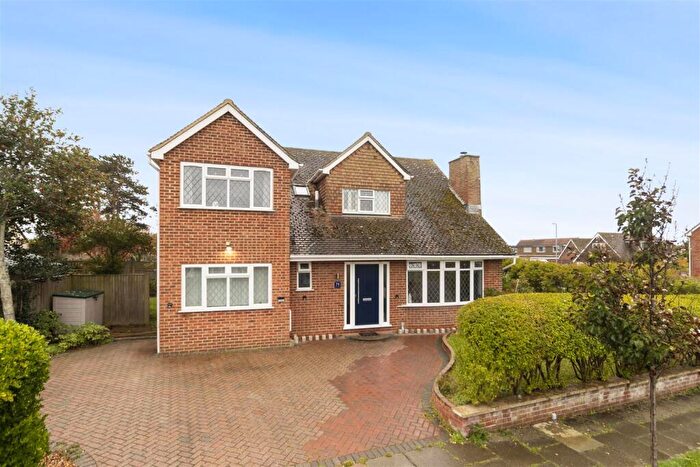
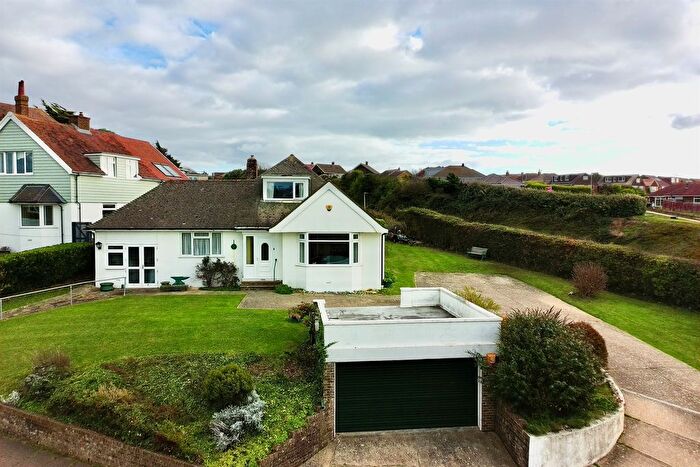
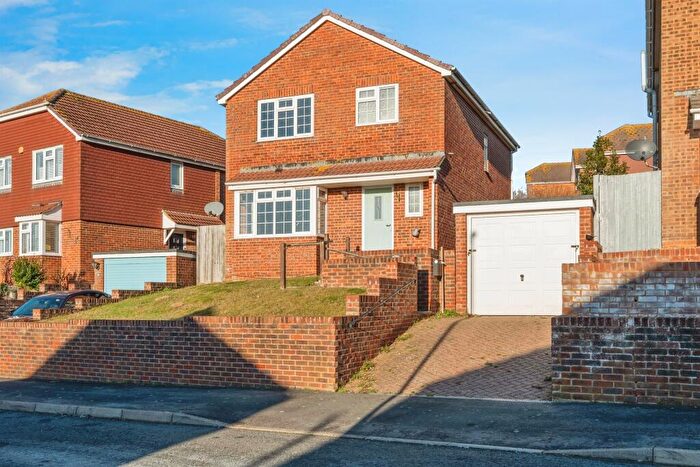
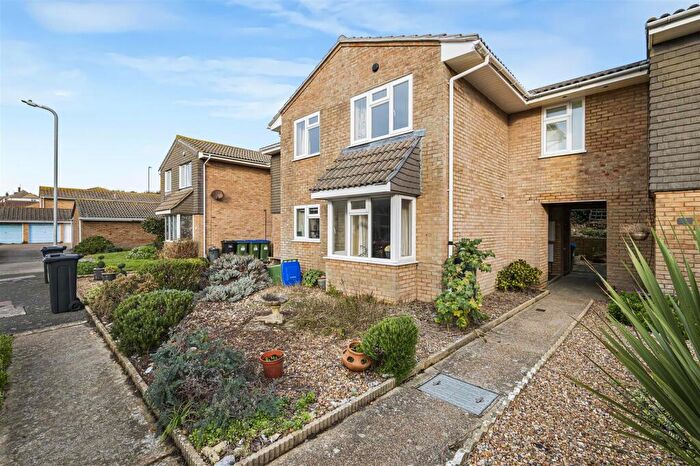
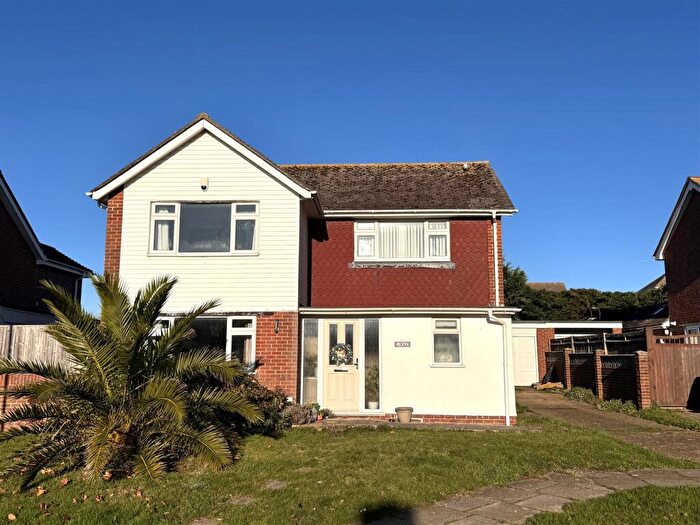
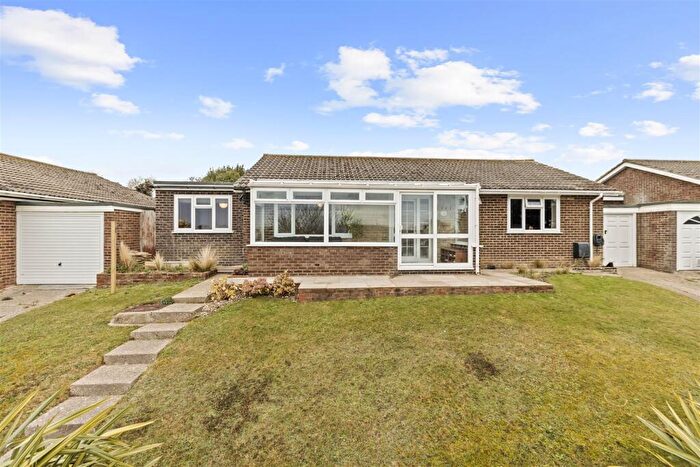
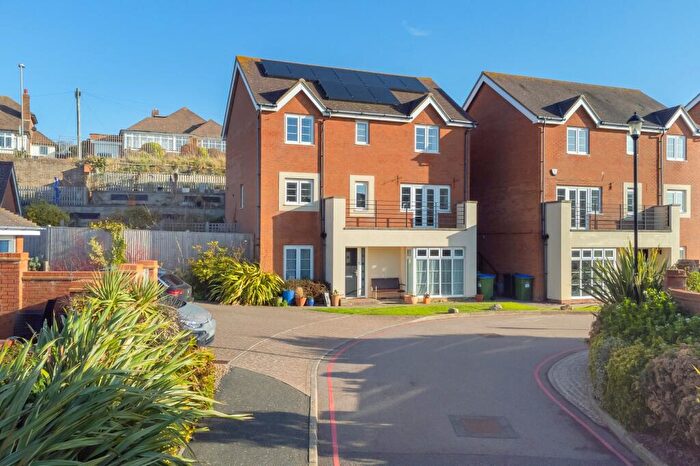
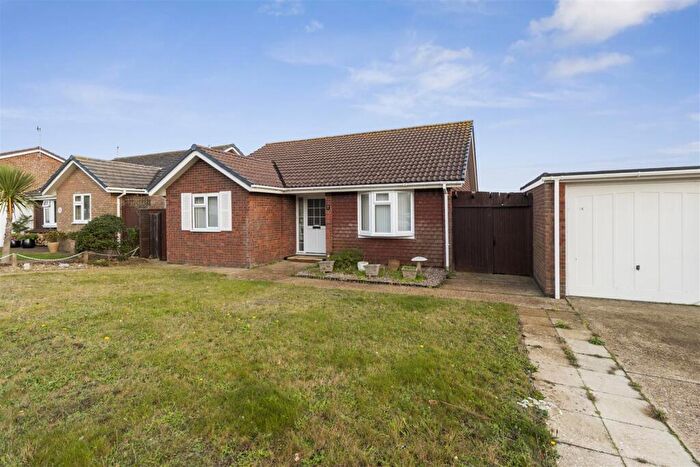
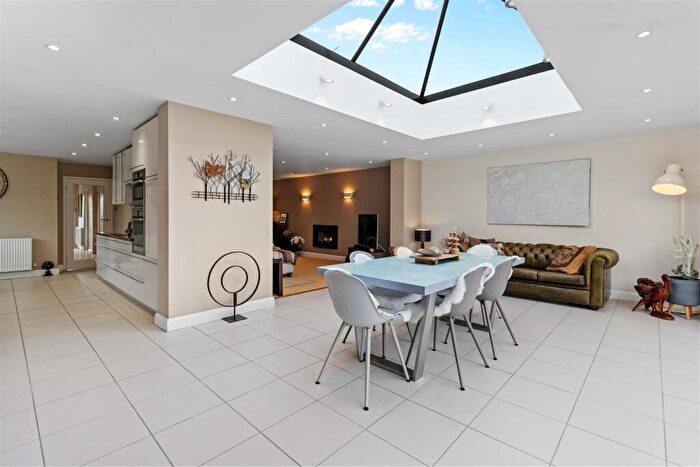
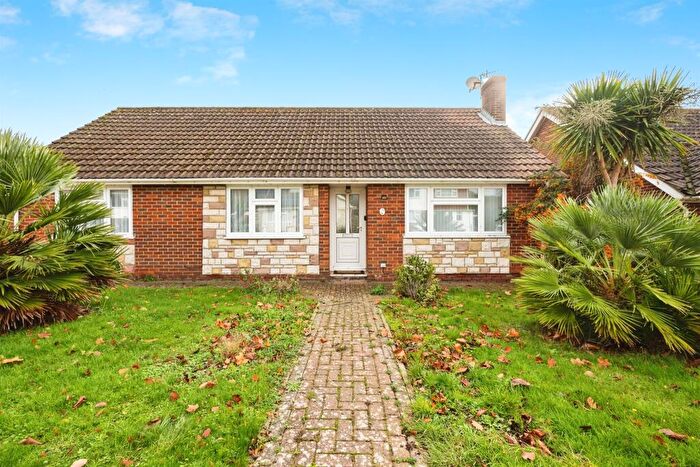
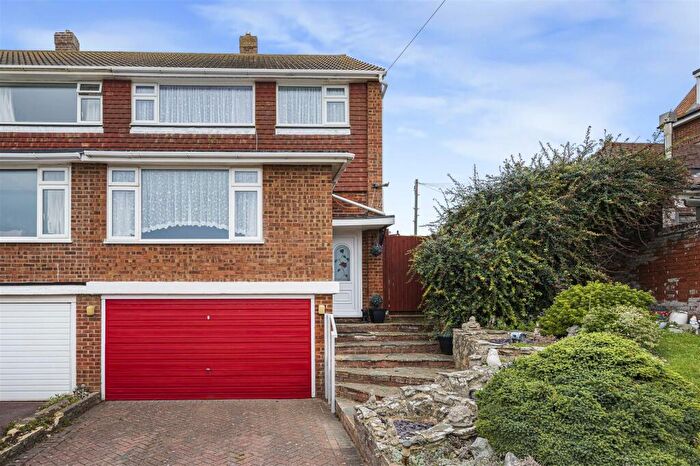
Properties for sale near BN25 2RN, Hawth Rise

![]()
If you are looking to sell your house, let it out, or receive a property valuation, an expert can help you.
Click the button below to get started.
Price Paid in Hawth Rise, BN25 2RN, Seaford West
4 Hawth Rise, BN25 2RN, Seaford West Seaford
Property 4 has been sold 1 time. The last time it was sold was in 21/09/2018 and the sold price was £317,000.00.
This detached house, sold as a freehold on 21/09/2018, is a 74 sqm detached bungalow with an EPC rating of D.
| Date | Price | Property Type | Tenure | Classification |
|---|---|---|---|---|
| 21/09/2018 | £317,000.00 | Detached House | freehold | Established Building |
1 Hawth Rise, BN25 2RN, Seaford West Seaford
Property 1 has been sold 2 times. The last time it was sold was in 07/01/2016 and the sold price was £299,950.00.
This detached house, sold as a freehold on 07/01/2016, is a 68 sqm detached bungalow with an EPC rating of C.
| Date | Price | Property Type | Tenure | Classification |
|---|---|---|---|---|
| 07/01/2016 | £299,950.00 | Detached House | freehold | Established Building |
| 20/06/2006 | £207,500.00 | Detached House | freehold | Established Building |
2 Hawth Rise, BN25 2RN, Seaford West Seaford
Property 2 has been sold 2 times. The last time it was sold was in 24/06/2005 and the sold price was £193,000.00.
This is a Detached House which was sold as a freehold in 24/06/2005
| Date | Price | Property Type | Tenure | Classification |
|---|---|---|---|---|
| 24/06/2005 | £193,000.00 | Detached House | freehold | Established Building |
| 24/07/2001 | £110,000.00 | Detached House | freehold | Established Building |
Transport near BN25 2RN, Hawth Rise

House price paid reports for BN25 2RN, Hawth Rise
Click on the buttons below to see price paid reports by year or property price:
- Price Paid By Year
Property Price Paid in BN25 2RN, Hawth Rise by Year
The average sold property price by year was:
| Year | Average Sold Price | Price Change |
Sold Properties
|
|---|---|---|---|
| 2018 | £317,000 | 5% |
1 Property |
| 2016 | £299,950 | 31% |
1 Property |
| 2006 | £207,500 | 7% |
1 Property |
| 2005 | £193,000 | 43% |
1 Property |
| 2001 | £110,000 | - |
1 Property |