
Houses for sale & to rent in BN25 2UF, Seaford West, Seaford
House Prices in BN25 2UF, Seaford West
Properties in BN25 2UF have no sales history available within the last 3 years. BN25 2UF is a postcode in Seaford West, an area in Seaford, East Sussex, with 4 households².
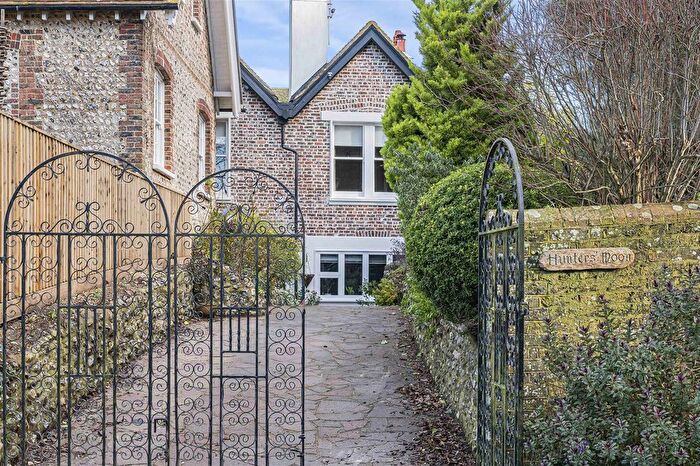
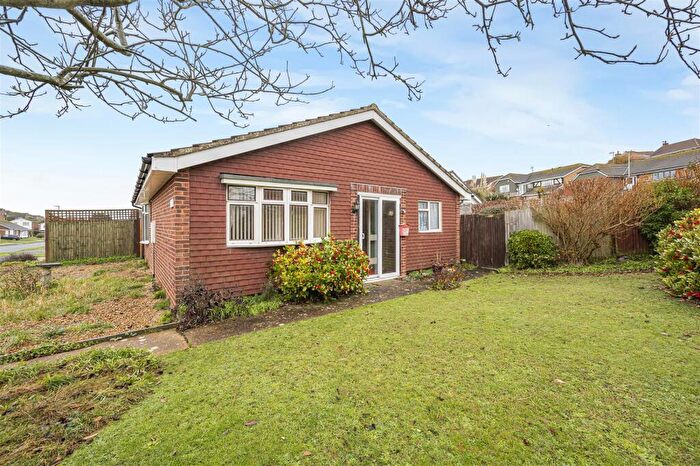
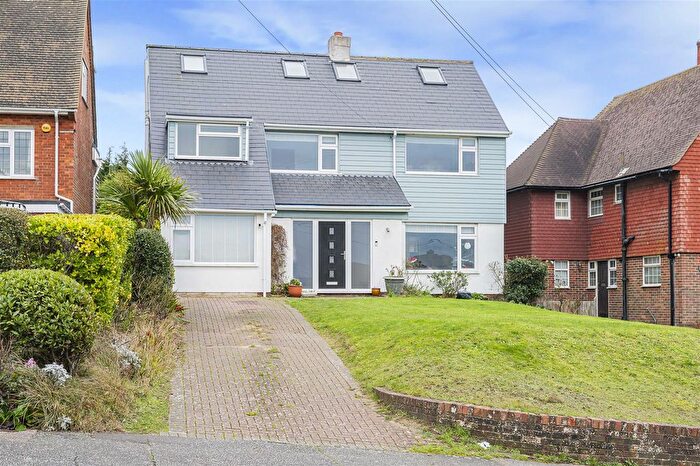
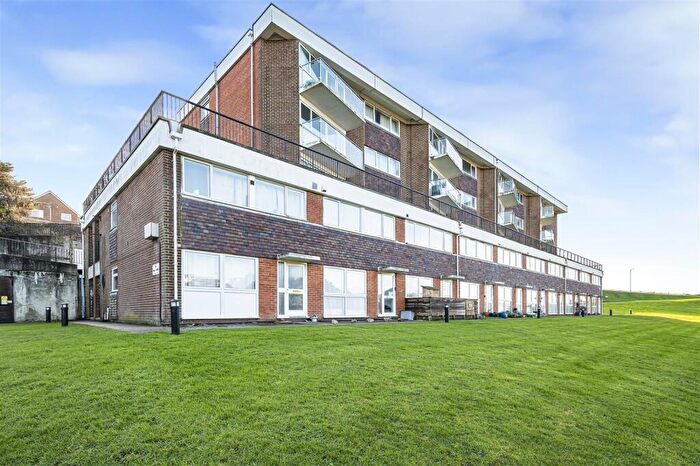
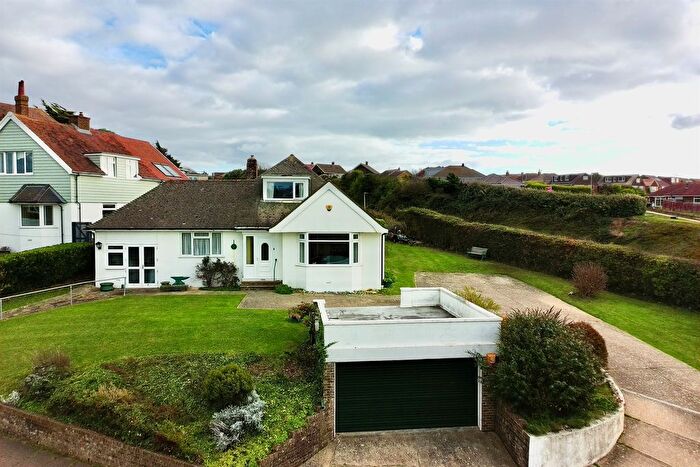
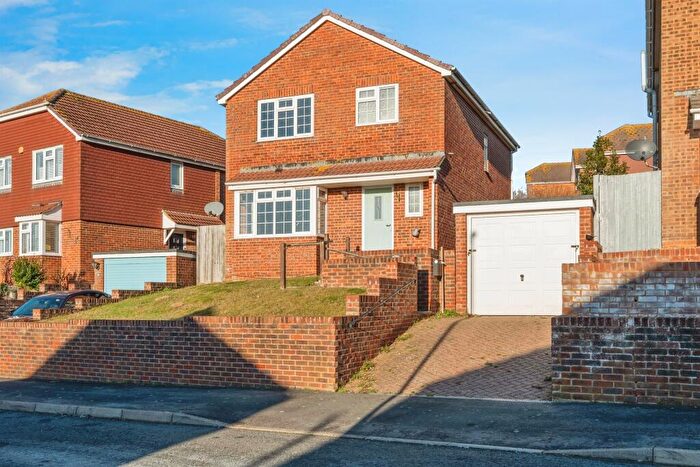
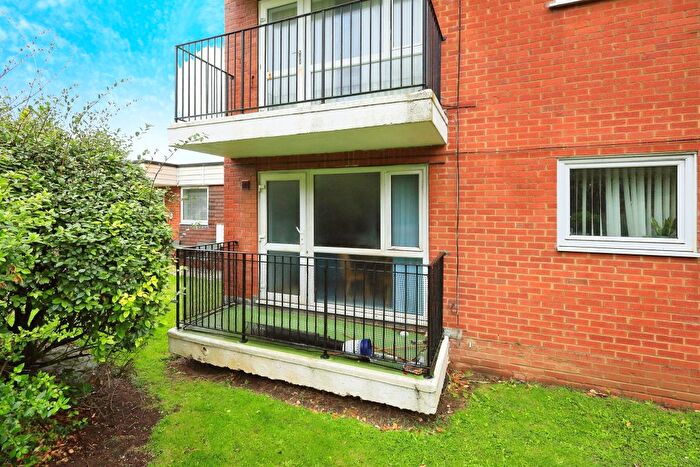
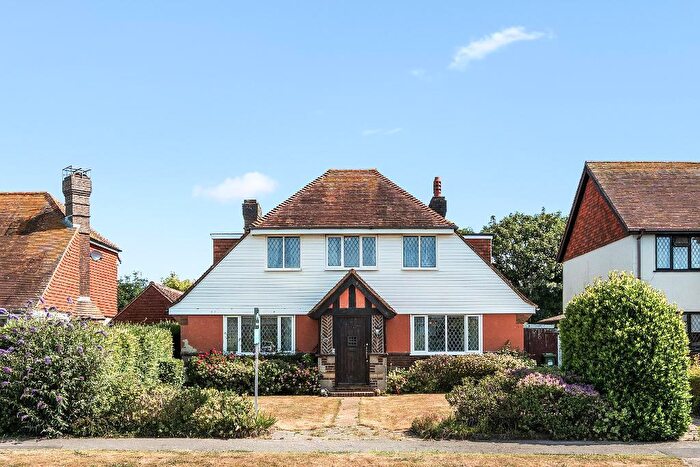
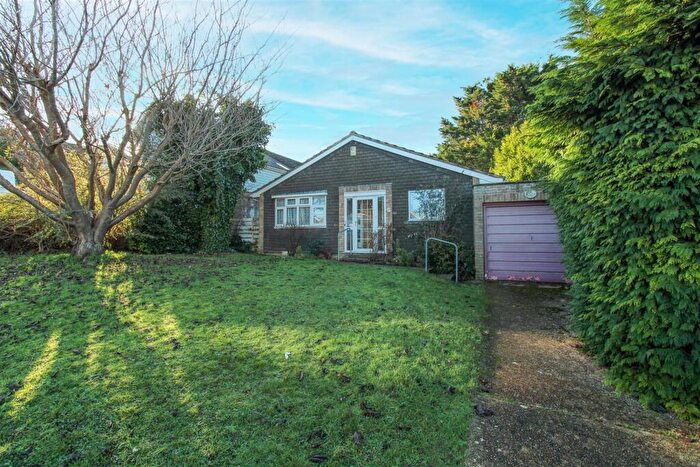
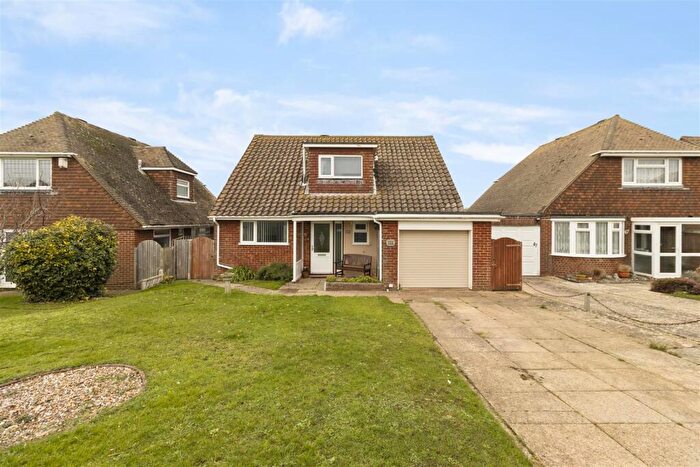
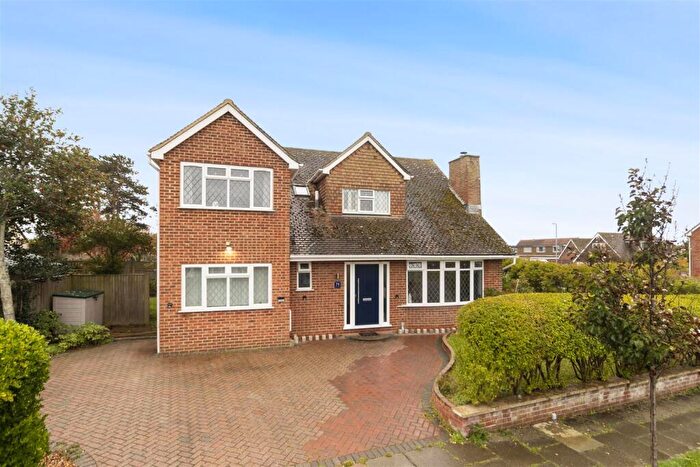
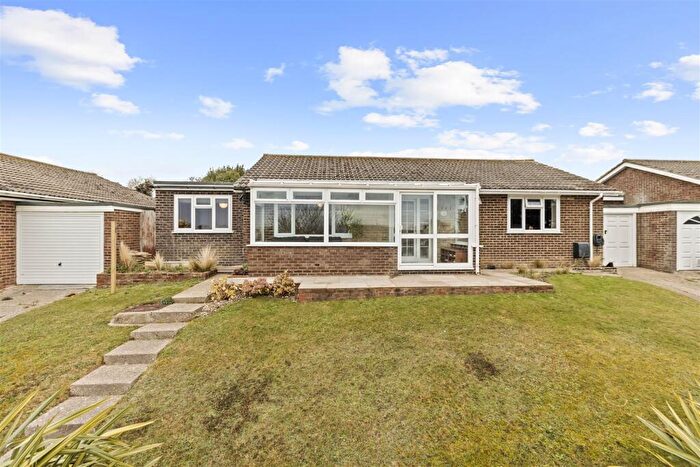
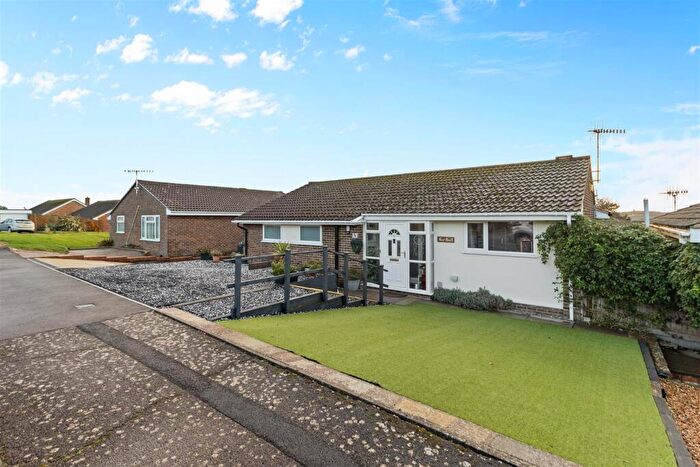
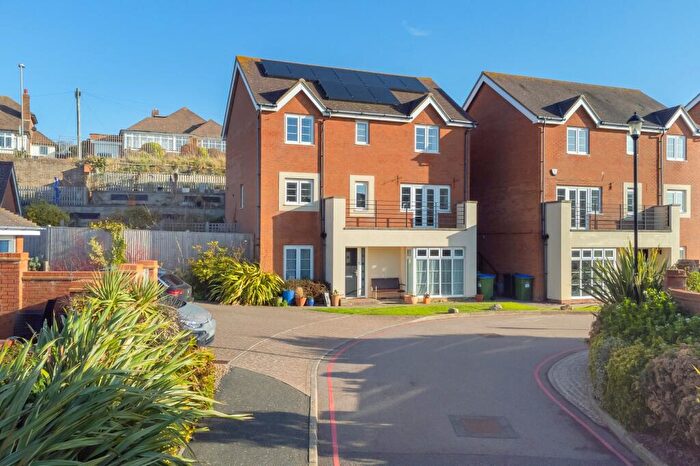
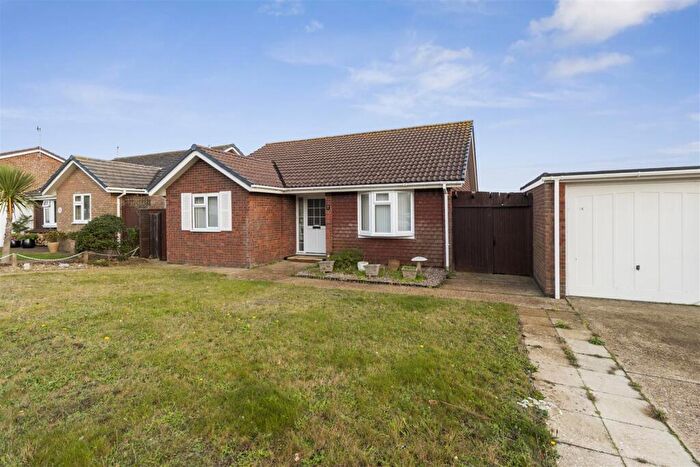
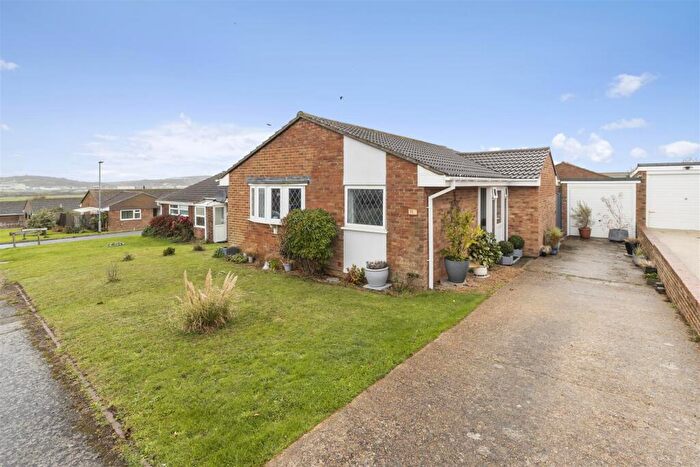
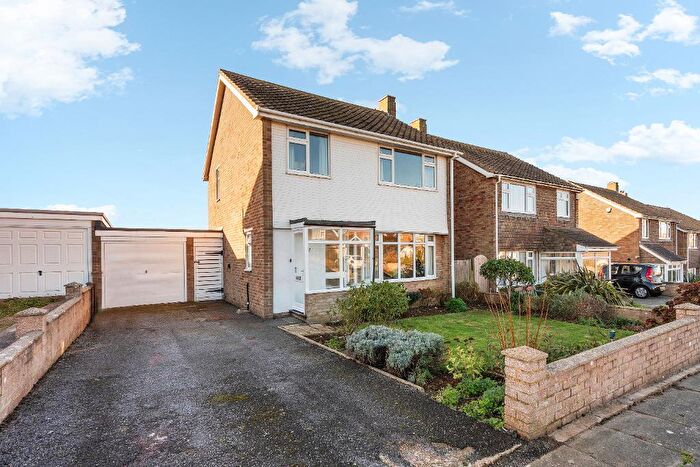
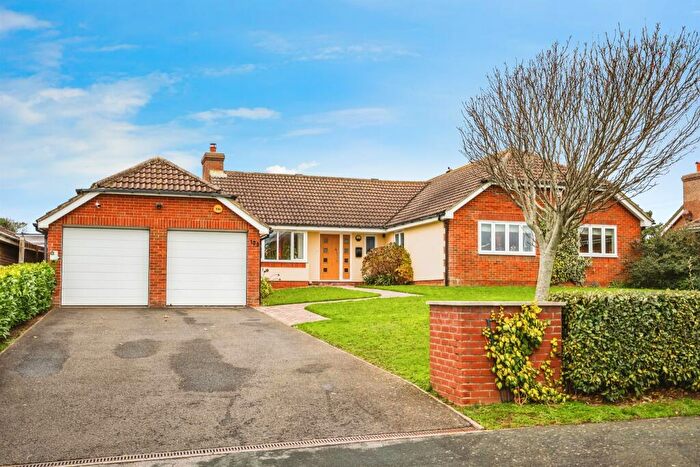
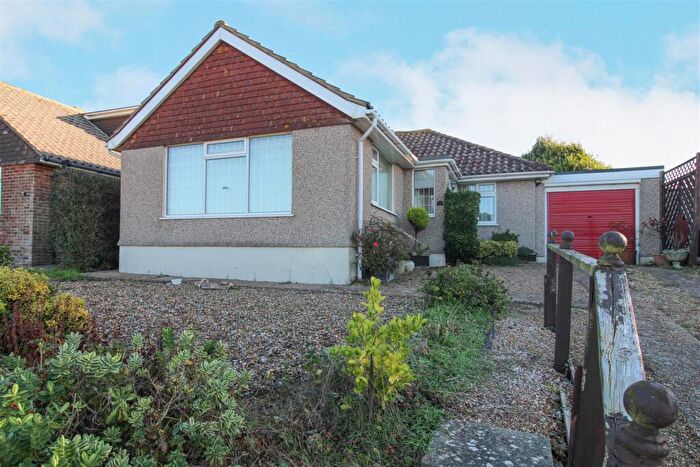
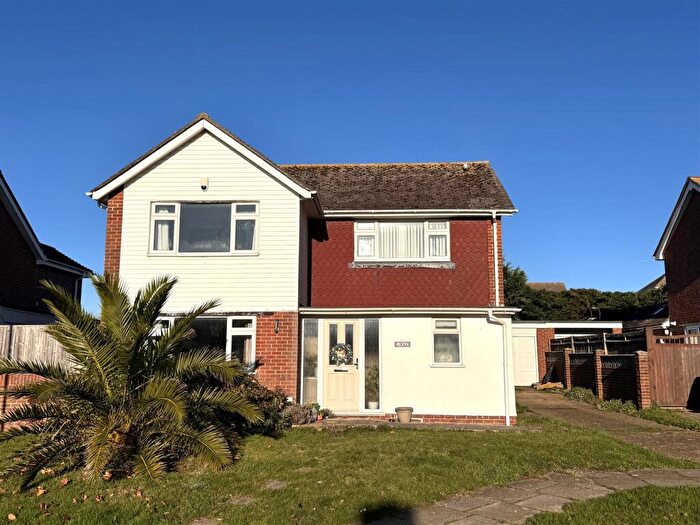
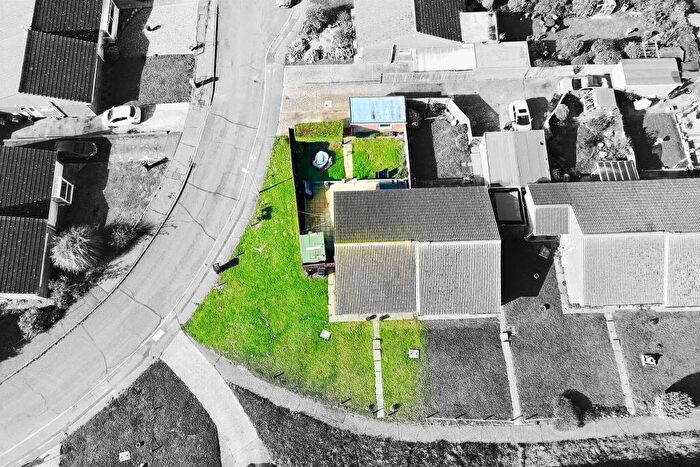
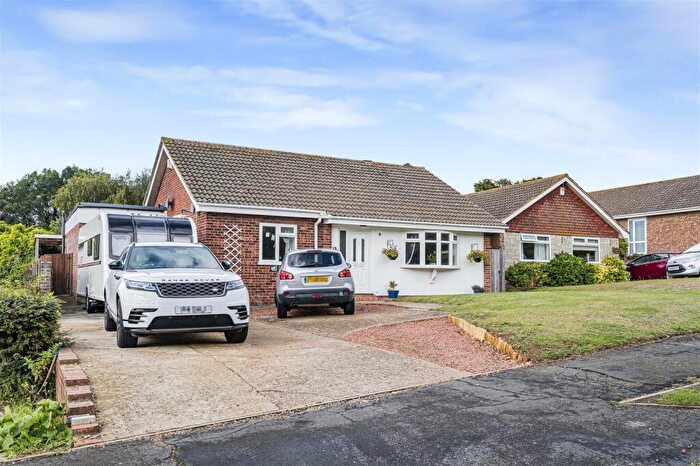
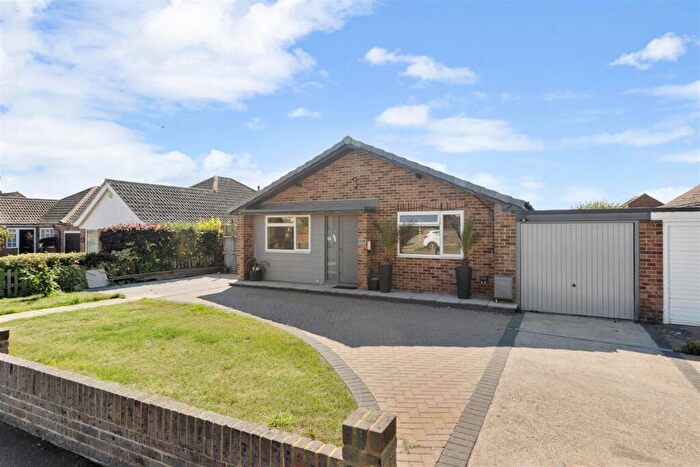
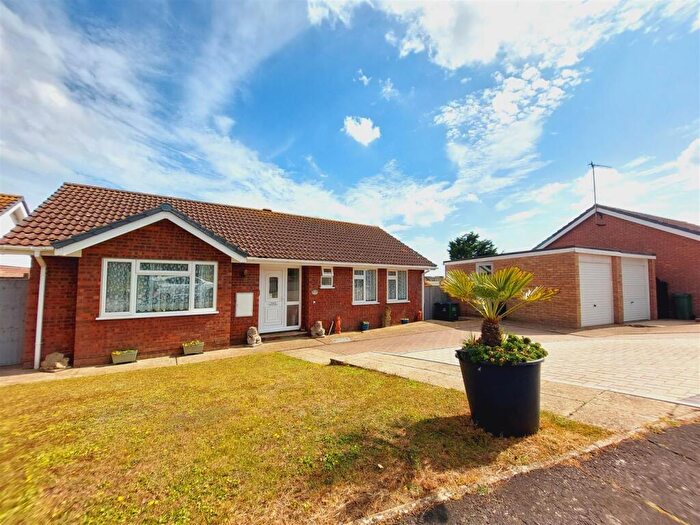
Properties for sale near BN25 2UF
![]()
If you are looking to sell your house, let it out, or receive a property valuation, an expert can help you.
Click the button below to get started.
Price Paid in BN25 2UF, Seaford West
125 BN25 2UF, Seaford West Seaford
Property 125 has been sold 2 times. The last time it was sold was in 18/10/2021 and the sold price was £675,000.00.
This semi detached house, sold as a freehold on 18/10/2021, is a 87 sqm semi-detached house with an EPC rating of E.
| Date | Price | Property Type | Tenure | Classification |
|---|---|---|---|---|
| 18/10/2021 | £675,000.00 | Semi Detached House | freehold | Established Building |
| 31/07/1998 | £110,000.00 | Semi Detached House | freehold | Established Building |
124 BN25 2UF, Seaford West Seaford
Property 124 has been sold 3 times. The last time it was sold was in 04/01/2013 and the sold price was £425,000.00.
This is a Semi Detached House which was sold as a freehold in 04/01/2013
| Date | Price | Property Type | Tenure | Classification |
|---|---|---|---|---|
| 04/01/2013 | £425,000.00 | Semi Detached House | freehold | Established Building |
| 06/02/2003 | £350,000.00 | Terraced House | freehold | Established Building |
| 14/06/1996 | £137,000.00 | Terraced House | freehold | Established Building |
THE SCHOOL HOUSE BN25 2UF, Seaford West Seaford
Property THE SCHOOL HOUSE has been sold 1 time. The last time it was sold was in 02/10/1996 and the sold price was £48,000.00.
This is a Semi Detached House which was sold as a freehold in 02/10/1996
| Date | Price | Property Type | Tenure | Classification |
|---|---|---|---|---|
| 02/10/1996 | £48,000.00 | Semi Detached House | freehold | Established Building |
Transport near BN25 2UF

House price paid reports for BN25 2UF
Click on the buttons below to see price paid reports by year or property price:
- Price Paid By Year
Property Price Paid in BN25 2UF by Year
The average sold property price by year was:
| Year | Average Sold Price | Price Change |
Sold Properties
|
|---|---|---|---|
| 2021 | £675,000 | 37% |
1 Property |
| 2013 | £425,000 | 18% |
1 Property |
| 2003 | £350,000 | 69% |
1 Property |
| 1998 | £110,000 | 16% |
1 Property |
| 1996 | £92,500 | - |
2 Properties |