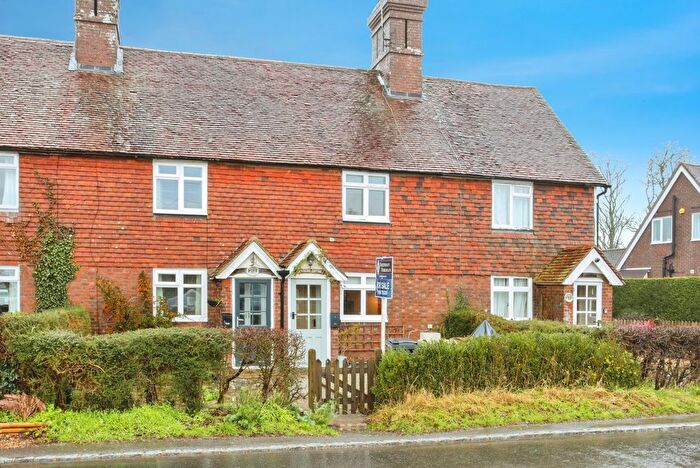
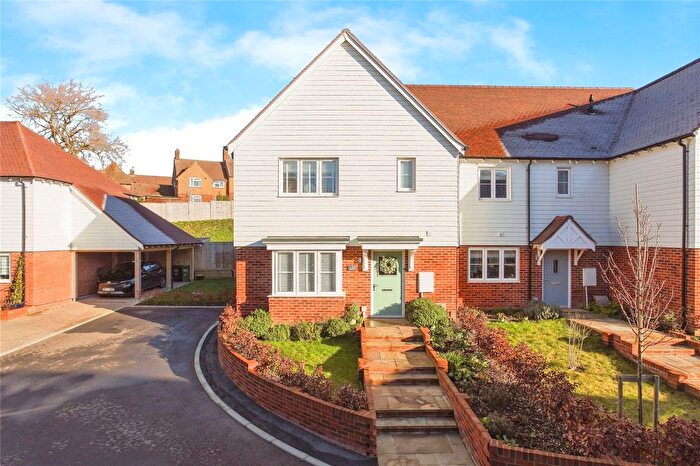
Houses for sale & to rent in Ticehurst And Etchingham, Wadhurst
House Prices in Ticehurst And Etchingham
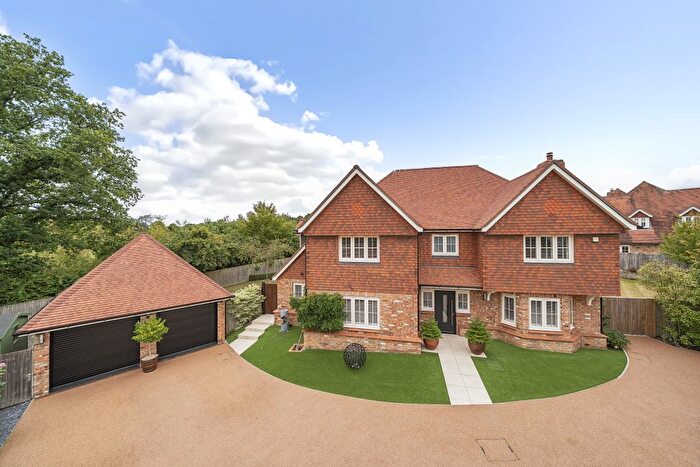
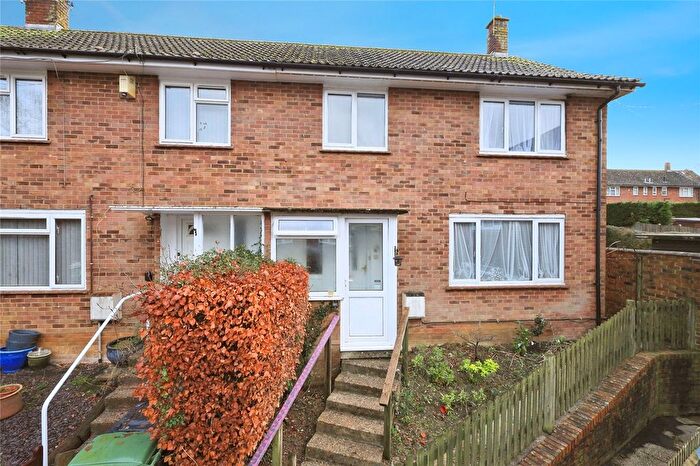
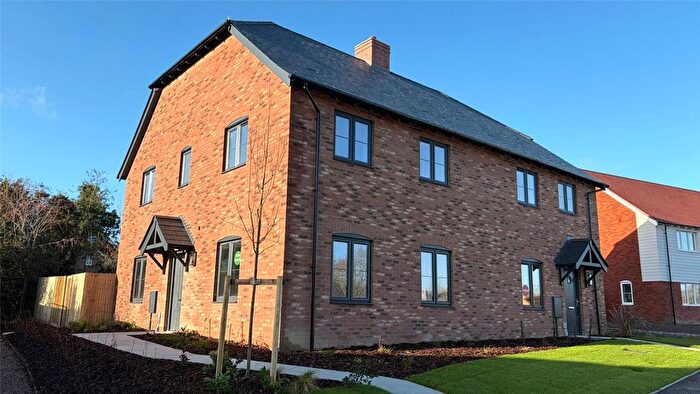
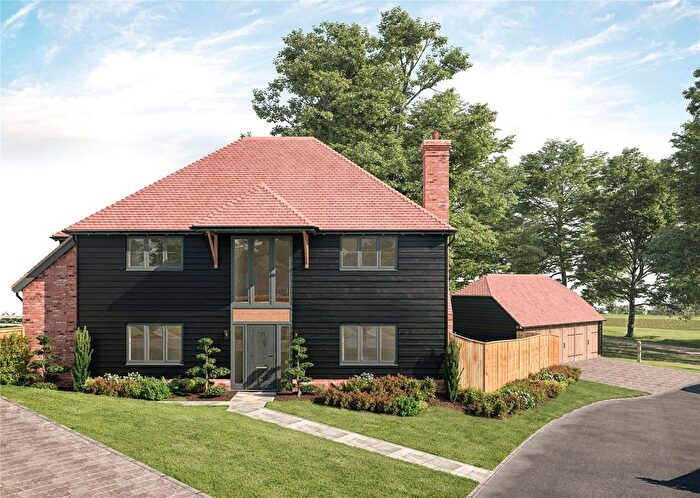
Properties in Ticehurst And Etchingham have an average house price of £552,148.00 and had 97 Property Transactions within the last 3 years¹.
Ticehurst And Etchingham is an area in Wadhurst, East Sussex with 1,402 households², where the most expensive property was sold for £2,150,000.00.
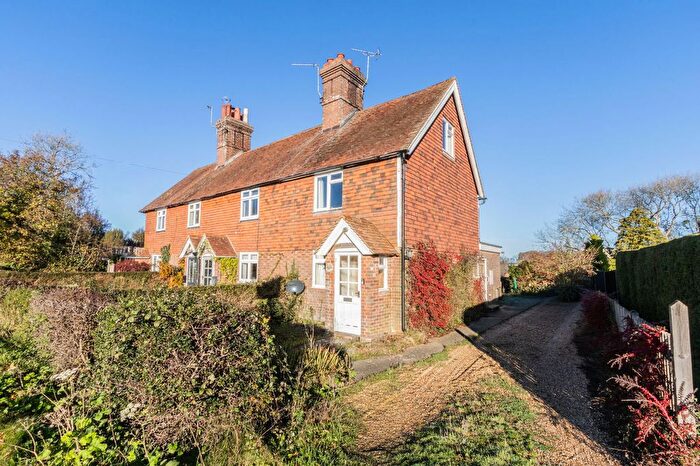
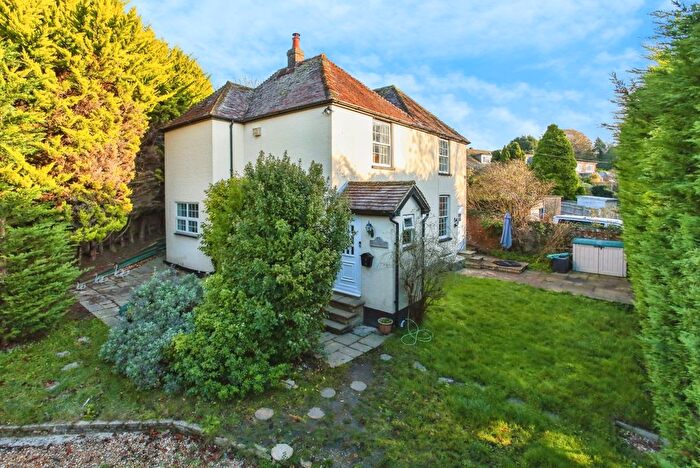
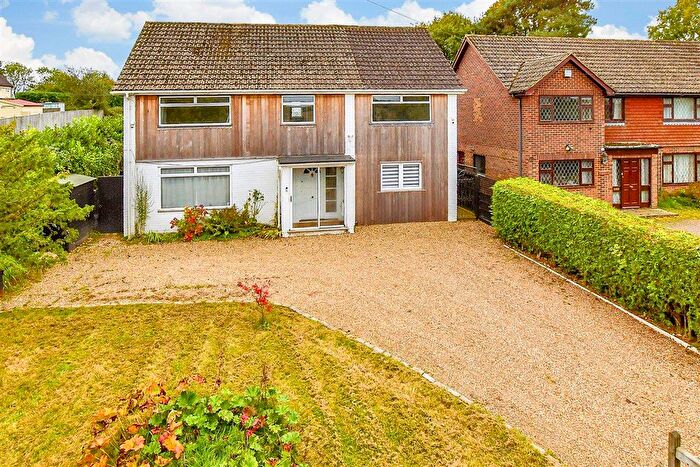
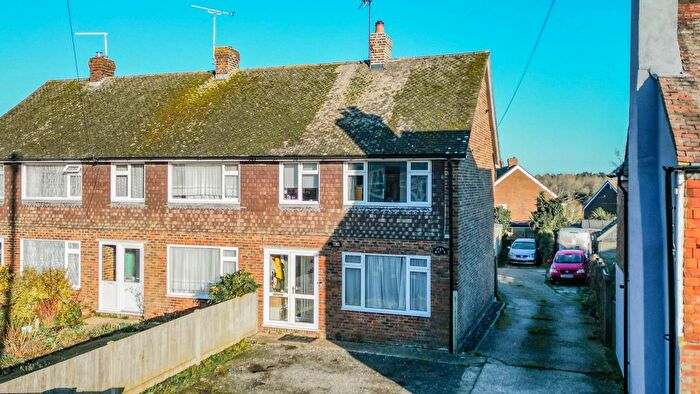
Properties for sale in Ticehurst And Etchingham
Roads and Postcodes in Ticehurst And Etchingham
Navigate through our locations to find the location of your next house in Ticehurst And Etchingham, Wadhurst for sale or to rent.
| Streets | Postcodes |
|---|---|
| Acres Rise | TN5 7DD |
| Bardown Road | TN5 7EH TN5 7EJ TN5 7EL |
| Battenhurst Road | TN5 7DU |
| Berners Court Yard | TN5 7NE |
| Berners Hill | TN5 7NA TN5 7ND TN5 7NH |
| Bewl Bridge Close | TN5 7NL |
| Bewlbridge Lane | TN5 6HL |
| Birchetts Green | TN5 6HS |
| Blenheim Way | TN5 7PQ |
| Broom Hill | TN5 7NJ |
| Burntlodge Lane | TN5 7LA TN5 7LB TN5 7LD TN5 7LE |
| Chapel Place | TN5 7BE |
| Church Street | TN5 7AA TN5 7AB TN5 7AE TN5 7AG TN5 7AH TN5 7DL |
| Churchsettle Lane | TN5 6NG |
| Claphatch Lane | TN5 6HN |
| Clarks Yard | TN5 7NG |
| Cottenden Road | TN5 7DX TN5 7DY TN5 7EB |
| Cross Lane | TN5 7HQ |
| Cross Lane Gardens | TN5 7HY |
| Dale Hill | TN5 7DG TN5 7DQ |
| Dunsters Mill Road | TN5 7HP TN5 7HR TN5 7HS |
| Eden Court | TN5 7AF |
| Farthing Hill | TN5 7BW |
| Forgefield | TN5 7ED |
| Frant Cottages | TN5 7BG |
| Gabriel Cottages | TN5 7HJ |
| Hastings Road | TN5 7PR |
| Hazelwood Cottages | TN5 7AL |
| High Street | TN5 7AS TN5 7BD TN5 7BQ TN5 7EX TN5 7JH TN5 7JL TN5 7JN TN5 7JT TN5 7PA TN5 7PB TN5 7PD TN5 7PE TN5 7PF |
| Hillbury Gardens | TN5 7AT |
| Horsegrove Avenue | TN5 7DE |
| Lavender Gardens | TN5 7LZ |
| Limden Close | TN5 7EG |
| London Road | TN5 7PG TN5 7PH TN5 7PL |
| Lower Gate | TN5 7HA |
| Lower Platts | TN5 7BU TN5 7BX TN5 7BY TN5 7BZ TN5 7DA TN5 7DB |
| Lower St Marys | TN5 7AW |
| Lymden Lane | TN5 7EE TN5 7JD |
| Mabbs Hill | TN5 7EF |
| Marlpit Gardens | TN5 7BB |
| Midhill Cottages | TN5 7NB |
| Nursery Close | TN5 7NF |
| Old Wardsdown | TN5 7NN |
| Owls Gardens | TN5 7DZ |
| Pashley Road | TN5 7HE |
| Pickforde Lane | TN5 7BJ TN5 7BL TN5 7BN |
| Pinton Hill | TN5 7LH |
| Reeves Terrace | TN5 7RT |
| Rose Hill | TN5 7AJ |
| Rosemary Lane | TN5 7PS TN5 7PT TN5 7PY |
| Shovers Green | TN5 7JU TN5 7JY |
| Springfields | TN5 7BP TN5 7BS |
| St Marys Close | TN5 7BA |
| St Marys Lane | TN5 7AU TN5 7AX |
| Station Road | TN5 7EN TN5 7EP TN5 7ES TN5 7EU |
| Steellands Rise | TN5 7DH |
| Stonegate | TN5 7DS TN5 7DT |
| Stonegate Court | TN5 7EQ |
| Summerhill | TN5 7JA |
| Sunnybank | TN5 7QR |
| The Acorns | TN5 7EY |
| The Mount | TN5 7QN TN5 7QP TN5 7QW |
| Three Leg Cross | TN5 7HH TN5 7HL TN5 7HN |
| Tinkers Lane | TN5 7LU TN5 7LX |
| Tolhurst Lane | TN5 7JG |
| Twitten Cottages | TN5 7JE |
| Union Street | TN5 7NR TN5 7NS TN5 7NT TN5 7NX TN5 7NY |
| Upper Platts | TN5 7HB TN5 7HD |
| Vineyard Lane | TN5 7LP TN5 7LR |
| Wardbrook Road | TN5 7DP |
| Wards Lane | TN5 6HP TN5 6HR |
| Wardsbrook Cottages | TN5 7DN |
| Wardsbrook Road | TN5 7DR |
| Windy Field | TN5 7LW |
| TN5 7HT TN5 7HX TN5 7JB |
Transport near Ticehurst And Etchingham
- FAQ
- Price Paid By Year
- Property Type Price
Frequently asked questions about Ticehurst And Etchingham
What is the average price for a property for sale in Ticehurst And Etchingham?
The average price for a property for sale in Ticehurst And Etchingham is £552,148. This amount is 9% lower than the average price in Wadhurst. There are 618 property listings for sale in Ticehurst And Etchingham.
What streets have the most expensive properties for sale in Ticehurst And Etchingham?
The streets with the most expensive properties for sale in Ticehurst And Etchingham are Burntlodge Lane at an average of £1,725,000, Shovers Green at an average of £1,293,965 and Battenhurst Road at an average of £1,210,000.
What streets have the most affordable properties for sale in Ticehurst And Etchingham?
The streets with the most affordable properties for sale in Ticehurst And Etchingham are Rosemary Lane at an average of £270,750, Springfields at an average of £297,000 and Lavender Gardens at an average of £310,000.
Which train stations are available in or near Ticehurst And Etchingham?
Some of the train stations available in or near Ticehurst And Etchingham are Stonegate, Etchingham and Wadhurst.
Property Price Paid in Ticehurst And Etchingham by Year
The average sold property price by year was:
| Year | Average Sold Price | Price Change |
Sold Properties
|
|---|---|---|---|
| 2025 | £613,657 | 5% |
22 Properties |
| 2024 | £585,740 | 22% |
45 Properties |
| 2023 | £456,655 | -21% |
30 Properties |
| 2022 | £552,447 | 0,3% |
51 Properties |
| 2021 | £550,866 | 19% |
94 Properties |
| 2020 | £447,114 | 3% |
41 Properties |
| 2019 | £435,467 | -10% |
50 Properties |
| 2018 | £479,144 | 14% |
45 Properties |
| 2017 | £410,348 | -10% |
53 Properties |
| 2016 | £452,838 | 14% |
60 Properties |
| 2015 | £389,335 | 15% |
57 Properties |
| 2014 | £332,612 | -7% |
71 Properties |
| 2013 | £355,644 | 11% |
54 Properties |
| 2012 | £315,730 | -22% |
53 Properties |
| 2011 | £384,839 | 9% |
48 Properties |
| 2010 | £350,643 | -15% |
48 Properties |
| 2009 | £403,284 | - |
44 Properties |
| 2008 | £403,255 | 17% |
38 Properties |
| 2007 | £334,223 | 5% |
82 Properties |
| 2006 | £316,597 | 4% |
104 Properties |
| 2005 | £302,979 | 17% |
61 Properties |
| 2004 | £252,711 | 2% |
85 Properties |
| 2003 | £247,219 | -1% |
75 Properties |
| 2002 | £250,407 | 9% |
79 Properties |
| 2001 | £226,977 | 24% |
68 Properties |
| 2000 | £172,972 | 3% |
68 Properties |
| 1999 | £167,994 | 19% |
102 Properties |
| 1998 | £136,690 | 7% |
80 Properties |
| 1997 | £126,784 | 18% |
98 Properties |
| 1996 | £104,413 | -13% |
103 Properties |
| 1995 | £117,502 | - |
56 Properties |
Property Price per Property Type in Ticehurst And Etchingham
Here you can find historic sold price data in order to help with your property search.
The average Property Paid Price for specific property types in the last three years are:
| Property Type | Average Sold Price | Sold Properties |
|---|---|---|
| Semi Detached House | £430,634.00 | 33 Semi Detached Houses |
| Detached House | £805,076.00 | 36 Detached Houses |
| Terraced House | £413,335.00 | 20 Terraced Houses |
| Flat | £262,250.00 | 8 Flats |

