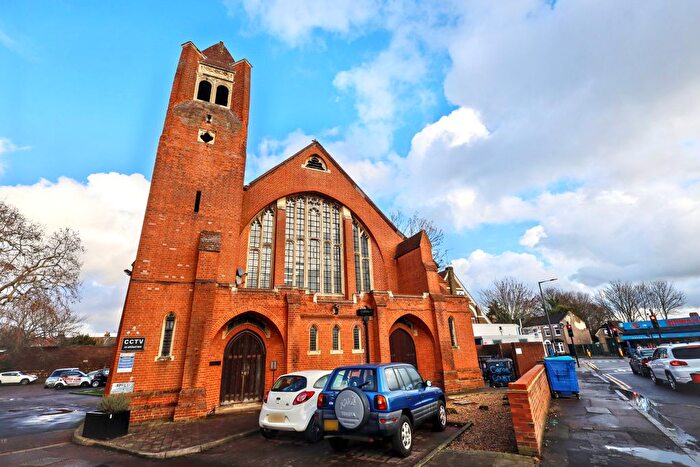
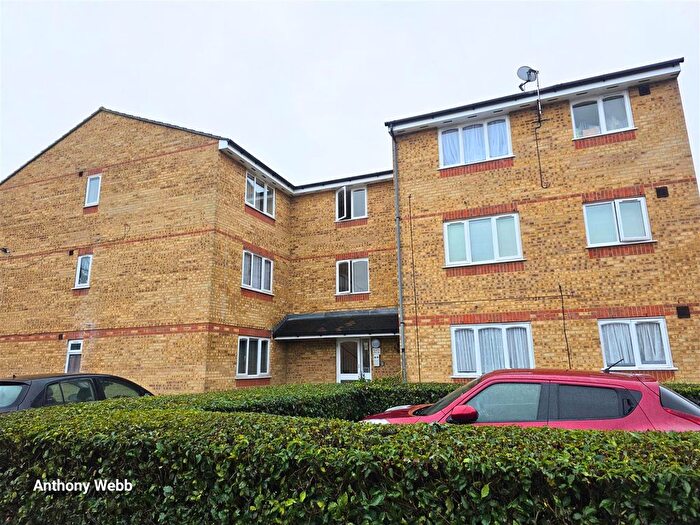
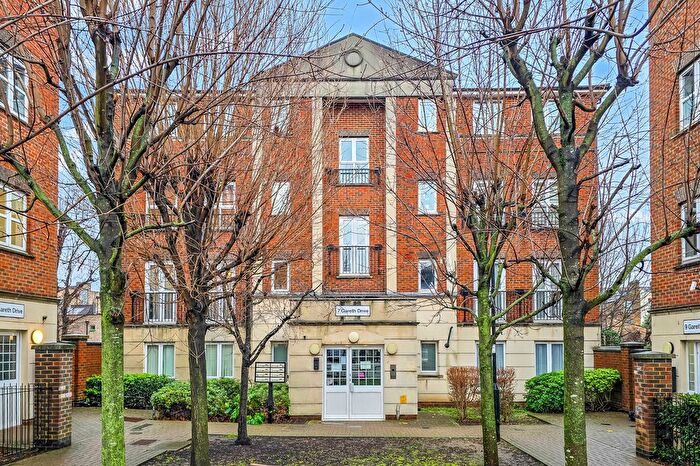
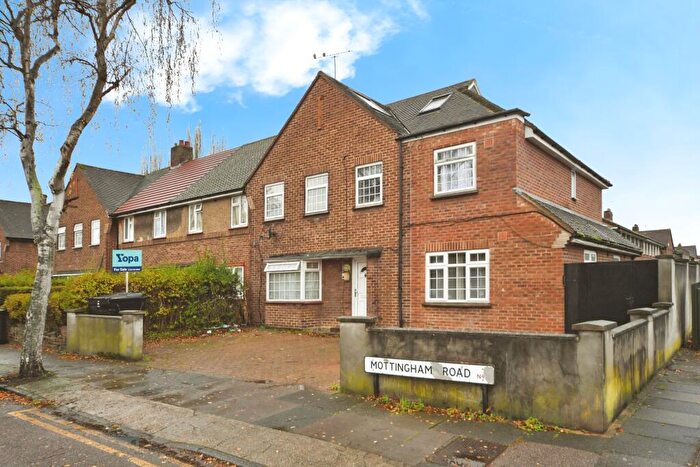
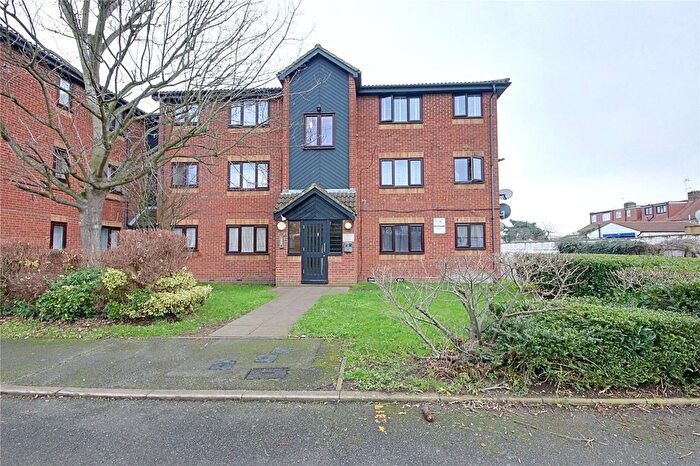
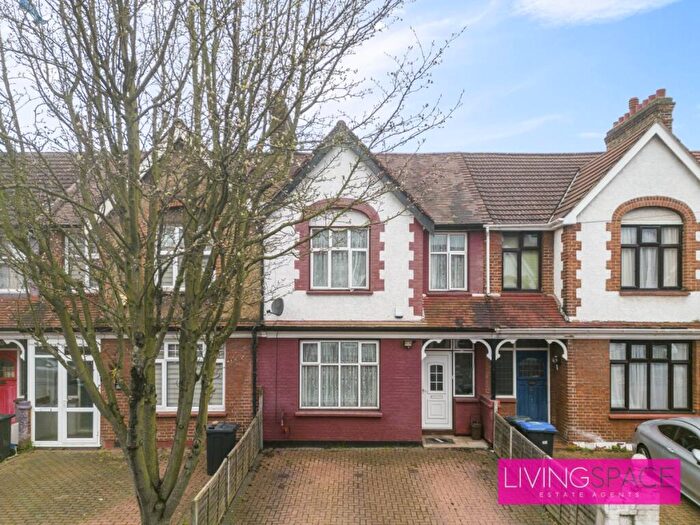
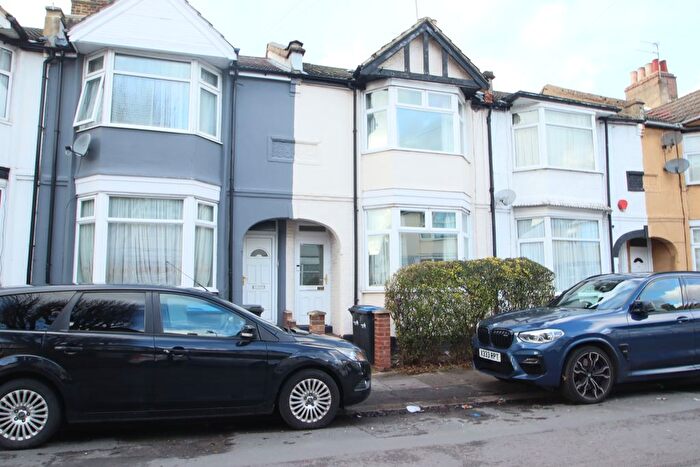
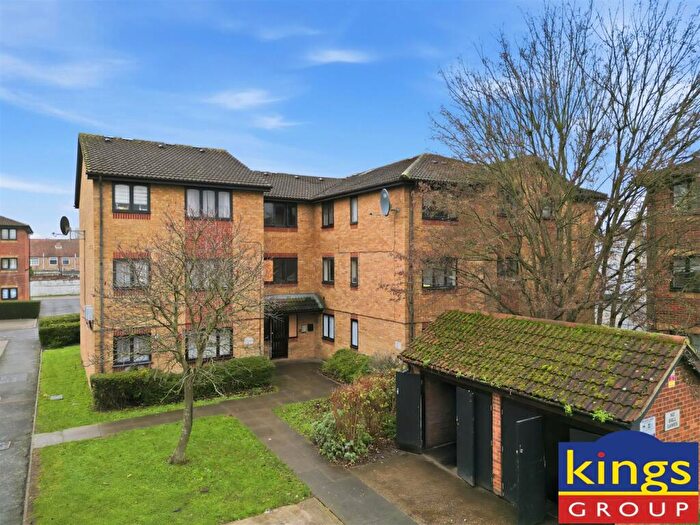
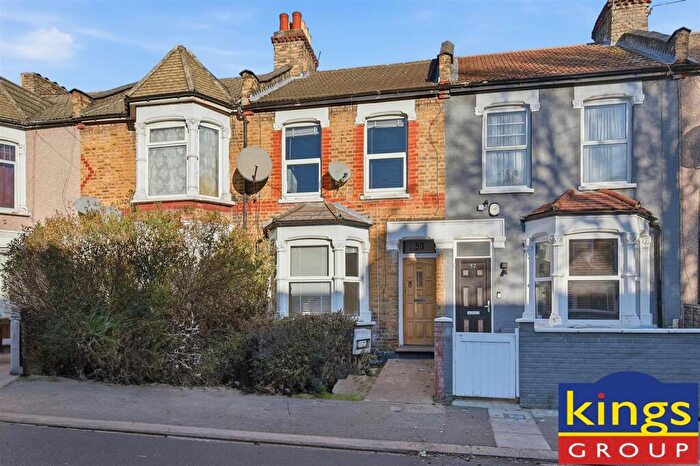
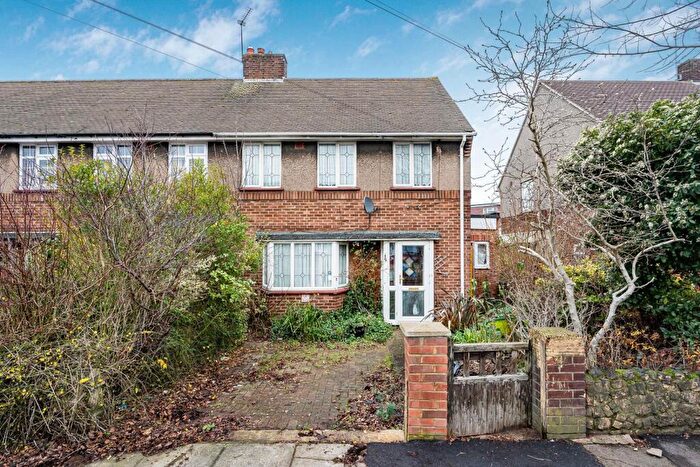
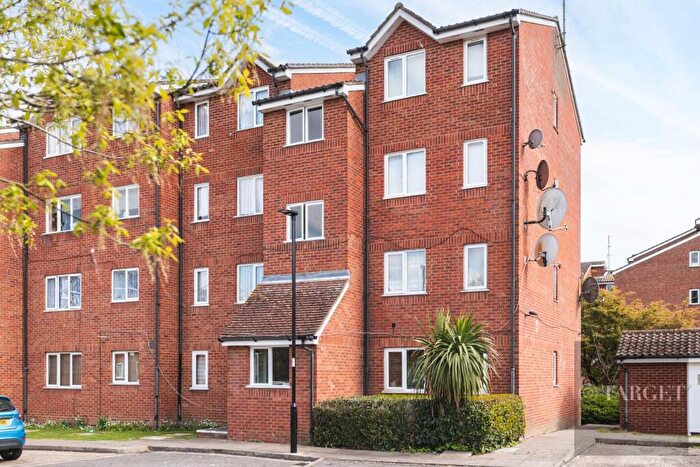
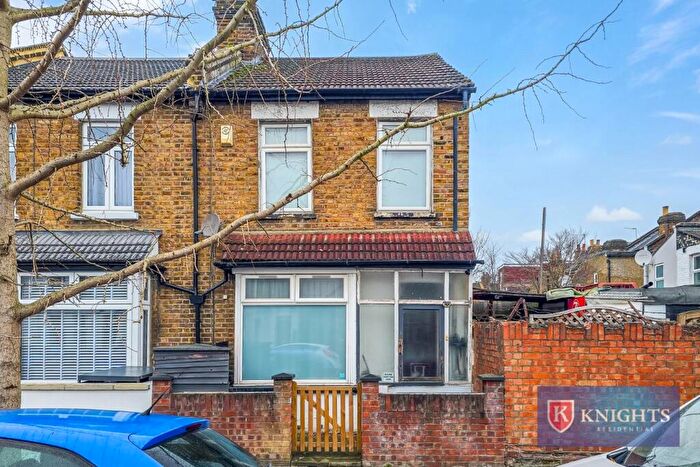
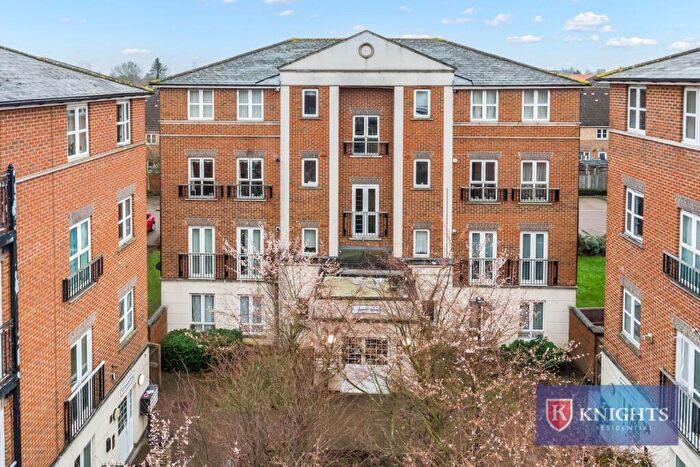
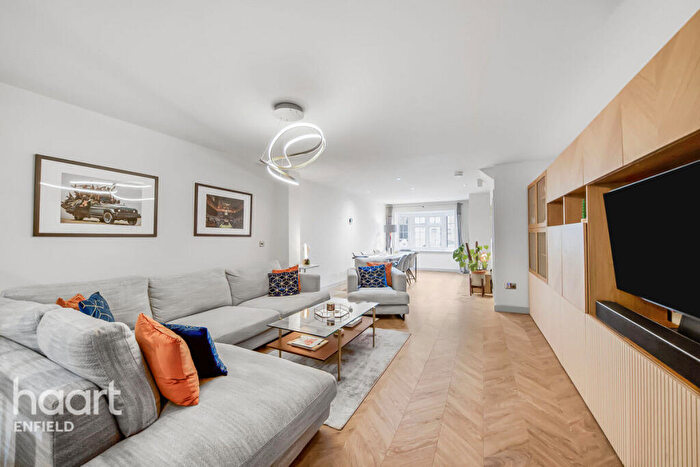
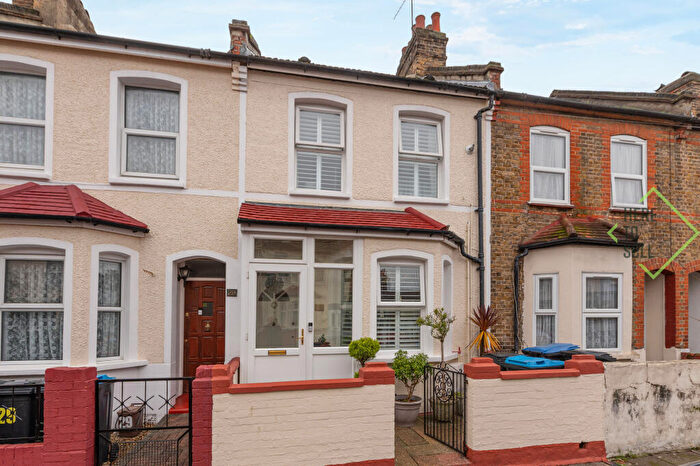
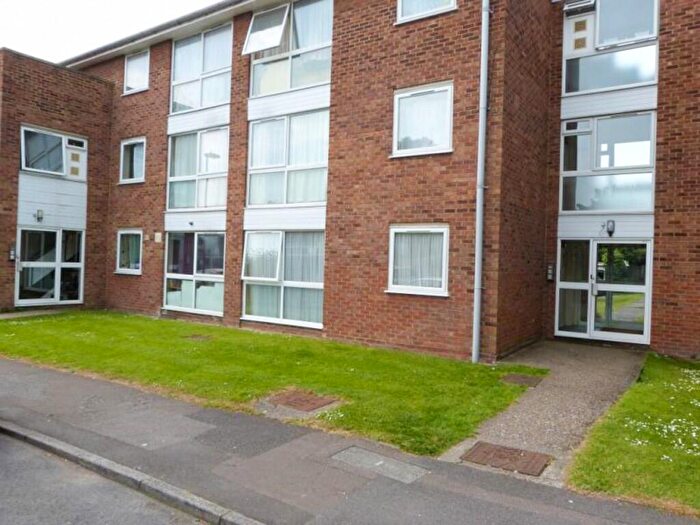
Houses for sale & to rent in Lower Edmonton, London
House Prices in Lower Edmonton
Properties in this part of Lower Edmonton within London have an average house price of £357,666.00 and had 296 Property Transactions within the last 3 years¹. This area has 6,115 households² , where the most expensive property was sold for £550,000.00.
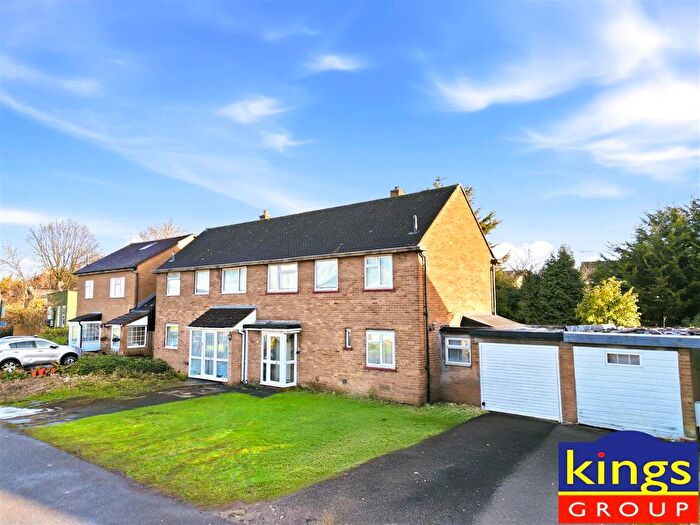
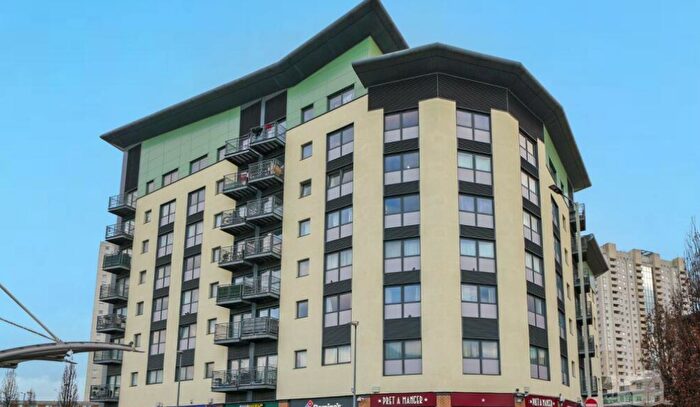
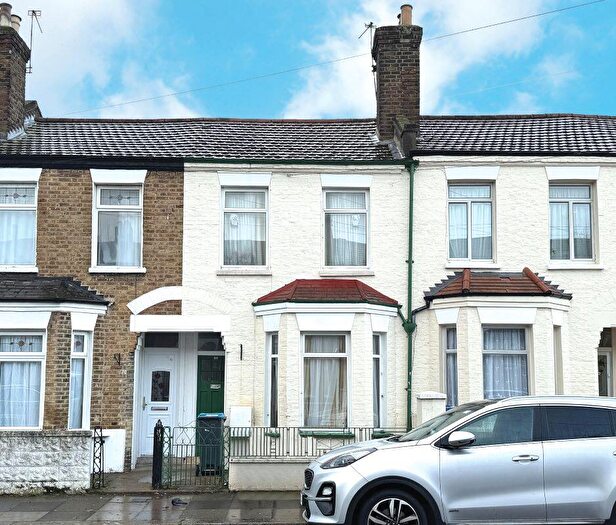
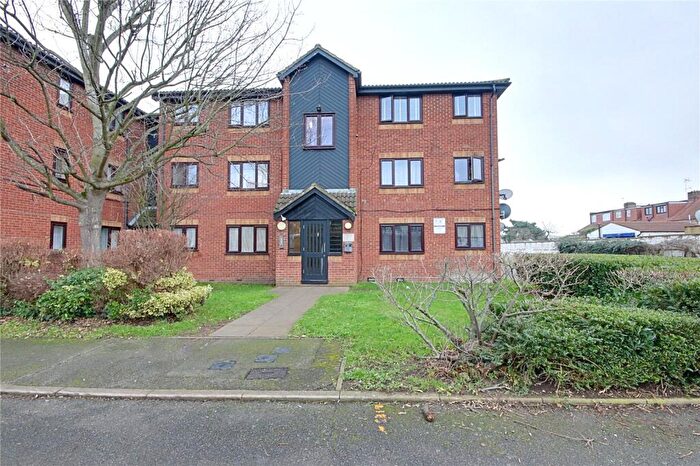
Properties for sale in Lower Edmonton
Roads and Postcodes in Lower Edmonton
Navigate through our locations to find the location of your next house in Lower Edmonton, London for sale or to rent.
| Streets | Postcodes |
|---|---|
| Acton Close | N9 7DW N9 7DY N9 7DZ |
| Ardra Road | N9 0BF |
| Badma Close | N9 0HF |
| Balham Road | N9 7AB N9 7AG N9 7AH |
| Barrowfield Close | N9 0HA N9 0HB |
| Bath Road | N9 0JU N9 0JX |
| Beamish Road | N9 7JA |
| Belmont Avenue | N9 7JJ N9 7JL |
| Bounces Lane | N9 0AF |
| Bounces Road | N9 8HX N9 8HY N9 8JA N9 8JB N9 8JD N9 8JE N9 8JR N9 8JS N9 8LA N9 8LB N9 8LD N9 8LE N9 8LJ N9 8LL N9 8LP |
| Brierley Avenue | N9 8PR |
| Bury Street | N9 7JN N9 7JP N9 7JR N9 7JX N9 7JY N9 7LA N9 7LB N9 7LD N9 7LE |
| Buxton Close | N9 0XL |
| Centre Way | N9 0AH N9 0AP |
| Chad Crescent | N9 0FN N9 0FP N9 0FQ |
| Chester Road | N9 8JG N9 8JH |
| Chiswick Road | N9 7AL N9 7AN N9 7AP N9 7AR N9 7AS |
| Claverings Industrial Estate | N9 0AJ |
| Congo Drive | N9 0FS N9 0GT |
| Coniston Gardens | N9 8NB |
| Cornwallis Avenue | N9 0JH N9 0JP |
| Cornwallis Grove | N9 0JR N9 0JS |
| Cornwallis Road | N9 0JJ N9 0JL N9 0JN |
| Crescent Road | N9 7QH |
| Croyland Road | N9 7AX N9 7AY N9 7BA N9 7BB N9 7BD N9 7BE N9 7BG N9 7BH N9 7BF N9 7BZ |
| Cumberland Road | N9 8LT N9 8LX N9 8LY N9 8NA N9 8ND |
| Danube Close | N9 0GX |
| Densworth Grove | N9 0LH N9 0LJ |
| Devonshire Road | N9 8LU N9 8NE N9 8NG |
| Dickenson Close | N9 7AW |
| Dominion Business Park | N9 0BG |
| Dover Road | N9 0LD |
| Eastbournia Avenue | N9 0RS N9 0RU N9 0RX |
| Eldon Road | N9 8LG N9 8LH |
| Elstree Gardens | N9 8QY |
| Exeter Road | N9 0JG N9 0JT N9 0JY N9 0LB N9 0LL |
| Falman Close | N9 7BW |
| Findon Road | N9 7QA N9 7QB |
| Forest Road | N9 8RU N9 8RX |
| Foxglove Close | N9 8LW |
| Galliard Road | N9 7NX |
| Goodwin Road | N9 0EN N9 0BJ |
| Gordon Road | N9 0LU N9 0LX |
| Granville Avenue | N9 0EY N9 0HD |
| Grosvenor Road | N9 8RE N9 8RG N9 8RH N9 8RJ |
| Harton Road | N9 0SG |
| Hendon Road | N9 7AT N9 7AU |
| Hennessy Road | N9 0XA N9 0XB N9 0XD N9 0XJ N9 0XP N9 0XQ |
| Hertford Road | N9 7EL N9 7EP N9 7HD N9 7HE N9 7HH N9 7HL N9 7EE N9 7EN N9 7HJ |
| Hudson Way | N9 0FU N9 0FW N9 0XE N9 0XF N9 0XG N9 0XH N9 0FX N9 0FY N9 0GR N9 0GS |
| Huntingdon Road | N9 0EL N9 8LR N9 8LS |
| Jubilee Crescent | N9 7NU |
| Junction Road | N9 7JS N9 7JU |
| Kariba Close | N9 0FR |
| Kenwood Road | N9 7JB N9 7JD N9 7JE |
| Kingsmead Avenue | N9 8QS |
| Kingston Road | N9 7AJ |
| Laila Terrace | N9 0AG |
| Lena Crescent | N9 0FB N9 0FD N9 0FA |
| Logan Road | N9 0LP N9 0LQ |
| Lowden Road | N9 8RL N9 8RN |
| Marsden Road | N9 0SL N9 0SR |
| Marshside Close | N9 8LQ |
| Millbrook Road | N9 7HU N9 7HX N9 7HY |
| Monmouth Road | N9 0JA N9 0JB N9 0JD N9 0JE N9 0LE N9 0LG N9 0LR N9 0LS |
| Montagu Road | N9 0EU N9 0HP N9 0HR N9 0HS N9 0HT N9 0ER N9 0UR |
| Moss Close | N9 7JQ |
| Nash Road | N9 0LA |
| Nelson Road | N9 0RH N9 0RJ |
| Newdales Close | N9 7AF |
| Nightingale Road | N9 8PP N9 8QL |
| Nile Drive | N9 0FH N9 0FL N9 0FG N9 0FJ |
| North Way | N9 0AD N9 0AE |
| Osward Place | N9 7EF N9 7EQ |
| Oxford Close | N9 0NB |
| Oxford Road | N9 0LY N9 0NA |
| Pentland Close | N9 0XN |
| Picketts Lock Lane | N9 0AX N9 0AY N9 0BA |
| Prespa Close | N9 0FZ |
| Queens Road | N9 0RA N9 0RB |
| Ranworth Road | N9 0LN N9 0LT |
| Richmond Crescent | N9 7QJ |
| Rosemary Avenue | N9 8QT N9 8QU N9 8QX |
| Salmons Road | N9 7JT |
| Seymour Road | N9 0SE |
| South Road | N9 7JG N9 7JH |
| South Way | N9 0AB |
| St James' Road | N9 0QT N9 0QX N9 0QY |
| St Malo Avenue | N9 0RY N9 0SA |
| St Martins Road | N9 0SN |
| St Mary's Road | N9 8NZ N9 8NJ N9 8NN N9 8NP |
| St Peters Road | N9 8JJ N9 8JL N9 8JN N9 8JP |
| Steering Close | N9 8LZ |
| Strimon Close | N9 0FE |
| Sutherland Road | N9 7QD N9 7QE N9 7QG N9 7QL |
| Tigris Close | N9 0FF |
| Town Road | N9 0EX N9 0HH N9 0HJ N9 0HL N9 0RE N9 0RF N9 0RG N9 0RL N9 0RR N9 0SB N9 0SJ |
| Volta Close | N9 0HE |
| Warley Road | N9 8LN |
| Wellby Close | N9 7JF |
| Wellington Avenue | N9 0RN N9 0RP N9 0RW |
| Westbourne Place | N9 0RT |
| Westminster Road | N9 8RA N9 8RB N9 8RD |
| Westoe Road | N9 0SH |
| Woodlands Road | N9 8RP N9 8RR N9 8RS N9 8RT |
| Wrampling Place | N9 7BJ |
| Zambezi Drive | N9 0FT N9 0GU |
Transport near Lower Edmonton
-
Edmonton Green Station
-
Angel Road Station
-
Silver Street Station
-
Bush Hill Park Station
-
Ponders End Station
-
Southbury Station
-
White Hart Lane Station
-
Northumberland Park Station
-
Enfield Town Station
-
Brimsdown Station
- FAQ
- Price Paid By Year
- Property Type Price
Frequently asked questions about Lower Edmonton
What is the average price for a property for sale in Lower Edmonton?
The average price for a property for sale in Lower Edmonton is £357,666. This amount is 33% lower than the average price in London. There are 1,865 property listings for sale in Lower Edmonton.
What streets have the most expensive properties for sale in Lower Edmonton?
The streets with the most expensive properties for sale in Lower Edmonton are Crescent Road at an average of £510,000, Queens Road at an average of £463,000 and Goodwin Road at an average of £455,000.
What streets have the most affordable properties for sale in Lower Edmonton?
The streets with the most affordable properties for sale in Lower Edmonton are Lena Crescent at an average of £150,000, Jubilee Crescent at an average of £169,833 and Rosemary Avenue at an average of £193,000.
Which train stations are available in or near Lower Edmonton?
Some of the train stations available in or near Lower Edmonton are Edmonton Green, Angel Road and Silver Street.
Property Price Paid in Lower Edmonton by Year
The average sold property price by year was:
| Year | Average Sold Price | Price Change |
Sold Properties
|
|---|---|---|---|
| 2025 | £363,529 | 4% |
67 Properties |
| 2024 | £348,814 | -5% |
128 Properties |
| 2023 | £364,996 | -2% |
101 Properties |
| 2022 | £373,477 | 8% |
126 Properties |
| 2021 | £343,295 | 0,1% |
170 Properties |
| 2020 | £342,902 | 3% |
109 Properties |
| 2019 | £332,006 | 2% |
121 Properties |
| 2018 | £326,014 | -2% |
141 Properties |
| 2017 | £332,270 | 3% |
121 Properties |
| 2016 | £321,486 | 17% |
124 Properties |
| 2015 | £266,197 | 12% |
210 Properties |
| 2014 | £234,672 | 12% |
188 Properties |
| 2013 | £205,922 | 5% |
111 Properties |
| 2012 | £195,174 | 1% |
96 Properties |
| 2011 | £192,596 | -1% |
86 Properties |
| 2010 | £193,726 | 7% |
126 Properties |
| 2009 | £179,775 | -8% |
94 Properties |
| 2008 | £194,265 | -7% |
166 Properties |
| 2007 | £208,759 | 12% |
297 Properties |
| 2006 | £183,913 | 3% |
229 Properties |
| 2005 | £179,104 | 3% |
227 Properties |
| 2004 | £173,812 | 9% |
286 Properties |
| 2003 | £158,945 | 18% |
318 Properties |
| 2002 | £130,953 | 11% |
446 Properties |
| 2001 | £116,436 | 16% |
370 Properties |
| 2000 | £97,683 | 17% |
242 Properties |
| 1999 | £81,220 | 11% |
286 Properties |
| 1998 | £71,995 | 10% |
249 Properties |
| 1997 | £64,902 | 11% |
271 Properties |
| 1996 | £57,544 | 6% |
252 Properties |
| 1995 | £54,089 | - |
176 Properties |
Property Price per Property Type in Lower Edmonton
Here you can find historic sold price data in order to help with your property search.
The average Property Paid Price for specific property types in the last three years are:
| Property Type | Average Sold Price | Sold Properties |
|---|---|---|
| Flat | £233,008.00 | 62 Flats |
| Semi Detached House | £438,264.00 | 25 Semi Detached Houses |
| Detached House | £275,000.00 | 1 Detached House |
| Terraced House | £385,534.00 | 208 Terraced Houses |

